

Abstract
Background
Endometrioid endometrial carcinoma (EEC) is the most common form of endometrial carcinoma. The heterogeneous clinical course of EEC is an obstacle to individualized patient care.
Methods
We performed an integrated analysis on the multiple-dimensional data types including whole-exome and RNA sequencing, RPPA profiling, and clinical data from 271 EEC cases in The Cancer Genome Atlas (TCGA) to identify molecular fingerprints that may account for this clinical heterogeneity. Significance analysis of microarray was used to identify marker genes of each subtype that were subject to pathway analysis. Association of molecular subtypes with clinical features and mutation data was analyzed with the Mann Whitney, Chi-square, Fisher’s exact, and Kruskal-Wallis tests. Survival analysis was evaluated with log-rank test. All statistical tests were two-sided.
Results
Four transcriptome subtypes with distinct clinicopathologic characteristics and mutation spectra were identified from the TCGA dataset and validated in an independent sample cohort of 184 EEC cases. Cluster II consisted of younger, obese patients with low-grade EEC but diminished survival. CTNNB1 exon 3 mutations were present in 87.0% (47/54) of Cluster II (P < .001) that exhibited a low overall mutation rate; this was statistically significantly associated with Wnt/β-catenin signaling activation (P < .001). High expression levels of CTNNB1 (P = .001), MYC (P = .01), and CCND1 (P = .01) were associated with poorer overall survival in low-grade EEC tumors.
Conclusions
CTNNB1 exon 3 mutations are likely a driver that characterize an aggressive subset of low-grade and low-stage EEC occurring in younger women.
Endometrial carcinoma (EC) is the most common gynecological cancer in the western world, with approximately 49560 EC cases estimated in the United States in 2013 (1). In contrast to many other cancers, the incidence of endometrial cancer is increasing, likely because of the fact that obesity is a major risk factor for EC (2). This increased incidence is also associated with increased mortality, as the deaths from EC in the US have increased dramatically, from 2900 deaths in 1987 to 8190 deaths in 2013, a 2.8x increase over 25 years. Endometrial cancer is clinically categorized into two subtypes that help to determine risk of recurrence and guide treatment (3). Type I carcinomas, which account for the majority of cases (70–80%), are typically associated with a good prognosis, early stage at diagnosis, estrogen signaling, obesity, and low-grade endometrioid histology (EEC). Type II cancers are characterized by high stage at time of diagnosis, nonendometrioid histology, and poor prognosis. Differences in molecular aberrations between these two types of EC have been previously reported (3–5). Clustering analysis of all EC samples together commonly segregates cases based largely on differences between serous vs endometrioid histologies (3,6). A more defined tumor classification for EEC, the largest histological group of EC, is needed.
Whereas type II EC invariably exhibits poor prognosis, the clinical course for type I EC can be unpredictable (7). Overall outcomes for EEC vary with International Federation of Gynecology and Obstetrics (FIGO) stage and tumor grade, but individual patients with endometrioid carcinomas have statistically significantly different clinical courses and show different responses to therapy, despite having tumors with similar histopathology (8). Histology is therefore insufficient to predict clinical course for EEC, and presently no clinical laboratory assay addresses this unmet need.
We propose that molecular subtyping of EEC may inform diagnosis and prognosis of women with low grade, early-stage disease by identifying molecular attributes defining EEC case patients at risk for a more aggressive clinical course; patients with such tumors may benefit from more aggressive management. We performed new analyses of whole-exome and RNA sequencing, RPPA profiling, and clinical data archived by TCGA for more than 200 EEC case patients. Reanalysis of the TCGA data of EEC samples and excluding those with serous histology identified four transcriptome subtypes in EEC that exhibited distinct clinicopathologic characteristics and mutation spectra. One of the subtypes identifies an aggressive variant of type I EEC previously not recognized.
Methods
Patient Samples
Clinical and gene expression data for 271 EEC patients were obtained from the TCGA data portal (6) on March 1, 2013. Access to the TCGA database was approved by the National Cancer Institute. One hundred and eighty-four EEC patients in the validation set were diagnosed at MD Anderson Cancer Center (MDACC) from 1998 to 2009 and reviewed for grade and stage by two independent pathologists. Written consent was obtained from all living patients. The study was approved by the National Cancer Institute and by the institutional review board at MDACC. Detailed patient demographics for both cohorts are listed in Supplementary Table 1 (available online).
Gene Expression Data Analysis, GSEA, and Pathway Analysis
Gene expression data were first median centered and log transformed. The normalized gene expression dataset was filtered as described previously (6) to include 2786 consistent but variably expressed genes. K-Means unsupervised clustering with a randomized selection of the initial cluster centroids was used as our basis for consensus clustering. The distance metric was one minus the Pearson’s correlation coefficient, and the procedure was repeated over 1000 times. The average and median silhouette width values (9) were next calculated for increasing number of clustering, k = 2, till k = 7.
Significance analysis of microarray (SAM) was used to identify marker genes of each subtype. Each class was compared with the other three classes combined, and each class was compared with the other individual classes in a pairwise manner. We provided both rank order and test statistic for all of these analyses, and a combined statistic was used for selecting the signature genes. Gene set enrichment analysis (GSEA) (10) was used to associate the gene signature with the CTNNB1 mutation status. The genes identified to be on the leading edge of the enrichment profile were subject to pathway analysis (Ingenuity Pathway Analysis).
Surrogate Validation of EEC Subtypes
The reverse phase protein array (RPPA) subtyping of the TCGA set was determined via supervised analysis of the RPPA samples with the gene expression subtypes, resulting in 56 in Cluster I, 49 in Cluster II, 56 in Cluster III, and 50 in Cluster IV. The RPPA profiles of 184 validation EEC samples were obtained from MD Anderson (http://app1.bioinformatics.mdanderson.org/tcpa/_design/basic/index.html). The validation samples were classified according to the four TCGA RPPA classes using single sample interprofile correlation (score). The score indicates how closely the RPPA profile in a sample reflects the expected RPPA pattern of the four EEC subtypes and a sample was therefore assigned to the subtype with the highest score. This analysis identified 72 cases in Cluster I, 54 in Cluster II, 33 in Cluster III, and 25 in Cluster IV in the validation set.
Mutation Data Analysis
One hundred and ninety-two EEC had both gene expression and mutation data, of which 65 cases were from Cluster I, 54 from Cluster II, 37 from Cluster III, and 36 from Cluster IV. Variants were annotated as somatic mutations if they were not observed in the normal samples. The single-nucleotide substitutions included the silent and nonsilent mutations that comprised missense, nonsense, splice-site mutations, and mutations in noncoding RNA genes. Mutations affecting the 3’UTR, 5’UTR, intronic, and intergenic sequences were excluded from the study. Fractions of single-nucleotide substitutions in the six possible mutation classes (ie, C>T, C>A, C>G, A>G, A>C, and A>T) were calculated for each sample.
Statistical Analysis
Standard statistical tests were used to analyze the clinical and genomic data, including the Mann Whitney U, Chi-square, Fisher’s exact, Kruskal-Wallis, and Log-rank tests. Cox proportional hazards analysis was used to obtain statistical significance for the association between gene expression and survival. The proportional hazards assumption was verified to hold using the scaled Schoenfeld residuals. Statistical significance was defined as a P value less than .05. Analyses were primarily performed using scientific software such as Matlab (MathWorks, Inc., Natick, MA), SPSS version 18 (SPSS, Inc., Chicago, IL), and GraphPad Prism (version 5.04, La Jolla, CA). All statistical tests were two-sided.
Results
Identification of Gene Expression Subtypes in EEC
Consensus unsupervised clustering of gene expression profiling for 271 EEC (Supplementary Table 1, available online) identified four transcriptome clusters with distinct gene signatures (Figure 1A; Supplementary Figure 1 and Table 2, available online). The four clusters were statistically significantly associated with tumor stage (P = .004, Chi-square test), grade (P < .001), MSI status (P < .001) (Figure 1A), and the three mRNA clusters reported from the TCGA network (P < .001) (Supplementary Table 3, available online) (6) but not with the inflammatory infiltrate (Supplementary Figure 2, available online). Clusters III and IV consisted of most of the grade 3 (85 of 102, 83.3%) and stage III or IV (37 of 52, 71.2%) tumors, whereas Clusters I and II consisted primarily of the low-grade (1 and 2) and low-stage (I and II) tumors (Supplementary Table 4, available online).
Figure 1.
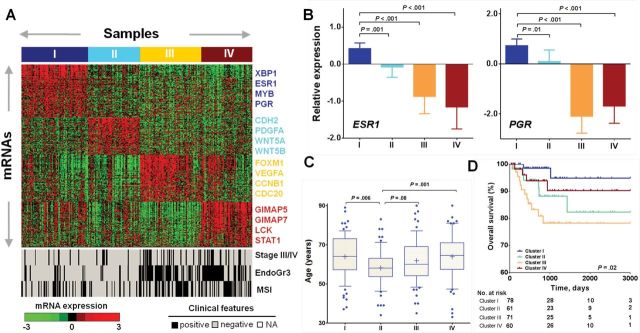
Identification of gene expression subtypes in EEC. A) Consensus clustering of RNAseq profiling identified four gene expression subtypes that were visualized using each respective gene signature (top). Samples were grouped on the basis of subtype predictions. Expression levels for each gene were normalized across the 271 data set such that the mean is zero and the standard deviation is equal to 1. Expression levels greater than the mean are shaded in red, and those below the mean are shaded in green. Clinical features for each sample were illustrated by black cells for stage III/IV or grade 3 or MSI high status, white for stage I/II, or grade 1/2 or MSI low or MSS status (bottom). B) The mRNA expression levels of both estrogen receptor 1 (ESR1) and progesterone receptor (PGR) were statistically significantly higher in Cluster I, as compared with the other three clusters. Data are presented as mean with 95% confidence intervals. The P values were calculated using the Mann Whitney test. C) Cluster II was statistically significantly enriched with patients of younger age. Data are represented as box plots. The central line of each box is the median and edges are the 25th and 75th percentile. The whiskers extend to the 10th and 90th percentile, and data points outside the whiskers are plotted individually as dots. The plus signs indicate the mean values. The P values were calculated using the Mann Whitney test. D) Kaplan-Meier curve demonstrates statistically significant association of the four gene expression clusters with overall survival. All statistical tests were two-sided.
Although Clusters I and II shared the clinical feature of being low-grade and low-stage, they exhibited very different molecular characteristics. Cluster I cases had statistically significantly more MSI-high tumors (P = .007, Fisher’s exact test, Figure 1A), higher expression of estrogen receptor 1 (ESR1) and progesterone receptor (PGR) (Figure 1B). Cluster II was enriched with younger patients (P = .006, Mann Whitney test) (Figure 1C). Kaplan-Meier survival analysis showed a statistically significant association of these four subtypes with overall survival (OS, median follow-up, 764 days) (P = .02, Long rank) (Figure 1D) and that patients in Cluster II exhibited a trend toward worse progression-free survival (PFS, median follow-up, 706 days) for those with sufficiently long follow-up (Supplementary Figure 3, available online). Multivariable analysis by Cox proportional hazard model showed that patients in Cluster II experienced poorer survival than those in Cluster I after controlling for grade, stage and age (Supplementary Table 5, available online). Body mass index (BMI) is comparable between Clusters I and II (Supplementary Figure 4, available online).
Association of the Four EEC Subtypes With Mutation Spectra
To gain insight into the genetic determinants of the four transcriptome clusters, we examined case-matched whole-exome mutation data available from the TCGA database. The four EEC subtypes showed statistically significantly different mutation rates (P < .001, Kruskal-Wallis test) (Figure 2A). Cluster I median mutation rate was 2.0 per megabase (Mb), similar to 1.6 per Mb for Cluster II; both were much lower than those of Clusters III and IV (>10 per Mb). One sample from Cluster I, four samples from Cluster II, and eight samples from Cluster IV had extremely high mutation rates of greater than 100 per Mb (hypermutators with associated PolE mutations) (6). In addition, we found that these four clusters statistically significantly differed in C to G transversion (P < .001) and T to C transition (P = .01) (Figure 2B), but no statistically significant association was observed for the other mutation classes (Supplementary Figure 5, available online).
Figure 2.
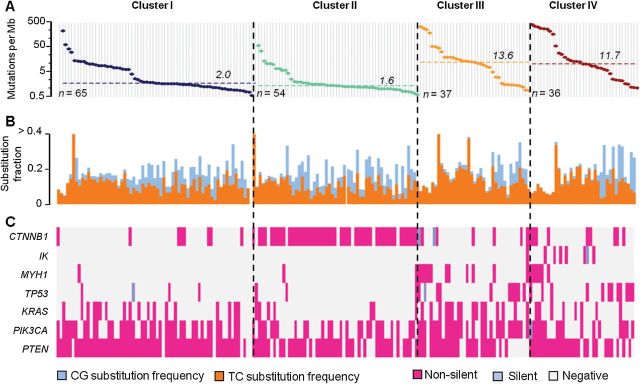
Association of the four EEC subtypes with mutation spectra. A) Genome-wide mutation frequencies (vertical axis) are plotted for each tumor (horizontal axis) in the order of descending mutation frequency within each subtype. The median mutation rate for each subtype was indicated by the dashed line. B) These four clusters were statistically significantly associated with C to G transversion (P < .001) and T to C transition (P = .01). The ratio of C to G nucleotide substitutions to T to C nucleotide substitutions was statistically significantly lower in Cluster III but higher in Cluster II. All statistical tests were two-sided. C) Association of the four gene expression subtypes with somatic mutations showing nonsilent mutations in pink and synonymous mutations in light blue.
Among the statistically significantly mutated genes reported by TCGA (6), approximately 15% of cases had TP53 mutations, most of which were in Clusters III and IV (P < .001, Chi-square test). PTEN mutation was statistically significantly correlated with the four subtypes (P = .03) and occurred in over 90% of patients in Cluster I but only in 74% of Cluster II. Cluster III had more frequent MYH1 (P < .001) and KRAS (P = .007) mutations which were all nonsynonymous; IK mutations, including seven nonsilent and one silent mutation, were all in Cluster IV (P < .001).
Most prominently, Cluster II was statistically significantly enriched with CTNNB1 gene mutations (P < .001, Chi-square test); 87.0% (47/54) of tumors in this cluster, in contrast to only 24/138 tumors in other clusters, carried CTNNB1 mutations. The majority of CTNNB1 missense mutations (63 of 71, ~88.7%) were identified in exon 3 within a stretch of 14 amino acids (from codon 32 to 45) (Figure 3, genespot.org). The remainder (~11.3%) occurred outside exon 3 mainly in the hypermutated cases (Figure 3). Two cases in Cluster II had two missense mutations each in the CTNNB1 gene (Q623E/I35S and S646F/S37C). Thus, all the CTNNB1 mutated cases in Cluster II had at least one mutation in exon 3, and none of them were hypermutators. The CTNNB1 hotspot mutations either involve or are in proximity to known phosphor-acceptor sites, indicated by the red lines beneath the β-catenin protein structure (Figure 3). The majority of the CTNNB1 mutations occur at serine (S33, S37, and S45) and threonine (T41) residues, known phosphorylation targets for glycogen synthase kinase 3-beta (GSK-3β) (11). CTNNB1 mutations in exon 3 occurred in tumors with a lower genome wide mutation rate (median mutation: 1.8 per Mb) than CTNNB1 wild-type cases (median mutation: 7.0 per Mb; P < .001, Mann Whitney test). In contrast, cases with CTNNB1 mutated outside exon 3 had a high median genome-wide mutation rate of nearly 274 per Mb (Supplementary Figure 6, available online). Consistently, a statistically significant correlation was found between the EEC subtypes and the integrated clusters in TCGA (6) (P < .001, Chi-square test) (Supplementary Table 6, available online). In the ultramutated (POLE) group, only one case occurred in Cluster II, and that case did not exhibit CTNNB1 mutation. In contrast, all those CTNNB1 mutated cases in this POLE group occurred in Cluster I, III, or IV and exhibited at least one mutation outside exon 3, which was associated with higher mutation rate.
Figure 3.
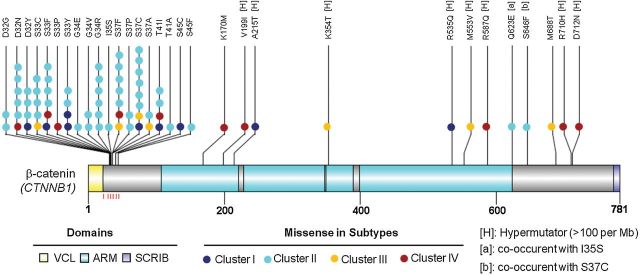
Somatic missense mutations in the CTNNB1 gene relative to the structure of the encoded protein. Schematic diagram of the β-catenin protein (accession no. NP_001091679) showing the positions of individual somatic alterations identified in endometrioid endometrial tumors. Alterations in Cluster I (dark blue), II (cyan), III (light yellow) and IV (dark red) tumors are distinguished. Alterations associated with hypermutated samples (mutation rate > 100 per Mb) are indicated by [H]. The sites of phosphorylation by GSK-3β are indicated by the red lines underneath the protein structure. Known functional domains of the protein are indicated. ARM = Armadillo/beta-catenin-like repeats; SCRIB = interaction with SCRIB (by similarity); VCL = interaction with VCL (by similarity).
Association of CTNNB1 Exon 3 Mutations With Wnt/β-catenin Pathway Activation
To assess if a characteristic gene expression profile for Cluster II is associated with CTNNB1 mutation, we first performed GSEA (12) and found that the genes differentially expressed between tumors of differing CTNNB1 mutation status were positively correlated with the gene expression signature of Cluster II with an enrichment score (ES) of 0.89 (P < .001) (Figure 4A). All the signature genes had a ranking score of greater than zero, and 85.6% (225 of 263) were on the leading edge of the enrichment profile. Pathway analysis of these 225 genes showed statistically significant enrichment of the Wnt/β-catenin signaling pathway (P < .001, Fisher’s exact test) (Figure 4B). The overexpressed genes included WNT5A, WNT ligand receptors (FZD8, FZD10), SRY (sex determining region Y)-box 9 (SOX9), and TCF/LEF-encoding genes (TCF7, LEF1) (Figure 4C; Supplementary Table 7, available online). In contrast, the Wnt/β-catenin signaling pathway was not enriched in cases where CTNNB1 was mutated outside exon 3 (Supplementary Figure 7, available online). Tumors in Cluster II did not show statistically significant alterations in copy number (Supplementary Table 8, available online) or promoter methylation (Supplementary Figure 8, available online) for APC, another key player involved in Wnt signaling pathway (13).
Figure 4.

CTNNB1 mutation association of Wnt/β-catenin signaling in Cluster II. A) Genes differentially expressed between CTNNB1-mutant and CTNNB1 wild-type tumors demonstrate statistically significant positive association by GSEA with the gene expression signature of Cluster II identified in Figure 1. The top portion shows the enrichment score (ES) test of genes associated with CTNNB1 mutation in Cluster II gene signature. The bottom portion shows the ranking scores in the whole genome. The middle portion of the plot shows where the signature genes appear in the raked gene list. B) Pathway analysis performed on 225 genes on the leading edge of the enrichment profile showing statistically significant enrichment of Wnt/β-catenin signaling by Ingenuity Pathway Analysis. P values were calculated using Fisher’s exact test and depicted on a log scale (-log10 P value). C) Schematic representation of the Wnt/β-catenin signaling pathway showing Wnt pathway genes with altered expression level indicated by the color bar. All statistical tests were two-sided.
Consistently, CTNNB1 exon 3 mutation, but not mutation outside exon 3, was statistically significantly correlated with younger patients in the TCGA cohort (P = .02, Mann Whitney test) (Supplementary Figure 9A, available online) and in the MDACC cohort (P = .002) (Supplementary Figure 9B, available online), where CTNNB1 mutation was detected only in exon 3 (14). Either positive or negative association of CTNNB1 mutation with low grade/stage or gene mutations (ie, TP53, KRAS) were found to be similar between these two different cohorts (Supplementary Figure 9C, available online) and consistent with previously published findings (15).
Although associated with younger age, patients in Cluster II experienced poorer overall survival compared to those in Cluster I (Figure 1D), which we hypothesize is a consequence of upregulated Wnt/β-catenin signaling in Cluster II. Supporting this notion, we found that high expression levels of multiple Wnt/β-catenin targets, including CTNNB1 (Log rank P = .001, Cox P = .008), MYC (Log rank P = .01, Cox P = .03), and CCND1 (Log rank P = .01, Cox P = .04) were associated with poorer overall survival (Figure 5, A-C). In contrast, elevated ESR1 mRNA was statistically significantly correlated with better overall survival (Log rank P = .02, Cox P < .001) (Figure 5D), consistent with high-level expression of ESR1 in Cluster I that had a favorable prognosis. These results are consistent with CTNNB1 mutation-associated activation of Wnt/β-catenin signaling pathway, causing poorer outcome for patients in Cluster II.
Figure 5.

Association of the Wnt/β-catenin pathway targets with patient outcome in low-grade endometrioid tumors. The subset of 169 low-grade (grade 1 or 2) EEC tumors were dichotomously categorized on the basis of each presented gene’s expression into two groups, expression high and expression low. Upregulation of Wnt/β-catenin signaling targets including A) CTNNB1, B) MYC, and C) CCND1 was statistically significantly associated with diminished overall survival in patients with low-grade endometrioid endometrial cancer. D) Upregulation of ESR1 mRNA was statistically significantly associated with better overall survival. All statistical tests were two-sided.
Surrogate Validation of EEC Subtypes in an Independent Dataset
Because a large data set comparable to TCGA is not publicly available, we next performed surrogate validation of the EEC subtypes using the RPPA platform to assess subtype reproducibility, evaluated by association with mutation profile, clinical covariates, and patient age. An independent data set of 184 EEC RPPA profiles along with mutation and clinical data was compiled from MDACC (14). A single-sample interprofile association was calculated to classify all the samples in the validation set (Figure 6A). Consistently, the four clusters in the validation set were associated with tumor grade (P < .001, Chi-square test) and stage (P = .002) (Figure 6A). Over two-thirds of the CTNNB1 mutations occurred in Cluster II. The CTNNB1 mutation frequency was statistically significantly higher in Cluster II (24 of 54) than the other three clusters (11 of 129) (P < .001, Fisher’s exact test), and TP53 mutations occurred more frequently in Clusters III/IV than Clusters I/II (P = .04). In addition, Cluster II was enriched with patients of younger age (Figure 6B). The four clusters were associated with progression-free survival but not with overall survival (median OS/PFS follow-ups, 829/848 days) (Supplementary Figure 10, available online). Taken together, this exploratory analysis revealed that the four clusters in the validation set resembled the associative patterns with clinical features and mutation profiles identified from the TCGA cohort, suggesting the robustness of the four molecular subtypes in EEC.
Figure 6.
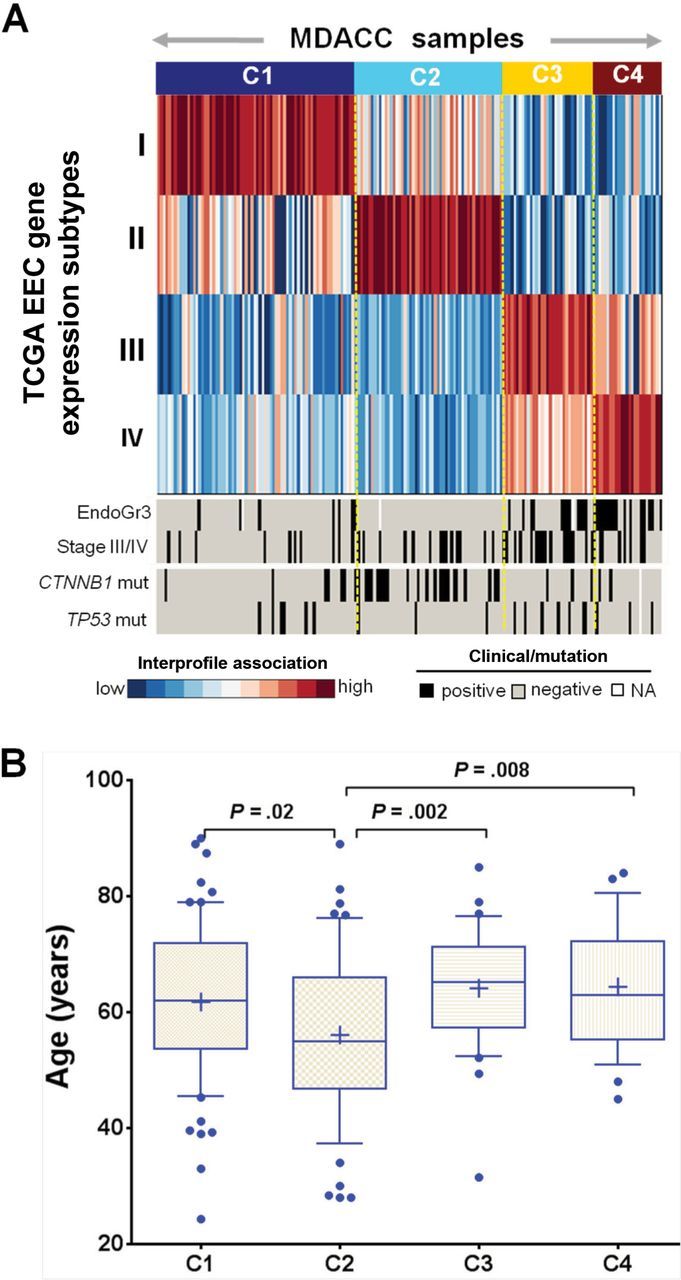
Surrogate validation of EEC subtypes. A) Single-sample interprofile association of the EEC subtypes classified the EEC tumors in an independent validation set. Association of the subtypes in the validation data set with clinical and mutation data was also shown. B) Association of patient age with the subtypes in the validation data set. Data are represented as box plots. The central line of each box is the median, and edges are the 25th and 75th percentile. The whiskers extend to the 10th and 90th percentile, and data points outside the whiskers are plotted individually as dots. The plus signs indicate the mean values. All statistical tests were two-sided.
Discussion
The current clinical dogma for endometrial cancer is that younger EEC patients are more likely obese with hormone-driven tumors that are low grade and low stage at the time of diagnosis and thus have a better prognosis. Our results clearly show that this group of patients is heterogeneous at the molecular and clinical level. Cluster I, characterized by higher levels of hormone receptors, fits the traditional view of obese endometrial cancer patients and exhibited better clinical outcome. However, Cluster II, also consisting of obese patients, is driven by CTNNB1 mutations and consequently exhibited a decreased survival compared to Cluster I. Identification of this Cluster II subtype helps to explain the clinical heterogeneity in EEC.
Statistically significant association of CTNNB1 mutations in exon 3 with a low overall genome-wide mutation rate suggests that these mutations are more likely to be functionally relevant than “passenger” events. This CTNNB1 exon 3 mutation hotspot contains the phosphorylation targets for the GSK-3β kinase affecting its ability to phosphorylate β-catenin, the lack of which results in β-catenin accumulation within the cell nucleus (11). Accumulation of nuclear β-catenin was statistically significantly associated with type I endometrial carcinomas in younger patients (16), which is consistent with statistically significant enrichment of younger patients in Cluster II. In addition, nuclear accumulation of β-catenin protein caused abnormal expression of cell proliferation and progression genes (17). Cells expressing the constitutively active β-catenin Ser33Tyr mutant, upregulated β-catenin–mediated transcription as compared to those expressing wild-type β-catenin (18,19). CTNNB1 mutations were also associated with upreguation of other members in the Wnt signaling pathway, such as WNT5A, SOX9, FZD10, LEF1, and TGFB2, that are established as molecular contributors to carcinogenesis and tumor progression (20–23). The clinical consequence of Wnt-pathway abnormal activation (24) was also evident in this study, which demonstrated that higher expression of Wnt downstream targets CTNNB1, MYC (13), and CCND1 (25) was statistically significantly associated with decreased overall survival.
Our study is not without limitations. Nearly 1/3 of the CTNNB1 point mutations result in amino acid substitutions at codons 32, 34, and 35, which are not GSK-3β phosphorylation targets. The mechanistic details underlying the effect of these mutations on β-catenin–mediated Wnt-signaling is not yet clear. Furthermore, the association of CTNNB1 mutation with survival should be validated in a prospectively acquired cohort of EEC patients before it can be incorporated into routine clinical practice.
In summary, women in Cluster II present with a molecularly and clinically distinct subtype of EEC defined by CTNNB1 mutations that might benefit from more individualized and aggressive management than is typically offered to younger EEC patients with low-grade or low-stage disease.
Funding
This study was partially supported by a Career Development Award from MD Anderson Gynecologic SPORE in Uterine Cancers (National Institutes of Health [NIH] 2P50 CA098258-08). We also received funding for the Genome Data Analysis Centers from the NIH (U24 CA143835 to IS and WZ) and funding for the Cancer Systems Informatics Center from the National Foundation for Cancer Research (to WZ).
The study sponsors had no role in the design of the study, the collection, analysis, or interpretation of the data, the writing of the manuscript, nor the decision to submit the manuscript for publication.
The authors declare no conflict of interest.
We would like to acknowledge The Cancer Genome Atlas (TCGA) research network. We thank Ann Sutton in the Department of Scientific Publications at the University of Texas MD Anderson Cancer Center for editing this manuscript and Jane Li for providing RPPA and clinical data of samples in an independent patient cohort.
References
- 1. Siegel R, Naishadham D, Jemal A. Cancer statistics, 2013. CA Cancer J Clin. 2013;63(1):11–30 [DOI] [PubMed] [Google Scholar]
- 2. Nagle CM, Marquart L, Bain CJ, et al. Impact of weight change and weight cycling on risk of different subtypes of endometrial cancer. Eur J Cancer. 2013;49(12):2717–2726 [DOI] [PubMed] [Google Scholar]
- 3. Salvesen HB, Carter SL, Mannelqvist M, et al. Integrated genomic profiling of endometrial carcinoma associates aggressive tumors with indicators of PI3 kinase activation. Proc Natl Acad Sci U S A. 2009;106(12):4834–4839 [DOI] [PMC free article] [PubMed] [Google Scholar]
- 4. Maxwell GL, Chandramouli GV, Dainty L, et al. Microarray analysis of endometrial carcinomas and mixed mullerian tumors reveals distinct gene expression profiles associated with different histologic types of uterine cancer. Clin Cancer Res. 2005;11(11):4056–4066 [DOI] [PubMed] [Google Scholar]
- 5. Mutter GL, Baak JP, Path FR, et al. Global expression changes of constitutive and hormonally regulated genes during endometrial neoplastic transformation. Gynecol Oncol. 2001;83(2):177–185 [DOI] [PubMed] [Google Scholar]
- 6. TCGA. Integrated genomic characterization of endometrial carcinoma. Nature. 2013;497(7447):67–73 [DOI] [PMC free article] [PubMed] [Google Scholar]
- 7. Mhawech-Fauceglia P, Wang D, Kesterson J, et al. Gene expressionprofiles in stage 1 uterine serous carcinoma in comparison to grade 3 and grade 1 stage 1 endometrioid adenocarcinoma. PloS One. 2011;6(3):e18066. [DOI] [PMC free article] [PubMed] [Google Scholar]
- 8. Suehiro Y, Umayahara K, Ogata H, et al. Genetic aberrations detected by comparative genomic hybridization predict outcome in patients with endometrioid carcinoma. Genes, Chromosomes & Cancer. 2000;29(1):75–82 [DOI] [PubMed] [Google Scholar]
- 9. Rousseeuw PJ. Silhouettes: a graphical aid to the interpretation and validation of cluster analysis. J Comput Appl Math. 1987;20:53–65 [Google Scholar]
- 10. Subramanian A, Tamayo P, Mootha VK, et al. Gene set enrichment analysis: A knowledge-based approach for interpreting genome-wide expression profiles. Proc Natl Acad Sci U S A. 2005;102(43):15545–15550 [DOI] [PMC free article] [PubMed] [Google Scholar]
- 11. Liu C, Li Y, Semenov M, et al. Control of beta-catenin phosphorylation/degradation by a dual-kinase mechanism. Cell. 2002;108(6):837–847 [DOI] [PubMed] [Google Scholar]
- 12. Mootha VK, Lindgren CM, Eriksson K, et al. PGC-1alpha-responsive genes invovled in oxidative phosphorylation are coordinately downregulated in human diabetes. Nat Genet. 2003;34(3):267–273 [DOI] [PubMed] [Google Scholar]
- 13. He TC, Sparks AB, Rago C, et al. Identification of c-MYC as a target of the APC pathway. Science. 1998;281(5382):1509–1512 [DOI] [PubMed] [Google Scholar]
- 14. Liang H, Cheung LW, Li J, et al. Whole-exome sequencing combined with functional genomics reveals novel candidate driver cancer genes in endometrial cancer. Genome Res. 2012;22(11):2120–2129 [DOI] [PMC free article] [PubMed] [Google Scholar]
- 15. McConechy MK, Ding J, Cheang M, et al. Use of mutation profiles to refine the classification of endometrial carcinomas. J of Pathology. 2012;228(1):20–30 [DOI] [PMC free article] [PubMed] [Google Scholar]
- 16. Peiro G, Peiro FM, Ortiz-Martinez F, et al. Association of mammalian target of rapamycin with aggressive type II endometrial carcinomas and poor outcome: a potential target treatment. Hum Pathol. 2013; 44(2):218–225 [DOI] [PubMed] [Google Scholar]
- 17. Klaus A, Birchmeier W. Wnt signaling and its impact on development and cancer. Nat Rev Cancer. 2008; 8(5):387–398 [DOI] [PubMed] [Google Scholar]
- 18. Korinek V, Barker N, Morin PJ, et al. Constitutive transcriptional activation by a beta-catenin-Tcf complex in APC-/- colon carcinoma. Science. 1997; 275(5307):1784–1787 [DOI] [PubMed] [Google Scholar]
- 19. Chan TA, Wang Z, Dang LH, et al. Targted inactivation of CTNNB1 reveals unexpected effects of beta-catenin mutation. Proc Natl Acad Sci U S A. 2002;99(12):8265–8270 [DOI] [PMC free article] [PubMed] [Google Scholar]
- 20. Kanzawa M, Semba S, Hara S, et al. WNT5A is a key regulator of the epithelial-mesenchymal transition and cancer stem cell properties in human gastric carcinoma cells. Pathobiology. 2013;80(5):235–244 [DOI] [PubMed] [Google Scholar]
- 21. Shelton DN, Fornalik H, Neff T, et al. The role of LEF1 in endometrial gland formation and carcinogenesis. PloS One. 2012;7(7):e40312. [DOI] [PMC free article] [PubMed] [Google Scholar]
- 22. TCGA. Comprehensive molecular characterization of human colon and rectal cancer. Nature. 2012;487(7407):330–337 [DOI] [PMC free article] [PubMed] [Google Scholar]
- 23. Zhou W, Lin L, Majumdar A, et al. Modulation of morphogenesis by noncanonical Wnt signaling requires ATF/CREB family-meidated transcriptional activation of TGFB2. Nat Genet. 2007;39(10):1225–1234 [DOI] [PMC free article] [PubMed] [Google Scholar]
- 24. Clevers H, Nusse R. Wnt/beta-catenin signaling and disease. Cell. 2012;149(6):1192–1205 [DOI] [PubMed] [Google Scholar]
- 25. Shtutman M, Zhurinsky J, Simcha I, et al. The cyclin D1 gene is a target of the beta-catein/LEF-1 pathway. Proc Natl Acad Sci U S A. 1999;96(10):5522–5527 [DOI] [PMC free article] [PubMed] [Google Scholar]