

Abstract
Background
Greater degrees of terminal duct lobular unit (TDLU) involution have been linked to lower breast cancer risk; however, factors that influence this process are poorly characterized.
Methods
To study this question, we developed three reproducible measures that are inversely associated with TDLU involution: TDLU counts, median TDLU span, and median acini counts/TDLU. We determined factors associated with TDLU involution using normal breast tissues from 1938 participants (1369 premenopausal and 569 postmenopausal) ages 18 to 75 years in the Susan G. Komen Tissue Bank at the Indiana University Simon Cancer Center. Multivariable zero-inflated Poisson models were used to estimate relative risks (RRs) and 95% confidence intervals (95% CIs) for factors associated with TDLU counts, and multivariable ordinal logistic regression models were used to estimate odds ratios (ORs) and 95% CIs for factors associated with categories of median TDLU span and acini counts/TDLU.
Results
All TDLU measures started declining in the third age decade (all measures, two-sided P trend ≤ .001); and all metrics were statistically significantly lower among postmenopausal women. Nulliparous women demonstrated lower TDLU counts compared with uniparous women (among premenopausal women, RR = 0.79, 95% CI = 0.73 to 0.85; among postmenopausal, RR = 0.67, 95% CI = 0.56 to 0.79); however, rates of age-related TDLU decline were faster among parous women. Other factors were related to specific measures of TDLU involution.
Conclusion
Morphometric analysis of TDLU involution warrants further evaluation to understand the pathogenesis of breast cancer and assessing its role as a progression marker for women with benign biopsies or as an intermediate endpoint in prevention studies.
Terminal duct lobular units (TDLUs) are the structures within the breast that produce milk and the primary source of most breast cancer precursors and cancers (Figure 1) (1). With completion of childbearing and physiological aging, TDLUs involute, resulting in a reduction in acini (substructures) number/TDLU and total TDLU counts (2–3). The determinants of age-related TDLU involution are undefined, and understanding these processes may elucidate factors associated with persistence of acini and TDLUs in later life, and elevated breast cancer risk (3). Analysis of women who have undergone a breast biopsy, which showed benign breast disease (BBD), suggests that those who have less TDLU involution are more likely to develop breast cancer than those with greater degrees of involution, extending findings in rodent models linking mammary development, microanatomy, and cancer susceptibility (3–11).
Figure 1.
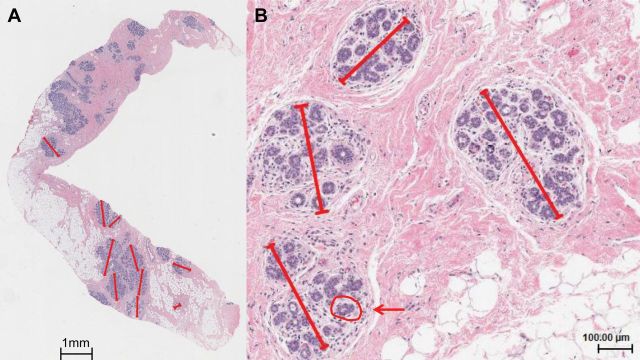
Terminal duct lobular unit (TDLU) involution assessment in the Susan G. Komen Tissue Bank. Three quantitative measures (TDLU count, TDLU span, and number of acini per TDLU) associated with reduced levels of TDLU involution were assessed from digitized images of H&E stained tissue sections. A) A digital H&E section with multiple TDLUs (TDLU count). For up to 10 TDLUs per section, the longest TDLU span was measured in microns and the counts of acini/TDLU in categories (1 = <10, 2 = 11–20, 3 = 21–30, 4 = 31–50, and 5 = 51+) recorded (0.75x). B) Representative TDLUs for which the longest TDLU span was measured in microns using a digital ruler (4.27x). A representative acinus is circled in red and indicated with an arrow.
Standardized, reproducible quantitative measurements to evaluate TDLU involution have not been developed. An analysis of benign biopsies from 8756 women in the Mayo BBD Cohort found that the absence of TDLU involution, based on subjective assessment, was associated with a statistically significant increase in breast cancer risk (relative risk [RR] = 1.88, 95% CI = 1.59 to 2.21) compared with the general population (8). Additional analyses in this cohort demonstrated that increased acini counts/TDLU or TDLU area were related to increased five-year risk independent of Gail model risk prediction (7). Using an adaptation of a TDLU involution classification developed in rodent models (11), the Nurses’ Health Study II demonstrated a 29% reduction in cancer risk among women with BBD containing predominantly type 1 lobules (fewer than 12 acini) and lacking type 3 lobules (approximately 80 acini) (4).
To date, studies of TDLU involution have been limited by a lack of access to large collections of epidemiologically annotated normal breast samples that were obtained for research as opposed to clinical diagnosis (3,12). The Susan G. Komen Tissue Bank at the Indiana University Simon Cancer Center (KTB) addresses these limitations by providing a resource of normal breast tissues, risk factor data, and blood from volunteers for research (13–14). Given that the best method for assessing the level of TDLU involution is unknown, we performed morphometric assessment of TDLUs and developed three reproducible quantitative measures that are inversely associated with TDLU involution, TDLU counts per standardized biopsy, median acini counts/TDLU, and median TDLU span, in order to identify factors associated with TDLU involution in normal breast tissues from the KTB.
Methods
Study Population
The KTB biorepository of specimens from women volunteers is described in detail elsewhere (http://komentissuebank.iu.edu/) (13–15). Donors provided written informed consent, and were recruited under a protocol approved by the Indiana University Institutional Review Board. The current project received additional approval from the National Institutes of Health (NIH) Office of Human Subjects Research (OHSR).
We received data from 2197 consented women aged 18 to 91 years who were enrolled in KTB from 2009 to 2012. Ten women without available tissues, 177 with a history of cancer (67 breast and 110 other sites), 18 who were pregnant, 37 with indeterminate menopausal status, and 17 older than 75 years were excluded, resulting in an analytical dataset of 1938 participants.
Exposure Assessment
Participants completed questionnaires asking about demographic characteristics, reproductive and menstrual history, medical history, family history of breast or ovarian cancer, medication use, gynecologic surgeries, and mammographic screening. Women were classified as current smokers, former smokers if they had previously smoked for one year or more, or nonsmokers. Among parous women, age at first birth was analyzed categorically (<25, 25–29, and ≥30 years). Women who breastfed for more than one month were classified as having ever breastfed. We classified women as postmenopausal: 1) if they reported that their menstrual periods had stopped at least 12 months prior to tissue donation (unrelated to oral contraceptive use), 2) had undergone a bilateral oophorectomy, or 3) had a hysterectomy without bilateral oophorectomy and were at least 55 years of age. Menopausal hormone use was categorized as current, former, or never. Body mass index (BMI) was calculated from reported weight and height (kg/m2) and assessed categorically (<25kg/m2, 25–29kg/m2, ≥30kg/m2).
Breast Tissue Collection
Up to four tissue cores were removed from the upper outer quadrant of the breast (left or right) with a 10-gauge needle. One core was fixed in 10% buffered formalin, routinely processed as paraffin embedded blocks, sectioned, and stained with hematoxylin and eosin. Digitized images of these sections were used for analysis of TDLU involution (see below).
Histologic Assessment of TDLU Involution
Stained tissue sections were digitized at 20X magnification (Aperio ScanScope CS, Vista, CA), and prepared for web-based viewing and annotation with Digital Image Hub software (Slidepath/Leica, Dublin, Ireland). Breast tissues containing TDLUs displaying focal benign changes (duct dilatation, metaplasia, hyperplasia) (13) were assessed, provided that normal TDLUs were present (8,16). TDLUs were not evaluated if more than half the acini were dilated two to three times the normal diameter or if metaplastic changes involved more than half the acini. TDLUs showing ductal hyperplasia, defined as ducts or acini lined by more than a single epithelial cell layer, were excluded. Most samples did not show benign changes (13), and when present, changes were typically focal, allowing assessment of normal TDLUs within the same tissue.
Images of sections were reviewed blinded to other data to estimate the percentage of fat (0–25%, 26–50%, 51–75%, 76–100%), and to enumerate TDLUs. The median tissue area reviewed was 34.51mm2 (SD = 17.57 mm2); TDLU counts and TDLU counts per mm2 were highly correlated (Spearman rho = 0.98), and only the former is presented. Up to 10 normal TDLUs were reviewed sequentially to assess: 1) TDLU span, measured with an electronic ruler (microns) and 2) acini counts/TDLU in categories (1 = ≤10, 2 = 11–20, 3 = 21–30, 4 = 31–50, 5 = >50) (Figure 1), to provide stable representative measures of TDLU involution (7,17–18). For acini counts/TDLU and TDLU span measures, we used the median of the values obtained across the multiple TDLUs measured for each woman.
Intraobserver agreement for the reviewer (MES) demonstrated Spearman correlation coefficients greater than .90 for all comparisons; an interobserver reproducibility analysis among three independent reviewers including MES, yielded Spearman correlations ranging between .66 and .96 (see the Supplementary Materials, available online). TDLU counts showed the highest correlation between pathologists, (rho ≥ 0.86), followed by median acini (rho ≥ 0.71), and TDLU span measures (rho ≥ 0.66). The three TDLU measures were correlated with qualitative assessment of TDLU involution, which has been previously demonstrated to predict breast cancer risk among women with benign breast biopsies (see the Supplementary Materials, available online, for details) (13).
Statistical Analysis
Relationships between TDLU measures (TDLU counts, median TDLU span, and median category of acini counts/TDLU) were assessed with Spearman correlations. A lowess function was used to estimate and plot the average of TDLU measures as a function of age (19). Change-point analysis was performed to assess if slopes of mean TDLU measures changed in relation to age (22). Subsequent analyses were separated by menopausal status and adjusted for age. We included factors in multivariable analysis if they were associated with a P trend less than .05 or if any level of a categorical variable yielded P less than .05. Only results of multivariable models are presented. TDLU counts included a substantial number of samples with zero counts, and thus a standard Poisson model did not provide an adequate fit to the data. Relative risk (RRs) and 95% confidence intervals (CIs) were estimated using zero-inflated Poisson regression, an extension of Poisson regression that can accommodate the high number of zero values (20). Median TDLU span and acini/TDLU were categorized into tertiles. Associations of lifestyle/demographic factors and categories of median TDLU span and acini/TDLU were assessed using ordinal logistic regression models (odds ratios [ORs] and 95% CIs) (21). Analyses included all subjects and were adjusted for racial/ethnic group.
A lowess function was used to estimate and plot the average of TDLU measures as a function of age, separately for parous and nulliparous women. Age at last birth was not assessed on the questionnaire, therefore, age at last birth and time since last birth were only available for uniparous women. Thus, we imputed age at last birth to also calculate time since last birth for multiparous women and accounted for the imputation in the association analysis (see the Supplementary Materials, available online, for details). Associations between exposures and TDLU measurements were evaluated for statistical significance using Wald tests. Analyses were performed using SAS9.3. Plots were created in R using the “lowess” function. All statistical tests were two-sided, and a P value of less than .05 was considered statistically significant.
Results
Characteristics of Subjects
Select characteristics of participants are presented in Table 1. Participants were predominantly non-Hispanic white, premenopausal, and highly educated. Among premenopausal women, 51.0% were nulliparous and 31.6% were current users of hormonal birth control. Among postmenopausal women, 27.3% reported having undergone a prior breast biopsy, 40.1% had a body mass index [BMI] of 30kg/m2 or more, and 14.9% were current menopausal hormone users. A history of a first-degree relative with breast cancer was reported among 17.9% of premenopausal and 25.0% of postmenopausal women.
Table 1.
Select characteristics of subjects from the Susan G. Komen Tissue Bank, by menopausal status (n = 1938)
| Characteristic | Premenopausal (n = 1369) | Postmenopausal (n = 569) |
|---|---|---|
| No. (%)* | No. (%)* | |
| Age, y | ||
| <30 | 452 (33.0) | 0 (0) |
| 30–39 | 410 (29.9) | 15 (2.6) |
| 40–49 | 395 (28.9) | 68 (12) |
| 50–59 | 112 (8.2) | 264 (46.4) |
| 60–75 | 0 (0) | 222 (39) |
| Race/ethnicity | ||
| Non-Hispanic Caucasian | 965 (70.5) | 414 (72.8) |
| African American | 249 (18.2) | 117 (20.6) |
| Asian | 25 (1.8) | 22 (3.9) |
| Hispanic | 107 (7.8) | 16 (2.8) |
| Other/missing | 23 (1.7) | 0 (0) |
| Education | ||
| High school/GED or less | 291 (21.3) | 95 (16.7) |
| Vocational/tech school or associates degree | 188 (13.7) | 106 (18.6) |
| College degree | 512 (37.4) | 148 (26.0) |
| Graduate/professional degree | 296 (21.6) | 163 (28.6) |
| Smoking | ||
| Never | 1,039 (75.9) | 358 (62.9) |
| Former | 217 (15.9) | 168 (29.5) |
| Current | 89 (6.5) | 32 (5.6) |
| Body mass index, kg/m2 | ||
| <25 | 522 (38.1) | 151 (26.5) |
| 25–29 | 360 (26.3) | 187 (32.9) |
| ≥30 | 484 (35.4) | 228 (40.1) |
| Age at menarche, y | ||
| ≤12 | 702 (51.3) | 276 (48.5) |
| 13 | 366 (26.7) | 154 (27.1) |
| ≥14 | 300 (21.9) | 138 (24.3) |
| Current hormonal birth control use | ||
| No | 936 (68.4) | |
| Yes | 433 (31.6) | |
| Parity | ||
| Nulliparous | 698 (51.0) | 108 (19.0) |
| Parous | 671 (49.0) | 461 (81.0) |
| Number of live births | ||
| 1 | 183 (27.3) | 90 (19.5) |
| 2 | 312 (46.5) | 214 (46.4) |
| ≥3 | 176 (26.2) | 157 (34.1) |
| Age at first full-term birth, y | ||
| <25 | 269 (40.1) | 226 (49.0) |
| 25–29 | 215 (32.0) | 137 (29.7) |
| ≥30 | 185 (27.6) | 94 (20.4) |
| Breastfeeding | ||
| Never | 138 (20.6) | 150 (32.5) |
| Ever | 533 (79.4) | 310 (67.2) |
| Bilateral oophorectomy | ||
| No | 440 (77.3) | |
| Yes | 129 (22.7) | |
| Menopausal hormone therapy | ||
| Nonuser | 288 (50.6) | |
| Current user | 85 (14.9) | |
| Former user | 181 (31.8) | |
| Years since menopause | ||
| <5 | 126 (22.1) | |
| 5–10 | 93 (16.3) | |
| 11–15 | 78 (13.7) | |
| >15 | 59 (10.4) | |
| Gynecologic surgery | 211 (37.1) | |
| Number of first degree relatives with breast cancer | ||
| 0 | 1,123 (82.0) | 427 (75.0) |
| 1 | 218 (15.9) | 108 (19.0) |
| ≥2 | 28 (2.0) | 34 (6.0) |
| Ever had a breast biopsy | ||
| Never | 1,225 (89.5) | 410 (72.1) |
| Yes, 1 | 105 (7.7) | 116 (20.4) |
| Yes, ≥2 | 25 (1.8) | 39 (6.9) |
| H&E percent fat, % | ||
| 0–25 | 155 (11.3) | 18 (3.2) |
| 26–50 | 143 (10.4) | 36 (6.3) |
| 51–75 | 282 (20.6) | 88 (15.5) |
| 76–100 | 789 (57.6) | 427 (75.0) |
* Percentages might not total to 100 because of missingness.
Age, Menopausal Status and TDLU Involution
TDLU counts were weakly correlated with TDLU span (Spearman rho = 0.16, P < .001) and with acini counts/TDLU (Spearman rho = 0.18, P < .001); TDLU span and acini counts/TDLU were more strongly correlated (Spearman rho = 0.70, P < .001). All TDLU measures declined with advancing age, although the patterns of decline differed slightly between the measures (Figure 2). Statistically significant slope changes were noted for TDLU counts and acini counts/TDLU at age 44 years and at age 49 years for TDLU span.
Figure 2.
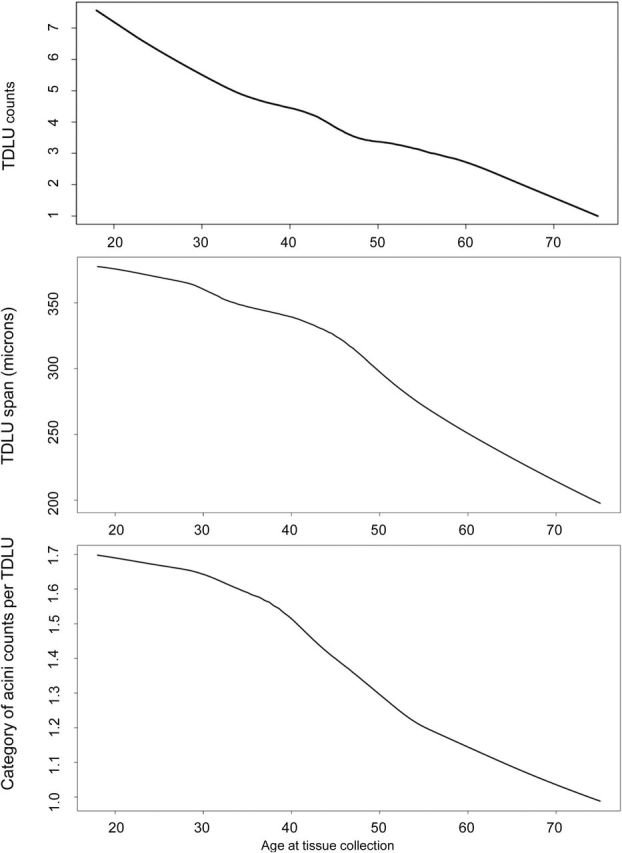
Relationship between age and terminal duct lobular unit (TDLU) counts, TDLU span, and category of acini counts/TDLU. A lowess function was used to estimate the average of TDLU counts, median TDLU span, and median acini counts/TDLU, as a function of age. The number of acini/TDLU was recorded in categories (1 = <=10, 2 =11–20, 3 =21–30, 4 = 31–50, and 5 = 51+). TDLU = terminal duct lobular unit.
In models adjusted for menopausal status, compared with women less than age 30 years, statistically significant declines starting at ages 40 to 49 years were found for TDLU counts (RR = 0.87, 95% CI = 0.83 to 0.91) and for acini counts/TDLU (OR = 0.54, 95% CI = 0.40 to 0.74). For TDLU span, declines occurred a decade earlier at ages 30 to 39 years (OR = 0.64, 95% CI = 0.48 to 0.87). All three TDLU measures were lower among postmenopausal as compared with premenopausal women (TDLU counts: RR = 0.82, 95% CI = 0.76 to 0.87; median TDLU span: OR = 0.62, 95% CI = 0.43 to 0.91; median acini counts/TDLU: OR = 0.55, 95% CI = 0.36 to 0.83).
A descriptive summary of the median and range of TDLU measurements by age and stratified by menopausal status is shown in Table 2. TDLU measurements displayed considerable variation among women; generally TDLU measures fell dramatically with age, with the exception of acini counts among postmenopausal women.
Table 2.
Summary of terminal duct lobular unit involution measures by age and separated by menopausal status
| Premenopausal women (n = 1369) | No. (%) | THLU count* (n = 1369) | No. (%) | Median THLU span (n = 949) | Median category of acini counts/THLU† (n = 949) | |||
|---|---|---|---|---|---|---|---|---|
| Category | Median | Range | Median | Range | Median | Range | ||
| Age, y | ||||||||
| <30 | 452 (33.0) | 5 | 0–62 | 322 (33.9) | 373.25 | 118–1000 | 2 | 1–5 |
| 30–39 | 410 (29.9) | 5 | 0–70 | 286 (30.1) | 338 | 84–1143 | 2 | 1–5 |
| 40–49 | 395 (28.9) | 3 | 0–57 | 272 (28.7) | 319.25 | 111.5–950 | 1.5 | 1–5 |
| 50–58 | 112 (8.2) | 2 | 0–46 | 69 (7.3) | 295 | 106–2150 | 1 | 1–5 |
| Postmenopausal women (n = 569) | No. (%) | TDLU count* (n = 569) | No. (%) | Median TDLU span (n = 330) | Median category of acini counts/TDLU † (n = 330) | |||
| Category | Median | Range | Median | Range | Median | Range | ||
| Age, y | ||||||||
| <50 | 83 (14.6) | 3 | 0–31 | 51 (15.5) | 278 | 117.5–1097.5 | 1 | 1–5 |
| 50–59 | 264 (46.4) | 2 | 0–34 | 163 (49.4) | 257.5 | 53–1375 | 1 | 1–5 |
| 60–75 | 222 (39.0) | 1 | 0–35 | 116 (35.2) | 237.5 | 79.5–869 | 1 | 1–5 |
* Terminal duct lobular unit (TDLU) count is highly correlated with TDLU density/mm2 (Spearman rho = 0.98) reflecting the standardized tissue collection procedures of the Susan G. Komen Tissue Bank at the IU Simon Cancer Center. The median tissue area = 34.51mm2 (SD = 17.57 mm2). TDLU = terminal duct lobular unit.
† The number of acini/TDLU was recorded in categories (1 = <=10, 2 = 11–20, 3 = 21–30, 4 = 31–50, and 5 = 51+). We computed the median acini category value and median TDLU span for each woman with TDLUs observed.
Parity and TDLU Involution
In multivariable zero-inflated Poisson models among premenopausal (Table 3) and postmenopausal (Table 4) women, nulliparous women had fewer TDLUs compared with uniparous women (premenopausal women: RR = 0.79, 95% CI = 0.73 to 0.85; postmenopausal women: RR = 0.67, 95% CI = 0.56 to 0.79). Among parous women, an increasing number of live births was associated with increasing TDLU counts (premenopausal P trend = .01, postmenopausal P trend = .007).
Table 3.
Select reproductive and demographic factors associated with terminal duct lobular unit counts among premenopausal women (n = 1343)
| Characteristic | 0 THLUs | ≥1 THLUs | Poisson regression | |
|---|---|---|---|---|
| N | N | RR (95% CI)* | P | |
| Age, y | ||||
| <30 | 128 | 313 | 1.00 (reference) | <.001† |
| 30–39 | 123 | 281 | 0.95 (0.90 to 1.00) | |
| 40–49 | 123 | 266 | 0.77 (0.73 to 0.82) | |
| 50–59 | 42 | 67 | 0.57 (0.52 to 0.63) | |
| Race/ethnicity | ||||
| Non-Hispanic Caucasian | 296 | 652 | 1.00 (reference) | <.001‡ |
| African American | 80 | 166 | 1.05 (1.00 to 1.11) | |
| Asian | 8 | 16 | 1.28 (1.12 to 1.46) | |
| Hispanic | 25 | 80 | 1.05 (0.99 to 1.13) | |
| Unknown/missing | 7 | 13 | 0.74 (0.61 to 0.90) | |
| Education | ||||
| High school/GED or less | 75 | 209 | 1.00 (reference) | .03‡ |
| Vocational/tech or associates degree | 58 | 128 | 1.06 (0.99 to 1.13) | |
| College degree | 147 | 354 | 1.06 (1.00 to 1.12) | |
| Graduate/professional degree | 102 | 189 | 1.01 (0.95 to 1.08) | |
| Unknown/missing | 34 | 47 | 0.94 (0.85 to 1.04) | |
| Smoking | ||||
| Never | 316 | 721 | 1.00 (reference) | <.001† |
| Former | 67 | 150 | 0.90 (0.85 to 0.95) | |
| Current | 33 | 56 | 0.80 (0.74 to 0.88) | |
| No. of live births | ||||
| Nulliparous | 232 | 450 | 0.79 (0.73 to 0.85) | <.001ठ|
| 1 | 50 | 132 | 1.00 (reference) | |
| 2 | 87 | 221 | 1.31 (1.22 to 1.40) | |
| ≥3 | 47 | 124 | 1.39 (1.28 to 1.50) | .01†ǁ |
| Age at first full-term birth, y | ||||
| <25 | 78 | 188 | 1.00 (reference) | .33† |
| 25–29 | 55 | 156 | 0.89 (0.84 to 0.95) | |
| ≥30 | 51 | 133 | 1.06 (0.99 to 1.13) | |
| Breastfeeding | ||||
| Never | 39 | 99 | 1.00 (reference) | .002‡ |
| Ever | 145 | 378 | 0.91 (0.86 to 0.97) | |
| Number of first-degree relatives with breast cancer | ||||
| 0 | 338 | 762 | 1.00 (reference) | .01† |
| 1 | 69 | 146 | 1.06 (1.01 to 1.12) | |
| ≥2 | 9 | 19 | 1.11 (0.97 to 1.26) | |
| Fat percentage, % | ||||
| 0–50 | 24 | 261 | 1.00 (reference) | <.001† |
| 51–75 | 26 | 251 | 0.76 (0.73 to 0.80) | |
| 76–100 | 366 | 415 | 0.40 (0.38 to 0.42) | |
* Relative risk and 95% confidence intervals were obtained from zero-inflated Poisson models. Poisson model was fit to both 0 and 1+ terminal duct lobular unit counts so that the groups jointly equaled to total subjects, and covariates were selected for inclusion in multivariable models if their trend or Wald test or any category was associated at P < .05. CI = confidence interval; RR = relative risk; TDLU = terminal duct lobular unit.
† Two-sided P value for trend test.
‡ Two-sided P value for Wald type 3 test.
§ Two-sided P value calculated for parous and nulliparous women.
ǁ P value for trend among parous women only.
Table 4.
Select reproductive and demographic factors associated with terminal duct lobular unit counts among postmenopausal women (n = 551)
| Characteristic | 0 THLUs | ≥1 THLUs | Poisson regression | |
|---|---|---|---|---|
| N | N | RR (95% CI)* | P | |
| Age, y | ||||
| <50 | 30 | 50 | 1.00 (reference) | .27† |
| 50–59 | 99 | 157 | 0.82 (0.73 to 0.92) | |
| 60–75 | 100 | 115 | 0.91 (0.79 to 1.05) | |
| Race/ethnicity | ||||
| Non-Hispanic Caucasian | 179 | 226 | 1.00 (reference) | .01‡ |
| African American | 34 | 77 | 0.95 (0.85 to 1.05) | |
| Hispanic | 10 | 11 | 0.97 (0.77 to 1.21) | |
| Other/missing | 6 | 8 | 0.58 (0.41 to 0.82) | |
| Education | ||||
| High school/GED or less | 29 | 61 | 1.00 (reference) | .004‡ |
| Vocational/tech or associates degree | 45 | 59 | 0.83 (0.72 to 0.95) | |
| College degree | 58 | 84 | 1.00 (0.88 to 1.14) | |
| Graduate/professional degree | 74 | 89 | 1.00 (0.88 to 1.14) | |
| Unknown/Missing | 23 | 29 | 0.81 (0.67 to 0.97) | |
| Age at menarche, y | ||||
| ≤12 | 118 | 149 | 1.00 (reference) | .006† |
| 13 | 56 | 92 | 0.82 (0.74 to 0.91) | |
| ≥14 | 55 | 81 | 0.89 (0.8 to 0.99) | |
| Number of live births | ||||
| Nulliparous | 52 | 53 | 0.67 (0.56 to 0.79) | .006ठ|
| 1 | 44 | 45 | 1.00 (reference) | |
| 2 | 75 | 130 | 1.09 (0.96 to 1.25) | |
| ≥3 | 58 | 94 | 1.20 (1.04 to 1.37) | .007†ǁ |
| Breastfeeding | ||||
| Never | 60 | 85 | 1.00 (reference) | <.001‡ |
| Ever | 117 | 184 | 1.24 (1.11 to 1.38) | |
| Bilateral oophorectomy | ||||
| No | 167 | 258 | 1.00 (reference) | .004‡ |
| Yes | 62 | 64 | 1.26 (1.08 to 1.47) | |
| Menopausal hormone therapy | ||||
| Nonuser | 111 | 175 | 1.00 (reference) | <.001‡ |
| Current user | 37 | 48 | 0.93 (0.81 to 1.06) | |
| Former user | 81 | 99 | 0.80 (0.71 to 0.89) | |
| Years since natural menopause | ||||
| <5 | 43 | 79 | 1.00 (reference) | <.001‡ |
| 5–10 | 39 | 52 | 0.90 (0.79 to 1.02) | |
| 11–15 | 30 | 44 | 0.98 (0.84 to 1.16) | |
| >15 | 30 | 27 | 0.70 (0.57 to 0.85) | |
| Gynecologic surgery | 87 | 120 | 0.79 (0.68 to 0.92) | |
| Number of first degree relatives with breast cancer | ||||
| 0 | 171 | 241 | 1.00 (reference) | <.001† |
| 1 | 44 | 61 | 1.26 (1.14 to 1.4) | |
| ≥2 | 14 | 20 | 1.25 (1.06 to 1.48) | |
| Fat percentage, % | ||||
| 0–75 | 15 | 121 | 1.00 (reference) | <.001† |
| 76–100 | 214 | 201 | 0.52 (0.48 to 0.57) | |
* Relative risk and 95% confidence intervals were obtained from zero-inflated Poisson regression models adjusted for age and all factors that showed an association with terminal duct lobular unit (TDLU) counts at P < .05. Poisson model was fit to both 0 and 1+ TDLU counts so that the groups jointly equaled to total subjects, and covariates were selected for inclusion in multivariable models if their trend or Wald test or any category was associated at P < .05. CI = confidence interval; RR = relative risk; TDLU = terminal duct lobular unit.
† Two-sided P value for trend test.
‡ Two-sided P value for Wald type 3 test.
§ Two-sided P value calculated for parous and nulliparous women.
ǁ P value for trend among parous women only.
Relationships between TDLU counts and age differed statistically significantly across nulliparous and parous women (P interaction ≤.001) (Figure 3). Among nulliparous women, TDLU counts declined at a slower rate with increasing age compared with parous women. TDLU counts were highest for parous compared with nulliparous women between ages 20 to 40 years, and then differences narrowed with advancing age, reaching equivalence around age 70 years. No differences were found for TDLU span or acini counts/TDLU by parity status.
Figure 3.
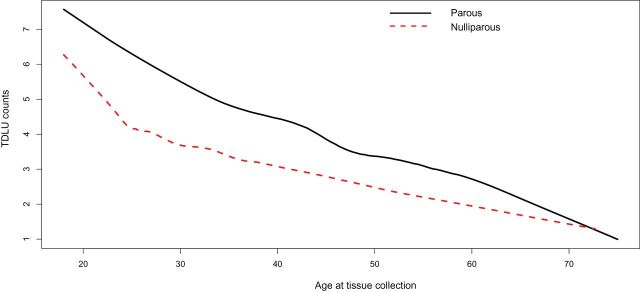
Impact of parity on the association between TDLU counts and age. A lowess function was used to estimate the average of TDLU counts stratified by parity status as a function of age. TDLU = terminal duct lobular unit.
Among uniparous women, age-adjusted analyses demonstrated that TDLU metrics declined in relation to time since last birth (Supplementary Table 1). In analyses in which missing data for age at last birth for multiparous women was imputed, TDLU measures showed the greatest declines approximately a decade following birth. Time since first live birth was not statistically significantly associated with TDLU measures among multiparous women (data not shown).
Influence of Other Factors on TDLU Counts, Span, and Acini Counts/TDLU
Other factors were variably associated with specific TDLU metrics (Tables 3 and 4; Supplementary Tables 2–4, available online). Among premenopausal women, compared with never smokers, former and current smokers had fewer TDLU counts (Table 3), shorter spans (Supplementary Table 2, available online), and fewer acini/TDLU (Supplementary Table 3, available online). Among postmenopausal women, compared with never smokers, former and current smokers had shorter spans (Supplementary Table 4, available online). A positive family history of breast cancer was associated with higher TDLU counts in both premenopausal (Table 3) and postmenopausal women (Table 4), and possibly TDLU span among premenopausal women with two or more affected relatives (based on 19 individuals) (Supplementary Table 2, available online). Among postmenopausal women, older ages at menarche showed an association with fewer TDLUs (Table 4). Compared with never users of menopausal hormone therapy, former users had fewer TDLUs (Table 4) and smaller TDLU spans (Supplementary Table 4, available online); current users did not have statistically significant differences in counts, but they had statistically significantly larger TDLU spans (Supplementary Table 4, available online). TDLUs were identified among 50.8% of oophorectomized women as compared with 60.7% of those with intact ovaries. In zero-inflated Poisson regression, women who had an oophorectomy were more likely to not have TDLUs, but among samples in which TDLUs were identified, oophorectomy was associated with greater TDLU counts (Table 4). Specimens with greater percentage of fat were associated with lower TDLU counts in both pre- (Table 3) and postmenopausal women (Table 4), and with fewer acini/TDLU among premenopausal women (Supplementary Table 3, available online).
Discussion
Using objective, reproducible measures of TDLU involution to evaluate normal tissues donated by 1938 volunteers, we show that age, menopausal status, and parity are critical determinants of TDLU involution, and suggest that other factors may produce additional effects. Our results in combination with data showing lack of TDLU involution is associated with increased breast cancer risk (8) argue for more intensive studies of normal breast tissues in order to advance our understanding of breast carcinogenesis, develop markers of risk, and identify intermediate endpoints for breast cancer.
Our data show that TDLU involution begins prior to menopause and deepens after the transition, as would be expected with aging and cessation of ovarian hormone production. In addition, we found that parous women have less TDLU involution than nulliparous women throughout life, possibly with the greatest effect within 10 years of delivery, consistent with earlier reports (8,16). The hyperplastic effects of pregnancy may underlie the dualistic influences of parity, which is suggested to increase breast cancer risk in the short term and reduce risk in the long term in some studies (23–25). More specifically, parity may increase risk for aggressive estrogen receptor (ER)–negative/basal-like breast cancers and decrease risk for ER-positive luminal A cancers, which predominate at older ages (26–32). In gravid rodents, hormones, particularly progesterone, are implicated in proliferation of breast epithelium and massive expansion of stem cells during pregnancy (33). Data also suggest that pregnancy may disproportionately reduce luminal as compared with basal stem cell populations (33–36). After weaning, breast epithelium undergoes apoptosis and the organ is remodeled, typically restoring the gland to a nonparous, although differentiated state (37–39). However, animal data suggest that postpartum involution may potentiate tumor aggressiveness (40–42), paralleling the poor prognosis of pregnancy associated breast cancers among women (40,43-44). In years following a birth, TDLU epithelium shows reduced expression of ER-α, progesterone receptor (PR), and human epidermal growth factor receptor-2 (HER2) and increased ER-β, which may partially mediate the observed long-term protective effect of parity (42). Although postpartum involution and age-related involution are mechanistically distinctive processes, the effects of these events on TDLU involution are difficult to separate (12,40).
Family history, current use of menopausal hormones and early age at menarche were variably (and perhaps less certainly) associated with less TDLU involution and increased breast cancer risk. Former menopausal hormone users demonstrated increased TDLU involution, consistent with the proposal that withdrawing estrogen induces apoptosis and lowers risk (45). Breastfeeding was associated with more TDLU involution among premenopausal women, but less involution in postmenopausal women, perhaps indicating greater influence on TDLU involution prior to menopause. Smoking was associated with increased TDLU involution, consistent with its role in shifting circulating estrogen profiles towards less potent metabolites (46–49). Our results for relationships of oophorectomy and TDLU involution are difficult to interpret: As expected, oophorectomy was associated with a lower percentage of identifiable TDLUs, but among samples containing TDLUs our data suggested that oophorectomy was associated with higher TDLU counts, which may reflect chance.
Strengths of this study include assessment of a large, demographically diverse group of tissue donors, use of standardized and optimized sample collection procedures, and TDLU characterization using quantitative reproducible metrics. Of the three metrics, TDLU span and acini/TDLU were strongly correlated, but weakly related to TDLU counts. These correlations may reflect sequential reduction in TDLU size followed by disappearance or a difference in effects of hormones or other factors on breast microanatomy (11). Lack of TDLUs may reflect complete involution, sometimes suggested by the presence of naked ducts, but in other instances, this may reflect nonrepresentative sampling. We adjusted TDLU data for percentage fat in tissue sections because this factor was inversely associated with TDLU counts, potentially reflecting undersampling of TDLUs or fatty replacement occurring with true involution. Greater degrees of TDLU involution have been associated with lower mammographic density, reflecting increased fat content (5,10). Our study and prior research show that small breast samples are generally representative of TDLU involution in the breast (16–17), and misclassification would likely bias associations to the null. Other possible limitations of our study include the limited size of the tissue samples, and the missing information on age at last birth for multiparous women, which is needed to calculate time since last birth. In addition, our findings are based on a population of self-selected volunteers enriched for family history of breast cancer, which may limit generalizability of findings.
In conclusion, we identified factors associated with TDLU involution, of which age, menopause and parity were prominent. Levels of TDLU involution were highly variable among women, suggesting that further research is needed to understand the factors that influence TDLU involution, and therefore, may influence breast cancer risk. In particular, our study revealed several factors with weak or suggestive associations with TDLU involution, which require confirmation to firmly establish the relationships. The observed association of parity with increased TDLU counts suggests that further research on lactation and postpartum remodeling may provide clues about the pathogenesis of certain subtypes of breast cancer and their prevention (40,50). Our analysis highlights the need for further consideration of age since last birth as a factor in risk assessment, since currently, time since last birth is not an established risk factor. Further, morphometric TDLU assessment over the life course, including analyses aimed at determining why some women involute more than others, may have value for understanding breast carcinogenesis. Studies of TDLU involution are needed to assess its potential as a progression marker for women with BBD, and as intermediate endpoints in prevention studies.
Funding
The KTB is supported by the Susan G. Komen, the Breast Cancer Research Foundation, Oracle Giving, and the Catherine Peachey Fund, Inc. This study was supported through funds from the National Cancer Institute, Intramural Research Program.
Author contributions: JDF contributed to conception and design of study, analysis, and drafted the manuscript. RMP contributed to design of statistical analysis, data presentation, and helped to draft the manuscript. LL and DAP contributed to acquisition of involution measures, data management, and helped to draft the manuscript. LAB and GLG contributed to conception of analysis and helped to draft the manuscript. XRY contributed to the analysis and helped to draft the manuscript. DAP performed statistical analyses. DV and CM contributed breast pathology expertise and served as independent reviewers of TDLU involution methods for the reproducibility analysis. WFA helped in statistical analysis and presentation of TDLU involution measures by age at tissue collection. SH contributed digital pathology imaging and data management/acquisition expertise for TDLU involution assessment. ZK assisted in data presentation and drafting of manuscript. SEC was a founder of the KTB, participated in tissues acquisition and developed all standard operating procedures for tissue and specimen procurement at the KTB. AMS is the principal investigator and conceived the idea of the KTB Study. MES contributed to conception and design of study, breast pathology expertise and conception of the TDLU involution measures, and helped draft the manuscript. All authors read and approved the final manuscript.
Notes
The funders did not play a role in the study design, data collection analysis, writing or submission of the manuscript.
The authors declare that they have no competing interests.
The authors thank Jill Henry and Connie Rufenbarger for their efforts in conception and maintaining the KTB, and the work of hundreds of volunteers and women who donated samples, who have made the KTB a reality. The authors also thank Michael Stagner from Information Management Services (IMS, Silver Spring, MD) for data management support for the study. JDF would also like to thank Robert Hoover and Shelia Zahm for editorial comments.
References
- 1. Russo J, Russo IH. Development of the human breast. Maturitas. 2004;49(1):2–15 [DOI] [PubMed] [Google Scholar]
- 2. Hutson SW, Cowen PN, Bird CC. Morphometric studies of age related changes in normal human breast and their significance for evolution of mammary cancer. J Clin Pathol. 1985;38(3):281–287 [DOI] [PMC free article] [PubMed] [Google Scholar]
- 3. Henson DE, Tarone RE. On the possible role of involution in the natural history of breast cancer. Cancer. 1993;71(6 Suppl):2154–2156 [DOI] [PubMed] [Google Scholar]
- 4. Baer HJ, Collins LC, Connolly JL, et al. Lobule type and subsequent breast cancer risk: results from the Nurses’ Health Studies. Cancer. 2009;115(7):1404–1411 [DOI] [PMC free article] [PubMed] [Google Scholar]
- 5. Ghosh K, Hartmann LC, Reynolds C, et al. Association between mammographic density and age-related lobular involution of the breast. J Clin Oncol. 2010;28(13):2207–2212 [DOI] [PMC free article] [PubMed] [Google Scholar]
- 6. Ghosh K, Vachon CM, Pankratz VS, et al. Independent association of lobular involution and mammographic breast density with breast cancer risk. J Natl Cancer Inst. 2010;102(22):1716–1723 [DOI] [PMC free article] [PubMed] [Google Scholar]
- 7. McKian KP, Reynolds CA, Visscher DW, et al. Novel breast tissue feature strongly associated with risk of breast cancer. J Clin Oncol. 2009;27(35):5893–5898 [DOI] [PMC free article] [PubMed] [Google Scholar]
- 8. Milanese TR, Hartmann LC, Sellers TA, et al. Age-related lobular involution and risk of breast cancer. J Natl Cancer Inst. 2006;98(22):1600–1607 [DOI] [PubMed] [Google Scholar]
- 9. Bartow SA, Pathak DR, Mettler FA, et al. Breast mammographic pattern: a concatenation of confounding and breast cancer risk factors. Am J Epidemiol. 1995;142(8):813–819 [DOI] [PubMed] [Google Scholar]
- 10. Ginsburg OM, Martin LJ, Boyd NF. Mammographic density, lobular involution, and risk of breast cancer. Br J Cancer. 2008;99(9):1369–1374 [DOI] [PMC free article] [PubMed] [Google Scholar]
- 11. Russo J, Russo IH. Toward a physiological approach to breast cancer prevention. Cancer Epidemiol Biomarkers Prev. 1994;3(4):353–364 [PubMed] [Google Scholar]
- 12. Radisky DC, Hartmann LC. Mammary involution and breast cancer risk: transgenic models and clinical studies. J Mammary Gland Biol Neoplasia. 2009;14(2):181–191 [DOI] [PMC free article] [PubMed] [Google Scholar]
- 13. Degnim AC, Visscher DW, Hoskin TL, et al. Histologic findings in normal breast tissues: comparison to reduction mammaplasty and benign breast disease tissues. Breast Cancer Res Treat. 2012;133(1):169–177 [DOI] [PMC free article] [PubMed] [Google Scholar]
- 14. Sherman ME, Figueroa JD, Henry JE, et al. The Susan G. Komen for the Cure Tissue Bank at the IU Simon Cancer Center: a unique resource for defining the “molecular histology” of the breast. Cancer Prev Res (Phila). 2012;5(4):528–535 [DOI] [PMC free article] [PubMed] [Google Scholar]
- 15. Pardo I, Lillemoe HA, Blosser RJ, et al. Next-generation transcriptome sequencing of the premenopausal breast epithelium using specimens from a normal human breast tissue bank. Breast Cancer Res. 2014;16(2):R26. [DOI] [PMC free article] [PubMed] [Google Scholar]
- 16. Yang XR, Figueroa JD, Falk RT, et al. Analysis of terminal duct lobular unit involution in luminal A and basal breast cancers. Breast Cancer Res. 2012;14(2):R64. [DOI] [PMC free article] [PubMed] [Google Scholar]
- 17. Vierkant RA, Hartmann LC, Pankratz VS, et al. Lobular involution: localized phenomenon or field effect? Breast Cancer Res Treat. 2009;117(1):193–196 [DOI] [PMC free article] [PubMed] [Google Scholar]
- 18. Yang XR, Figueroa JD, Falk RT, et al. Analysis of Terminal Duct Lobular Unit (TDLU) Involution in Luminal A and Basal Breast Cancers. Breast Cancer Res. 2012;14(2):R64. [DOI] [PMC free article] [PubMed] [Google Scholar]
- 19. Cleveland WS. Robust Locally Weighted Regression and Smoothing Scatterplots. J Am Stat Assoc. 1979;74(368):8 [Google Scholar]
- 20. Lambert D. Zero-Inflated Poisson Regression, with an Application to Defects in Manufacturing. Technometrics. 1992;34(1):14 [Google Scholar]
- 21. McKelvey RD, Zavoina W. A statistical model for the analysis of ordinal level dependent variables. J Math Sociol. 1975;4:103–120 [Google Scholar]
- 22. Killick R, Fearnhead P, Eckley IA. Optimal Detection of Changepoints With a Linear Computational Cost. J Am Stat Assoc. 2012;107:9 [Google Scholar]
- 23. Nechuta S, Paneth N, Velie EM. Pregnancy characteristics and maternal breast cancer risk: a review of the epidemiologic literature. Cancer Causes Control. 2010;21(7):967–989 [DOI] [PMC free article] [PubMed] [Google Scholar]
- 24. Costarelli V, Yiannakouris N. Breast cancer risk in women: the protective role of pregnancy. Nurs Stand. 2010;24(18):35–40 [DOI] [PubMed] [Google Scholar]
- 25. Lambe M, Hsieh C, Trichopoulos D, et al. Transient increase in the risk of breast cancer after giving birth. N Engl J Med. 1994;331(1):5–9 [DOI] [PubMed] [Google Scholar]
- 26. Li CI, Beaber EF, Tang MT, et al. Reproductive factors and risk of estrogen receptor positive, triple-negative, and HER2-neu overexpressing breast cancer among women 20–44 years of age. Breast Cancer Res Treat. 2013;137(2):579–587 [DOI] [PMC free article] [PubMed] [Google Scholar]
- 27. Millikan RC, Newman B, Tse CK, et al. Epidemiology of basal-like breast cancer. Breast Cancer Res Treat. 2008;109(1):123–139 [DOI] [PMC free article] [PubMed] [Google Scholar]
- 28. Work ME, John EM, Andrulis IL, et al. Reproductive risk factors and oestrogen/progesterone receptor-negative breast cancer in the Breast Cancer Family Registry. Br J Cancer. 2014;110(5):1367–1377 [DOI] [PMC free article] [PubMed] [Google Scholar]
- 29. Rosenberg LU, Einarsdottir K, Friman EI, et al. Risk factors for hormone receptor-defined breast cancer in postmenopausal women. Cancer Epidemiol Biomarkers Prev. 2006;15(12):2482–2488 [DOI] [PubMed] [Google Scholar]
- 30. Palmer JR, Boggs DA, Wise LA, et al. Parity and lactation in relation to estrogen receptor negative breast cancer in African American women. Cancer Epidemiol Biomarkers Prev. 2011;20(9):1883–1891 [DOI] [PMC free article] [PubMed] [Google Scholar]
- 31. Yang XR, Chang-Claude J, Goode EL, et al. Associations of breast cancer risk factors with tumor subtypes: a pooled analysis from the Breast Cancer Association Consortium studies. J Natl Cancer Inst. 2011;103(3):250–263 [DOI] [PMC free article] [PubMed] [Google Scholar]
- 32. Ma H, Bernstein L, Pike MC, et al. Reproductive factors and breast cancer risk according to joint estrogen and progesterone receptor status: a meta-analysis of epidemiological studies. Breast Cancer Res. 2006;8(4):R43. [DOI] [PMC free article] [PubMed] [Google Scholar]
- 33. Asselin-Labat ML, Vaillant F, Sheridan JM, et al. Control of mammary stem cell function by steroid hormone signalling. Nature. 2010;465(7299):798–802 [DOI] [PubMed] [Google Scholar]
- 34. Turashvili G, Bouchal J, Burkadze G, et al. Mammary gland development and cancer. Cesk Patol. 2005;41(3):94–101 [PubMed] [Google Scholar]
- 35. Villadsen R. In search of a stem cell hierarchy in the human breast and its relevance to breast cancer evolution. APMIS. 2005;113(11–12):903–921 [DOI] [PubMed] [Google Scholar]
- 36. Choudhury S, Almendro V, Merino VF, et al. Molecular profiling of human mammary gland links breast cancer risk to a p27(+) cell population with progenitor characteristics. Cell Stem Cell. 2013;13(1):117–130 [DOI] [PMC free article] [PubMed] [Google Scholar]
- 37. Clarkson RW, Wayland MT, Lee J, et al. Gene expression profiling of mammary gland development reveals putative roles for death receptors and immune mediators in post-lactational regression. Breast Cancer Res. 2004;6(2):R92–R109 [DOI] [PMC free article] [PubMed] [Google Scholar]
- 38. Strange R, Li F, Saurer S, et al. Apoptotic cell death and tissue remodelling during mouse mammary gland involution. Development. 1992;115(1):49–58 [DOI] [PubMed] [Google Scholar]
- 39. Russo J, Balogh GA, Heulings R, et al. Molecular basis of pregnancy-induced breast cancer protection. Eur J Cancer Prev. 2006;15(4):306–342 [DOI] [PubMed] [Google Scholar]
- 40. Lyons TR, Schedin PJ, Borges VF. Pregnancy and breast cancer: when they collide. J Mammary Gland Biol Neoplasia. 2009;14(2):87–98 [DOI] [PMC free article] [PubMed] [Google Scholar]
- 41. Stein T, Salomonis N, Nuyten DS, et al. A mouse mammary gland involution mRNA signature identifies biological pathways potentially associated with breast cancer metastasis. J Mammary Gland Biol Neoplasia. 2009;14(2):99–116 [DOI] [PubMed] [Google Scholar]
- 42. Asztalos S, Gann PH, Hayes MK, et al. Gene expression patterns in the human breast after pregnancy. Cancer Prev Res (Phila). 2010;3(3):301–311 [DOI] [PubMed] [Google Scholar]
- 43. Callihan EB, Gao D, Jindal S, et al. Postpartum diagnosis demonstrates a high risk for metastasis and merits an expanded definition of pregnancy-associated breast cancer. Breast Cancer Res Treat. 2013;138(2):549–559 [DOI] [PMC free article] [PubMed] [Google Scholar]
- 44. Lyons TR, O’Brien J, Borges VF, et al. Postpartum mammary gland involution drives progression of ductal carcinoma in situ through collagen and COX-2. Nat Med. 2011;17(9):1109–1115 [DOI] [PMC free article] [PubMed] [Google Scholar]
- 45. Beral V, Reeves G, Bull D, et al. Breast cancer risk in relation to the interval between menopause and starting hormone therapy. J Natl Cancer Inst. 2011;103(4):296–305 [DOI] [PMC free article] [PubMed] [Google Scholar]
- 46. Zhou B, Yang L, Sun Q, et al. Cigarette smoking and the risk of endometrial cancer: a meta-analysis. Am J Med. 2008;121(6):501–508 e3 [DOI] [PubMed] [Google Scholar]
- 47. Baron JA, La Vecchia C, Levi F. The antiestrogenic effect of cigarette smoking in women. Am J Obstet Gynecol. 1990;162(2):502–514 [DOI] [PubMed] [Google Scholar]
- 48. Kaufman DW, Slone D, Rosenberg L, et al. Cigarette smoking and age at natural menopause. Am J Public Health. 1980;70(4):420–422 [DOI] [PMC free article] [PubMed] [Google Scholar]
- 49. Gu F, Caporaso NE, Schairer C, et al. Urinary concentrations of estrogens and estrogen metabolites and smoking in caucasian women. Cancer Epidemiol Biomarkers Prev. 2013;22(1):58–68 [DOI] [PMC free article] [PubMed] [Google Scholar]
- 50. Stein T, Morris JS, Davies CR, et al. Involution of the mouse mammary gland is associated with an immune cascade and an acute-phase response, involving LBP, CD14 and STAT3. Breast Cancer Res. 2004;6(2):R75–R91 [DOI] [PMC free article] [PubMed] [Google Scholar]