

Background: H2S plays critical roles in the pathogenesis of chronic kidney diseases.
Results: H2S improved renal function and attenuated glomerular basement membrane thickening, mesangial matrix deposition, and renal interstitial fibrosis in diabetic rats.
Conclusion: H2S attenuates oxidative stress and inflammation, reduces mesangial cell proliferation, and inhibits the renin-angiotensin system in diabetic kidney.
Significance: H2S alleviates the development of diabetic nephropathy.
Keywords: Diabetes, Hydrogen Sulfide, Inflammation, Oxidative Stress, Renin-Angiotensin System, Diabetic Nephropathy, Mesangial Cell Proliferation
Abstract
Accumulating evidence has demonstrated that hydrogen sulfide (H2S) plays critical roles in the pathogenesis of chronic kidney diseases. This study was designed to investigate whether H2S has protective effects against diabetic nephropathy. Diabetic rats were induced by intraperitoneal injection of streptozotocin and administrated with H2S donor NaHS for 12 weeks. Rat glomerular mesangial cells were pretreated with NaHS or MAPK inhibitors (U0126, SP600125, and SB203580) prior to high glucose exposure, and cell proliferation was determined. Our findings suggest that H2S can improve renal function and attenuate glomerular basement membrane thickening, mesangial matrix deposition, and renal interstitial fibrosis in diabetic rats. H2S was found to reduce high glucose-induced oxidative stress by activating the Nrf2 antioxidant pathway and to exert anti-inflammatory effects by inhibiting NF-κB signaling. In addition, H2S reduced high glucose-induced mesangial cell proliferation by blockade of MAPK signaling pathways. Moreover, H2S was also found to inhibit the renin-angiotensin system in diabetic kidney. In conclusion, our study demonstrates that H2S alleviates the development of diabetic nephropathy by attenuating oxidative stress and inflammation, reducing mesangial cell proliferation, and inhibiting renin-angiotensin system activity.
Introduction
Diabetic nephropathy, defined as a progressive kidney disease caused by angiopathy of capillaries in the kidney glomeruli, is the leading cause of end-stage renal disease and is a major contributor to the morbidity and mortality of diabetic patients worldwide. Diabetic nephropathy is morphologically characterized by excessive accumulation of the extracellular matrix, with thickening of glomerular and tubular basement membranes and increased amounts of the mesangial matrix, ultimately progressing to glomerulosclerosis and tubulointerstitial fibrosis (1). Various hyperglycemia-induced metabolic and hemodynamic derangements, including increased generation of advanced glycation end products, enhanced production of reactive oxygen species (ROS),2 elevated levels of inflammatory cytokines, and activation of the renin-angiotensin system (RAS), are considered to be involved in the development and progression of diabetic nephropathy (2, 3).
Hydrogen sulfide (H2S), which is recognized as the third gasotransmitter, identified after nitric oxide and carbon monoxide, is endogenously generated by cystathionine γ-lyase (CSE), cystathionine β-synthase, and 3-mercaptopyruvate sulfurtransferase. In recent years, accumulating evidence has demonstrated that H2S plays critical roles in the pathophysiology of chronic kidney diseases. It has been reported that chronic kidney disease is associated with a significant reduction in plasma H2S concentration and expression of H2S-producing enzymes. Given the potent antioxidative, anti-inflammatory, and cytoprotective properties of H2S, its deficiency may contribute to progression of chronic kidney disease and the associated complications (4). H2S has also been found to exhibit antifibrotic effects in obstructed nephropathy and to inhibit the proliferation and differentiation of renal fibroblasts. The antifibrotic mechanisms of H2S may involve its anti-inflammation, as well as its blockade of TGF-β1 and MAPK signaling (5). In this study, we established a streptozotocin-induced diabetic rat model to investigate whether H2S has protective effects against diabetic nephropathy.
EXPERIMENTAL PROCEDURES
Animal Model and Grouping
All experiments and procedures were performed in accordance with the Guide for the Care and Use of Laboratory Animals and were approved by the Animal Ethics Committee of Soochow University. Male Sprague-Dawley rats weighing 200–250 g were obtained from the Experimental Animal Center of Soochow University and were housed in a room at 22 ± 2 °C with 50 ± 5% relative humidity with an alternating 12-h light/dark cycle. The diabetic rat model was induced with a single intraperitoneal injection of streptozotocin (65 mg/kg dissolved in 0.1 m citrate buffer). Blood glucose levels were measured 3 and 5 days after streptozotocin injection using a hand-held glucometer (Accu-Chek, Roche Applied Science) by tail vein puncture blood sampling. Only rats with blood glucose levels ≥16.7 mm on both days were defined as diabetic and used in this study. Diabetic rats were then randomly assigned to two groups. One group was intraperitoneally administered H2S donor sodium hydrosulfide (NaHS) at a dose of 14 μmol/kg/day for 12 weeks (diabetes mellitus (DM) + NaHS group). The other group was intraperitoneally injected with an equivalent volume of physiological saline for 12 weeks (DM group). In addition, two groups of sex- and age-matched normal rats were intraperitoneally injected with NaHS solution (NaHS group) or physiological saline (control group).
Cell Culture and Treatment
The rat glomerular mesangial cell line HBZY-1 was purchased from the China Center for Type Culture Collection (Wuhan, China) and cultured in Dulbecco's modified Eagle's medium (Invitrogen) supplemented with 10% fetal bovine serum and 1% penicillin/streptomycin in a humidified atmosphere containing 5% CO2 at 37 °C. To investigate the antiproliferative effect of H2S, mesangial cells were administered 100 μm NaHS for 30 min prior to exposure to 30 mm glucose for 48 h. To further determine whether H2S inhibits high glucose-induced mesangial cell proliferation by blockade of MAPK signaling, cells were preconditioned with 10 μm U0126 (ERK inhibitor), 10 μm SP600125 (JNK inhibitor), or 20 μm SB203580 (p38 inhibitor) for 60 min, followed by exposure to high glucose. MAPK inhibitors were purchased from Cell Signaling Technology (Beverly, MA).
Measurement of H2S Content
H2S levels were determined by the methylene blue method as described previously (5). The H2S concentration in plasma was expressed as micromoles/liter, whereas the H2S content in kidney was expressed in nanomoles/mg of protein.
Biochemical Analysis
Rat serum samples were used for the measurement of fasting blood glucose, blood urea nitrogen, and creatinine with an automatic biochemical analyzer (AU5400, Olympus, Tokyo, Japan). 24-h urine samples were collected using metabolic cages, and supernatants were used for examination of 24-h urinary protein.
Histological Analysis and Immunohistochemical Staining
Rat kidney samples were fixed in 10% buffered formalin, embedded in paraffin, and sliced into 5-μm-thick sections. Slides were then stained with hematoxylin/eosin and Masson's trichrome and observed under a light microscope. The expression of collagen types I and III in renal tissue was examined by immunohistochemistry. After quenching with endogenous peroxidase, achieving antigen retrieval, and blocking nonspecific binding sites, the renal tissue sections were incubated with rabbit anti-rat collagen I and III antibodies (Santa Cruz Biotechnology, Santa Cruz, CA) at 4 °C overnight and then subsequently incubated with horseradish peroxidase-conjugated goat anti-rabbit secondary antibodies (Invitrogen) at room temperature for 30 min. Finally, the sections were exposed to diaminobenzidine peroxidase substrate for 5 min and counterstained with Mayer's hematoxylin.
Transmission Electron Microscopy
Rat kidney tissue was cut into small pieces, fixed in 2.5% glutaraldehyde, post-fixed in 1% osmium tetroxide, dehydrated in an ascending series of alcohols, and embedded in epoxy resin. Ultrathin sections were cut and stained with uranyl acetate and lead citrate. Samples were observed and photographed under a Philips CM120 electron microscope (FEI, Eindhoven, The Netherlands).
Measurement of Oxidative Stress
Oxidative stress was evaluated by detecting malondialdehyde levels, superoxide dismutase and glutathione peroxidase activities, and ROS generation in renal tissue according to detection kit instructions (Jiancheng Biotech, Nanjing, China).
ELISA
The levels of angiotensin II (Ang II) and inflammatory markers (TNF-α, MCP-1 (monocyte chemotactic protein-1), ICAM-1 (intercellular adhesion molecule-1), and VCAM-1 (vascular cell adhesion molecule-1)) in renal tissue were measured using commercial ELISA kits (R&D Systems, Minneapolis, MN) according to the manufacturer's instructions.
EMSA
Nuclear protein extracts were prepared from kidney tissue using the NE-PER extraction kit (Thermo Scientific, Rockford, IL). Equal amounts of nuclear protein were incubated with biotin-labeled oligonucleotide probes containing the specific recognition sequence for NF-κB (5′-AGTTGAGGGGACTTTCCCAGGC-3′) for 30 min at room temperature. The reaction mixtures were separated on a nondenaturing polyacrylamide gel and then transferred onto a nylon membrane. The transferred DNA was cross-linked to the membrane, incubated with horseradish peroxidase-conjugated streptavidin, and visualized by enhanced chemiluminescence.
Cell Proliferation Assay
Mesangial cell proliferation was assessed by 3-(4,5-dimethylthiazol-2-yl)-2,5-diphenyltetrazolium bromide assay. Briefly, cells were seeded on a 96-well plate (5 × 10³ cells/well) and incubated with 20 μl of 5 mg/ml 3-(4,5-dimethylthiazol-2-yl)-2,5-diphenyltetrazolium bromide solution for 4 h. Subsequently, the cells were lysed with dimethyl sulfoxide (150 μl/well). When the formazan crystals were completely dissolved, the absorbance at 490 nm was measured using a microplate reader.
Western Blot Analysis
Rats were killed by carbon dioxide asphyxiation, and kidney tissues were removed and homogenized in ice-cold lysis buffer. Protein concentrations were quantified with the BCA protein assay kit (Thermo Scientific). Equal amounts of protein (80 μg) were loaded onto 10% SDS-polyacrylamide gels, transferred onto nitrocellulose membranes, and blocked with 5% nonfat milk. The membranes were incubated with primary antibodies at 4 °C overnight. The following primary antibodies were used: anti-CSE, anti-MMP-2 (matrix metalloproteinase-2), anti-TIMP-1 (tissue inhibitor of metalloproteinase-1), anti-TGF-β1, anti-Nrf2 (NF-E2-related factor-2), anti-HO-1 (heme oxygenase-1), anti-NQO1 (NAD(P)H:quinone oxidoreductase-1), anti-NF-κB p65, anti-angiotensin-converting enzyme, and anti-AT1R (Ang II type 1 receptor) (Santa Cruz Biotechnology) and anti-ERK1/2, anti-phospho-ERK1/2 (Thr202/Tyr204), anti-JNK, anti-phospho-JNK (Thr183/Tyr185), anti-p38, and anti-phospho-p38 (Thr180/Tyr182) (Cell Signaling Technology). The membranes were then incubated with horseradish peroxidase-conjugated secondary antibodies at room temperature for 1 h. The immunocomplexes were visualized with an enhanced chemiluminescence detection kit (Amersham Biosciences).
Statistical Analysis
All data in this study are expressed as mean ± S.D., and differences between groups were analyzed using analysis of variance with SPSS version 15.0 (SPSS, Chicago, IL). Post hoc analysis was used if the analysis of variance was significant. A p value of <0.05 was considered statistically significant.
RESULTS
As shown in Fig. 1, H2S levels in plasma and kidney tissue were reduced in the diabetic rats and elevated after treatment with NaHS. The protein expression of CSE was down-regulated in the DM group compared with that in the control group. Administration of NaHS was not associated with significant changes in CSE expression.
FIGURE 1.
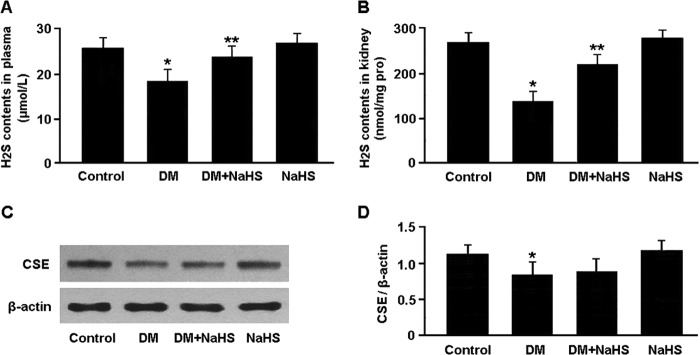
H2S content in plasma (A) and kidney tissue (B) was measured by the methylene blue method. Representative immunoblots (C) and densitometric analysis (D) of CSE are shown. *, p < 0.05 versus control; **, p < 0.05 versus DM (n = 5).
The biochemical test results are presented in Table 1. Serum levels of fasting blood glucose, blood urea nitrogen, and creatinine were elevated in the DM group compared with the control group, whereas serum levels of blood urea nitrogen and creatinine were reduced in the DM + NaHS group compared with the DM group. 24-h urinary protein was found to be increased in the DM group and decreased in the DM + NaHS group.
TABLE 1.
Biochemical analysis
Data are expressed as mean ± S.D. (n = 10).
| Control | DM | DM + NaHS | NaHS | |
|---|---|---|---|---|
| Fasting blood glucose (mmol/liter) | 6.24 ± 0.95 | 28.72 ± 4.36a | 26.50 ± 3.42 | 6.47 ± 0.89 |
| Blood urea nitrogen (mmol/liter) | 4.58 ± 0.73 | 10.95 ± 1.84a | 7.32 ± 1.27b | 4.92 ± 0.80 |
| Creatinine (μmol/liter) | 38.65 ± 4.18 | 80.23 ± 6.54a | 55.17 ± 5.62b | 35.49 ± 5.07 |
| 24-h urinary protein (mg) | 12.74 ± 1.83 | 78.62 ± 4.70a | 43.96 ± 3.85b | 14.08 ± 2.16 |
a p < 0.05 versus control.
b p < 0.05 versus DM.
The pathological changes in kidney tissue were observed by hematoxylin/eosin staining, Masson staining, and transmission electron microscopy (Fig. 2). The major pathological alterations in diabetic kidney included glomerular basement membrane thickening, mesangial matrix deposition, and renal interstitial fibrosis. Administration of NaHS alleviated renal pathological changes in diabetic rats, which could consequently attenuate the development of glomerular sclerosis.
FIGURE 2.

A, representative hematoxylin-eosin staining of kidney samples. Arrows indicate mesangial matrix deposition in diabetic kidney. B, representative Masson's trichrome staining of kidney sections. Arrows indicate collagen fibers stained blue in diabetic kidney. C, representative transmission electron micrographs of renal tissue. Arrows indicate glomerular basement membrane thickening in diabetic kidney. Administration of NaHS attenuated mesangial matrix deposition, renal interstitial fibrosis, and glomerular basement membrane thickening in diabetic rats (A–C).
The expression of collagen types I and III in renal tissue was determined by immunohistochemistry (Fig. 3). The expression of collagen types I and III was up-regulated in the DM group, whereas NaHS treatment was found to down-regulate collagen expression in the DM + NaHS group.
FIGURE 3.

A and B, representative immunohistochemical staining of collagen I (A) and collagen III (B) in renal tissue. Collagens are stained brown. C and D, quantitative analysis of the positive staining of collagen I (C) and collagen III (D). *, p < 0.05 versus control; **, p < 0.05 versus DM.
The expression of MMP-2, TIMP-1, and TGF-β1, which are involved in the regulation of collagen production and degradation, was determined by Western blotting (Fig. 4). The protein expression of TIMP-1 and TGF-β1 was up-regulated and that of MMP-2 was down-regulated in the DM group, whereas NaHS administration down-regulated TIMP-1 and TGF-β1 expression and up-regulated MMP-2 expression in the DM + NaHS group.
FIGURE 4.
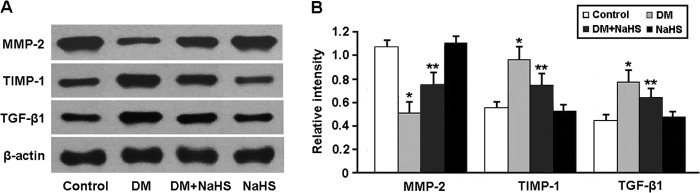
Representative immunoblots (A) and densitometric analysis (B) of MMP-2, TIMP-1, and TGF-β1. *, p < 0.05 versus control; **, p < 0.05 versus DM (n = 5).
Oxidative stress was evaluated by detecting malondialdehyde levels, superoxide dismutase and glutathione peroxidase activities, and ROS generation in renal tissue (Fig. 5). There were marked increases in ROS and malondialdehyde levels and decreases in superoxide dismutase and glutathione peroxidase activities in the DM group. Conversely, NaHS treatment was associated with decreased ROS and malondialdehyde levels and increased superoxide dismutase and glutathione peroxidase activities in the DM + NaHS group.
FIGURE 5.

Oxidative stress was evaluated by detecting malondialdehyde (MDA) levels (A), superoxide dismutase (SOD) and glutathione peroxidase (GSH-Px) activities (B and C), and ROS generation (D) in renal tissue. *, p < 0.05 versus control; **, p < 0.05 versus DM (n = 10).
The activity of Nrf2, a key regulator of the antioxidative stress response, was determined by Western blotting (Fig. 6). The nuclear expression of Nrf2 was significantly increased in diabetic kidney following administration of NaHS. Consequently, the protein levels of two downstream targets of Nrf2, HO-1 and NQO1, were elevated in the DM + NaHS group.
FIGURE 6.

Representative immunoblots and densitometric analysis of Nrf2 in the nucleus and cytosol (A) and its downstream targets HO-1 and NQO1 (B). *, p < 0.05 versus control; **, p < 0.05 versus DM (n = 5). TBP, TATA box-binding protein.
Inflammatory markers in renal tissue were measured by ELISA, and the results are shown in Fig. 7. The levels of TNF-α, ICAM-1, VCAM-1 and MCP-1 were significantly elevated in the DM group compared with the control group, whereas these cytokine levels were reduced in the DM + NaHS group compared with the DM group.
FIGURE 7.

Concentrations of TNF-α (A), MCP-1 (B), ICAM-1 (C), and VCAM-1 (D) in renal tissue measured by ELISA. *, p < 0.05 versus control; **, p < 0.05 versus DM (n = 10).
NF-κB activity in renal tissue was determined by EMSA and Western blotting (Fig. 8). The DNA-binding activity and nuclear expression of NF-κB were increased in the DM group, whereas NaHS treatment was found to inhibit NF-κB activity in the DM + NaHS group.
FIGURE 8.

A, detection of NF-κB DNA-binding activity by EMSA. B, representative immunoblots and densitometric analysis of NF-κB in the nucleus and cytosol. *, p < 0.05 versus control; **, p < 0.05 versus DM (n = 5). TBP, TATA box-binding protein.
As shown in Fig. 9, the protein levels of phospho-ERK1/2, phospho-JNK, and phospho-p38 MAPK were significantly elevated in the mesangial cells exposed to high glucose. However, pretreatment of the cells with 100 μm NaHS for 30 min inhibited MAPK phosphorylation and reduced high glucose-induced mesangial cell proliferation. Similarly, preconditioning of the cells with 10 μm U0126, 10 μm SP600125, or 20 μm SB203580 for 60 min prior to high glucose exposure also inhibited the mesangial cell proliferation.
FIGURE 9.

A–C, Western blot analysis of ERK1/2, JNK, and p38 MAPK phosphorylation in mesangial cells. D, pretreatment of the mesangial cells with NaHS or MAPK inhibitors reduced high glucose-induced cell proliferation. *, p < 0.05 versus cells exposed to normal glucose; **, p < 0.05 versus cells exposed to high glucose (n = 5). P, phospho; T, total.
To investigate the effect of H2S on RAS activity in diabetic kidney, Ang II levels were measured by ELISA, and angiotensin-converting enzyme and AT1R expression was determined by Western blotting (Fig. 10). Ang II levels were increased in the DM group and decreased in the DM + NaHS group. The protein expression of angiotensin-converting enzyme and AT1R was significantly up-regulated in the diabetic rats and down-regulated after treatment with NaHS.
FIGURE 10.
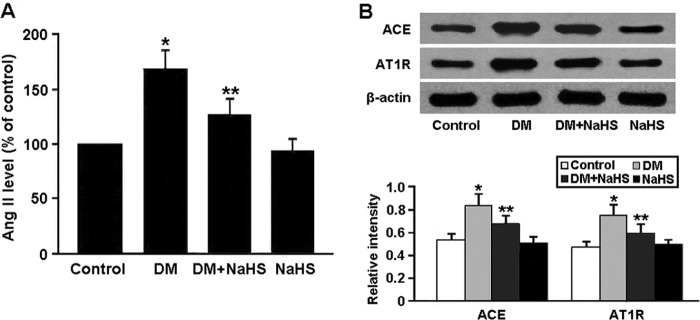
A, levels of Ang II in renal tissue measured by ELISA. B, representative immunoblots and densitometric analysis of angiotensin-converting enzyme (ACE) and AT1R. *, p < 0.05 versus control; **, p < 0.05 versus DM (n = 5).
DISCUSSION
In this study, we established a streptozotocin-induced diabetic rat model to investigate the protective effects of H2S against diabetic nephropathy. Our findings indicated that endogenous H2S generation and CSE protein expression were decreased in the diabetic rats, whereas exogenous administration of NaHS increased H2S content in both plasma and renal tissue. Biochemical and histopathological studies were carried out to evaluate the beneficial effects of H2S in the prevention of diabetic nephropathy, and the results reveal that H2S improved renal function and attenuated glomerular basement membrane thickening, mesangial matrix deposition, and renal interstitial fibrosis in diabetic rats.
There is growing evidence that oxidative stress and inflammation are both involved in the development and progression of diabetic nephropathy (6–9). A number of ROS-generating pathways such as glycolysis, specific defects in the polyol pathway, uncoupling of nitric oxide synthase, xanthine oxidase, NAD(P)H oxidase, and advanced glycation have been identified as potentially major contributors to the pathogenesis of diabetic nephropathy. In addition, mitochondrial production of ROS in response to chronic hyperglycemia may be the key initiator for each of these pathogenic pathways (10). Several components of the diabetic milieu, such as hyperglycemia, advanced glycation end products, and immunocomplexes, can activate kidney cells via induction of stress-activated protein kinase signaling, resulting in the release of chemokines and up-regulation of cell adhesion molecules. These events facilitate the kidney infiltration of monocytes and lymphocytes, which become activated in diabetic kidney and secrete proinflammatory cytokines. This leukocyte activity amplifies the inflammatory response and promotes cellular injury and the development of fibrosis (11). Our findings in this study suggest that in diabetic rat kidney, H2S attenuates oxidative stress and inflammation, which might be two important protective mechanisms against diabetic nephropathy.
Nrf2, an antioxidative defense system of the body, modulates the expression of antioxidant genes through interaction with the antioxidant stress element (12). Under normal physiological conditions, Nrf2 is confined to the cytoplasm associated with the suppressor protein Keap1 and is degraded by the ubiquitin-proteasome pathway. Oxidative and electrophilic stress factors stimulate dissociation of the Nrf2-Keap1 complex, thereby promoting the release and translocation of Nrf2 into the nucleus to up-regulate expression of Nrf2/antioxidant stress element-linked antioxidant genes (13). In this study, H2S was found to activate Nrf2 and up-regulate the protein expression of HO-1 and NQO1, which consequently enhanced resistance to oxidative stress in diabetic rat kidney.
The NF-κB family consists of pleiotropic transcription factors that integrate an intricate network of extracellular and intracellular signaling pathways. NF-κB activation has been documented to be associated with renal inflammation (14). In the classical pathway of NF-κB activation, phosphorylation of IκB by the activated IκB kinase complex leads to proteolysis of the NF-κB-bound IκB. Free NF-κB dimers then translocate to the nucleus, where they bind NF-κB DNA sites and activate gene transcription (15). In this study, the DNA-binding activity of NF-κB was increased in diabetic rat kidney, suggesting that NF-κB activation might be involved in the pathogenesis of diabetic nephropathy. Moreover, H2S was found to alleviate the inflammatory response in diabetic kidney via negative regulation of NF-κB signaling.
Mesangial cell proliferation and excessive deposition of extracellular matrix proteins are the major pathological features of diabetic nephropathy and contribute to the development of chronic renal failure (16). MAPK signaling pathways, which promote cell cycle progression by regulating the expression of cyclin-dependent kinases, are critically involved in the proliferation of mesangial cells (17). Our findings in this study indicated that ERK1/2, JNK, and p38 MAPK signaling was activated in mesangial cells exposed to high glucose, which might be an important molecular mechanism responsible for mesangial cell proliferation. Furthermore, H2S was found to reduce high glucose-induced mesangial cell proliferation by inhibiting phosphorylation of MAPKs.
It has been well documented that the RAS plays a central role in the pathogenesis of diabetic nephropathy (18, 19). Ang II is the main effector of the RAS and exerts a vasoconstrictive effect predominantly on the postglomerular arterioles, thereby increasing the glomerular hydraulic pressure and the ultrafiltration of plasma proteins, which may result in the onset and progression of chronic renal damage. Ang II may also directly contribute to accelerate renal damage by sustaining cell growth, inflammation, and fibrosis (20). In this study, RAS was found to be activated in the diabetic rats and inhibited after treatment with NaHS, suggesting that H2S attenuates the development of diabetic nephropathy through suppressing RAS activity.
In conclusion, we have demonstrated that H2S alleviates the development of diabetic nephropathy by attenuating oxidative stress and inflammation, reducing mesangial cell proliferation, and inhibiting RAS activity. H2S may reduce high glucose-induced oxidative stress by activating the Nrf2 pathway and exert anti-inflammatory effects by inhibiting NF-κB signaling. Moreover, H2S may reduce high glucose-induced mesangial cell proliferation by blockade of MAPK signaling pathways.
Footnotes
- ROS
- reactive oxygen species
- RAS
- renin-angiotensin system
- CSE
- cystathionine γ-lyase
- DM
- diabetes mellitus
- Ang II
- angiotensin II.
REFERENCES
- 1. Kanwar Y. S., Wada J., Sun L., Xie P., Wallner E. I., Chen S., Chugh S., Danesh F. R. (2008) Diabetic nephropathy: mechanisms of renal disease progression. Exp. Biol. Med. 233, 4–11 [DOI] [PubMed] [Google Scholar]
- 2. Sun Y. M., Su Y., Li J., Wang L. F. (2013) Recent advances in understanding the biochemical and molecular mechanism of diabetic nephropathy. Biochem. Biophys. Res. Commun. 433, 359–361 [DOI] [PubMed] [Google Scholar]
- 3. Kanwar Y. S., Sun L., Xie P., Liu F. Y., Chen S. (2011) A glimpse of various pathogenetic mechanisms of diabetic nephropathy. Annu. Rev. Pathol. 6, 395–423 [DOI] [PMC free article] [PubMed] [Google Scholar]
- 4. Aminzadeh M. A., Vaziri N. D. (2012) Downregulation of the renal and hepatic hydrogen sulfide (H2S)-producing enzymes and capacity in chronic kidney disease. Nephrol. Dial. Transplant. 27, 498–504 [DOI] [PubMed] [Google Scholar]
- 5. Song K., Wang F., Li Q., Shi Y. B., Zheng H. F., Peng H., Shen H. Y., Liu C. F., Hu L. F. (2014) Hydrogen sulfide inhibits the renal fibrosis of obstructive nephropathy. Kidney Int. 85, 1318–1329 [DOI] [PMC free article] [PubMed] [Google Scholar]
- 6. Kashihara N., Haruna Y., Kondeti V. K., Kanwar Y. S. (2010) Oxidative stress in diabetic nephropathy. Curr. Med. Chem. 17, 4256–4269 [DOI] [PMC free article] [PubMed] [Google Scholar]
- 7. Stanton R. C. (2011) Oxidative stress and diabetic kidney disease. Curr. Diab. Rep. 11, 330–336 [DOI] [PubMed] [Google Scholar]
- 8. Wada J., Makino H. (2013) Inflammation and the pathogenesis of diabetic nephropathy. Clin. Sci. 124, 139–152 [DOI] [PubMed] [Google Scholar]
- 9. Navarro-González J. F., Mora-Fernández C., Muros de Fuentes M., García-Pérez J. (2011) Inflammatory molecules and pathways in the pathogenesis of diabetic nephropathy. Nat. Rev. Nephrol. 7, 327–340 [DOI] [PubMed] [Google Scholar]
- 10. Forbes J. M., Coughlan M. T., Cooper M. E. (2008) Oxidative stress as a major culprit in kidney disease in diabetes. Diabetes 57, 1446–1454 [DOI] [PubMed] [Google Scholar]
- 11. Lim A. K., Tesch G. H. (2012) Inflammation in diabetic nephropathy. Mediators Inflamm. 2012, 146154. [DOI] [PMC free article] [PubMed] [Google Scholar]
- 12. Kaspar J. W., Niture S. K., Jaiswal A. K. (2009) Nrf2:INrf2 (Keap1) signaling in oxidative stress. Free Radic. Biol. Med. 47, 1304–1309 [DOI] [PMC free article] [PubMed] [Google Scholar]
- 13. Saito H. (2013) Toxico-pharmacological perspective of the Nrf2-Keap1 defense system against oxidative stress in kidney diseases. Biochem. Pharmacol. 85, 865–872 [DOI] [PubMed] [Google Scholar]
- 14. Sanz A. B., Sanchez-Niño M. D., Ramos A. M., Moreno J. A., Santamaria B., Ruiz-Ortega M., Egido J., Ortiz A. (2010) NF-κB in renal inflammation. J. Am. Soc. Nephrol. 21, 1254–1262 [DOI] [PubMed] [Google Scholar]
- 15. Napetschnig J., Wu H. (2013) Molecular basis of NF-κB signaling. Annu. Rev. Biophys. 42, 443–468 [DOI] [PMC free article] [PubMed] [Google Scholar]
- 16. Wolf G., Ziyadeh F. N. (1999) Molecular mechanisms of diabetic renal hypertrophy. Kidney Int. 56, 393–405 [DOI] [PubMed] [Google Scholar]
- 17. Kawano H., Kim S., Ohta K., Nakao T., Miyazaki H., Nakatani T., Iwao H. (2003) Differential contribution of three mitogen-activated protein kinases to PDGF-BB-induced mesangial cell proliferation and gene expression. J. Am. Soc. Nephrol. 14, 584–592 [DOI] [PubMed] [Google Scholar]
- 18. Gurley S. B., Coffman T. M. (2007) The renin-angiotensin system and diabetic nephropathy. Semin. Nephrol. 27, 144–152 [DOI] [PubMed] [Google Scholar]
- 19. Carey R. M., Siragy H. M. (2003) The intrarenal renin-angiotensin system and diabetic nephropathy. Trends Endocrinol. Metab. 14, 274–281 [DOI] [PubMed] [Google Scholar]
- 20. Remuzzi G., Perico N., Macia M., Ruggenenti P. (2005) The role of renin-angiotensin-aldosterone system in the progression of chronic kidney disease. Kidney Int. Suppl. 99, S57–S65 [DOI] [PubMed] [Google Scholar]