

Abstract
Caveolin 1 (CAV-1) functions not only as a constitutive scaffolding protein of caveolae but also as a vesicular transporter and signaling regulator. In the present study, we tested the hypothesis that CAV-1 knockout (CAV-1 KO) inhibits ANG II type 1 [AT1 (AT1a)] receptor-mediated uptake of ANG II in the proximal tubule and attenuates blood pressure responses in ANG II-induced hypertension. To determine the role of CAV-1 in mediating the uptake of FITC-labeled ANG II, wild-type (WT) mouse proximal convoluted tubule cells were transfected with CAV-1 small interfering (si)RNA for 48 h before AT1 receptor-mediated uptake of FITC-labeled ANG II was studied. CAV-1 siRNA knocked down CAV-1 expression by >90% (P < 0.01) and inhibited FITC-labeled ANG II uptake by >50% (P < 0.01). Moreover, CAV-1 siRNA attenuated ANG II-induced activation of MAPK ERK1/2 and Na+/H+ exchanger 3 expression, respectively (P < 0.01). To determine whether CAV-1 regulates ANG II uptake in the proximal tubule, Alexa 488-labeled ANG II was infused into anesthetized WT and CAV-1 KO mice for 60 min (20 ng/min iv). Imaging analysis revealed that Alexa 488-labeled ANG II uptake was decreased by >50% in CAV-1 KO mice (P < 0.01). Furthermore, Val5-ANG II was infused into WT and CAV-1 KO mice for 2 wk (1.5 mg·kg−1·day−1 ip). Basal systolic pressure was higher, whereas blood pressure and renal excretory and signaling responses to ANG II were attenuated, in CAV-1 KO mice (P < 0.01). We concluded that CAV-1 plays an important role in AT1 receptor-mediated uptake of ANG II in the proximal tubule and modulates blood pressure and renal responses to ANG II.
Keywords: angiotensin II, angiotensin II type 1a receptor, blood pressure, caveolin 1, kidney, proximal tubule, signal transduction
caveolae, the vital plasma membrane invaginations in most cell types, play important roles in intracellular vesicular transport, cancer development, G protein-coupled receptor signaling, and cholesterol homeostasis (5, 7, 34). Caveolae are formed from three major structural proteins: caveolin (CAV)-1, CAV-2, and CAV-3 (5, 34, 43). CAV-1 and CAV-2 appear to coexpress or heterooligomerize in most cell types of nonmuscular tissues, whereas the expression of CAV-3 is predominantly localized in muscles (34, 43). Among the three CAV proteins, CAV-1 has been extensively studied with respect to its biology, distribution, and functions in cardiovascular and pulmonary regulation and in cancer development. Global knockout (KO) of the CAV-1 gene is associated with the absence of caveolae in all tissues (5, 9, 34), abnormal nitric oxide (NO) and Ca2+ signaling, and cardiovascular disorders, including atherosclerosis, cardiac hypertrophy, and cardiomyopathy (6, 9, 43). Double CAV-1 and CAV-3 KO leads to the depletion of caveolae in both muscle and nonmuscle tissues and the development of cardiomyopathy (33). These studies have strongly implicated an important role of CAV-1 in cardiovascular physiology and disease.
The roles of CAV-1 in the regulation of blood pressure and renal function remain poorly understood. A number of studies (3, 12, 30, 38) have used CAV-1 small interfering (si)RNA knockdown or CAV-1 KO mice as a tool to determine the role of CAV-1 in the kidney. Basal blood pressure in CAV-1 KO mice has been reported to be similar to (36, 38, 42) or significantly higher (4, 36, 37) than in wild-type (WT) mice. In vitro knockdown of CAV-1 in Madin-Darby canine kidney cells does not alter apical membrane transport (30), whereas in vivo knockdown of CAV-1 expression in the renal cortex via the interstitial administration of CAV-1 siRNA reportedly decreases natriuretic and blood pressure responses in Na+-loaded rats (12). CAV-1 KO mice also appear to have impaired Ca2+ reabsorption and hypercalciuria (3). Thus, whether CAV-1 plays an important role in blood pressure and renal regulation is unclear.
Although CAV-1 is widely believed to be critical for plasma membrane invagination, intracellular vesicular trafficking, and G protein-coupled receptor-mediated endocytosis and signaling, little is known with respect to whether CAV-1 is involved in ANG II type 1 [AT1 (AT1a)] receptor-mediated uptake of ANG II in the proximal tubule of the kidney. Nor is it known whether CAV-1 is involved in blood pressure responses to ANG II in ANG II-induced hypertension. Using the CAV-1 silencing approach in cultured mouse proximal convoluted tubule (mPCT) cells and CAV-1 KO mice as an animal model, the present study tested the hypothesis that CAV-1 is involved in AT1a receptor-mediated uptake of extracellular ANG II in the proximal tubule of the kidney and that KO of CAV-1 attenuates blood pressure and renal excretory and signaling responses to ANG II during ANG II-induced hypertension. The results of the present study indicate that CAV-1 indeed plays an important role in the regulation of AT1a receptor-mediated uptake of ANG II in the proximal tubule, which may in part contribute to important renal mechanisms of ANG II-induced hypertension in mice.
METHODS
Materials and Antibodies
mPCT cells, a generous gift from Dr. Ulrich Hopfer (Case Western Reserve University), were derived from the S1 segment of the proximal tubule of male C57BL/6J mice (44). These mPCT cells harbor a thermolabile simian virus 40 large T antigen, display characteristic cobblestone-shaped monolayers with extensive brush borders, well-defined tight junction, and primary cilia (44), and express AT1a receptors (21, 26). DMEM, nutrient mixture, Ham's F-12 (DMEM-F-12), heat-inactivated FBS, trypsin, penicillin, and streptomycin were purchased from American Type Culture Collection, FITC-labeled ANG II was purchased from Invitrogen, and unlabeled ANG II was purchased from Bachem. Losartan, an AT1 receptor blocker, was obtained from Tocris Bioscience. The specific CAV-1 siRNA (sc-29241), a scrambled version of CAV-1 siRNA (sc-37007), and rabbit polyclonal CAV-1 antibody with epitope mapping at the NH2-terminus of CAV-1 of human origin (sc-894) were purchased from Santa Cruz Biotechnology. Goat polyclonal antibody targeting total Na+/H+ exchanger 3 (NHE3) and phospho-NHE3 were obtained from Millipore. Rabbit polyconal antibody targeting total MAPK ERK1/2 and mouse monoclonal antibody targeting phospho-ERK1/2 were purchased from Cell Signaling and Santa Cruz Biotechnology, respectively. The BCA protein assay kit was obtained from Thermo Fisher Scientific.
In Vitro Cultured Cell Experiments
In vitro knockdown of CAV-1 expression in mPCT cells.
Unless specified elsewhere, mPCT cells at passages 8–12 were cultured to 80% confluence in six-well plates or glass coverslips in complete DMEM-F-12 (95% O2-5% CO2, 50 nM hydrocortisone, 5% heat-inactivated FBS, 100 U/ml penicillin, and 100 μg/ml streptomycin), as we have previously described (20, 23, 25, 44). mPCT cells were transfected with selective 19- to 25-nucleotide CAV-1 siRNA (sc-29241, 4 μg/well) or a scrambled version of CAV-1 siRNA (sc-37007, 4 μg/well) for 48 h using Lipofectamine 2000 (17, 20, 23). The specificity and effectiveness of CAV-1 siRNA in knocking down CAV-1 expression were determined by measuring CAV-1 protein expression in mPCT cells by Western blot analysis using a rabbit polyclonal CAV-1 antibody with epitope mapping at the NH2-terminus of CAV-1 of human origin (sc-894, 1:200).
Role of CAV-1 in AT1 receptor-mediated uptake of FITC-labeled ANG II in mPCT cells.
To determine whether CAV-1 plays a role in AT1a receptor-mediated uptake of FITC-labeled ANG II in mPCT cells, we grew mPCT cells to 60–80% confluence on glass coverslips and pretreated them with or without the AT1 receptor blocker losartan (10 μM), CAV-1 siRNA, or scrambled siRNA for 48 h, as described above. Six groups of mPCT cells were incubated with either FITC-labeled ANG II or FITC alone as the negative control (1 nM, Molecular Probes) for 0, 5, 10, 15, 30, or 60 min, respectively, at 37°C without exposure to light. At each time point, mPCT cells were washed twice with PBS and counterstained with the nuclear acid marker 4′,6-diamidino-2-phenylindole (DAPI; 300 nM) for 5–10 min. Glass coverslips, mounted on a temperature-controlled perfusion chamber (37°C), were placed on the stage of a Nikon-Eclipse TE2000-U inverted fluorescence microscope for live cell fluorescent imaging. A dual DAPI-FITC band-pass excitation filter set (excitation: 488 nm and emission: 510/50 nm) was used for FITC-labeled ANG II and nuclear imaging. At least 10 green (FITC-labeled ANG II) and blue (DAPI) fluorescent images were captured sequentially at each time point, and the relative fluorescence levels of internalized (or intracellular) FITC-labeled ANG II in mPCT cells were analyzed using the MetaMorph Imaging System (18, 20, 21, 23).
Effects of siRNA knockdown of CAV-1 expression on ANG II-induced activation of MAPK ERK1/2 and NHE3 expression in mPCT cells.
To determine whether CAV-1 plays a role in the well-recognized ANG II-induced signaling responses in mPCT cells, WT mPCT cells were pretransfected with specific CAV-1 siRNA or scrambled siRNA (see above) for 48 h using Lipofentamine 2000. Cells were then stimulated with ANG II (10 nM) for 1 h in the presence or absence of losartan (10 μM) to block AT1 receptors. Western blot analyses were performed on mPCT protein samples to determine total and phosphorylated MAPK ERK1/2 and NHE3 protein expression, as previously described (20, 23, 25).
In Vivo Animal Experiments
Animals.
Twenty-five adult male age- and body weight-matched WT mice (B6129SF2/J) and thirty CAV-1 KO mice (Cav1tm1Mls/J) were purchased from Jackson Laboratories for the present study. Upon arrival, all mice were maintained on a normal Na+ diet and had free access to tap water. Animals were trained three times for 1 wk in a metabolic cage for 24-h urine collection and for blood pressure measurements via the tail-cuff method before experiments began. The use of animals in the present study was approved by the Institutional Animal Care and Use Committee of the University of Mississippi Medical Center.
Role of CAV-1 in ANG II-induced hypertension.
WT and CAV-1 KO mice were divided into three groups in the present study. First, basal systolic pressures and 24-h urinary water, Na+, and K+ excretion were determined in all groups of WT and CAV-1 KO mice using the computerized tail-cuff method (Visitech) and metabolic cages, as we have previously described (22, 24). WT and CAV-1 KO mice in the first group were untreated and served as controls. WT and CAV-1 KO mice in the second group were implanted with an osmotic minipump (model 2002, Alza) intraperitoneally for a 2-wk infusion of Val5-ANG II (1.5 mg·kg−1·day−1 ip), as previously described (22, 24). WT and CAV-1 KO mice in the third group were infused with Val5-ANG II as described for the second group but were concurrently treated with the AT1 receptor blocker losartan for 2 wk (20 mg·kg−1·day−1 po). The infusion rate of ANG II was determined from previous studies in which systolic blood pressure was increased to ≈160 mmHg, whereas losartan was able to completely block the effect of ANG II on blood pressure (22, 24). Systolic blood pressure, 24-h urine output, and urinary Na+ excretion were measured weekly after ANG II was administered with or without losartan (19, 26).
Role of CAV-1 in AT1 receptor-mediated uptake of ANG II in the proximal tubule of the kidney.
To determine whether CAV-1 is involved in AT1 receptor-mediated uptake of systemic ANG II by the proximal tubule of the kidney, eight WT mice and eight CAV-1 KO mice were used in the present study. Mice were anesthetized with pentobarbital (50 mg/kg ip), and a catheter (polyethylene-10) was inserted into the jugular vein for the intravenous infusion of saline for a 30-min equilibration period. This was followed by an infusion of Alexa 488-labeled ANG II (20 ng/min iv, Invitrogen) for 60 min to determine the proximal tubule uptake of Alexa 488-labeled ANG II in vivo. Our previous studies (22, 24, 48, 49) have shown that a steady-state plasma level of radiolabeled ANG II is reached by 10 min, whereas a steady-state renal level of radiolabeled ANG II can be obtained within 30 min. At the end of infusion, blood and urine samples were collected from the carotid and bladder catheter, respectively, for biochemical analyses.
To visualize the uptake of Alexa 488-labeled ANG II in the proximal tubule of the kidney, animals were perfused with acidic buffer solution (5 mM acetic acid and 150 mM NaCl, pH 2.5) at the end of experiment. The purpose was to dissociate Alexa 488-labeled ANG II bound to cell surface ANG II receptors and wash out blood and extracellular fluid Alexa 488-labeled ANG II (24, 48, 49). Kidneys were removed and frozen in isopentane on dry ice. Fresh and frozen sections (10 μm thick) were cut on a cryostat and thaw mounted on glass slides. Sections were then counterstained with the nuclear marker DAPI (300 nM) for 10 min to visualize the nuclei (19, 26). The uptake of Alexa 488-labeled ANG II in the renal superficial cortex was visualized using a Nikon-Eclipse TE2000-U inverted fluorescence microscope (19, 26). A dual DAPI-Alexa 488 band-pass excitation filter set (excitation: 488 nm and emission: 510/50 nm) was used for nuclear and Alexa 488-labeled ANG II imaging, respectively. DAPI-stained nuclear images were converted to red for better visualization (19, 21, 26). Autofluorescence levels in the cortex of the control mouse kidney not infused with FITC-labeled ANG II were used as background or negative controls for FITC-labeled ANG II.
Role of CAV-1 in FITC-labeled ANG II uptake responses in freshly isolated proximal tubules of WT and CAV-1 KO mice.
To further confirm the results obtained from CAV-1 knockdown in mPCT cells and CAV-1 KO mice, we isolated proximal tubules from the superficial cortex of an additional group of WT and CAV-1 KO mice (n = 5) using collagenase digestion and sequential filtrations (19, 22, 25). Freshly isolated proximal tubules were incubated with complete DMEM-F-12 growth medium containing 10 nM Alexa 488-labeled ANG II at 37°C for 60 min and washed twice with PBS. The uptake of Alexa 488-labeled ANG II by proximal tubules was imaged using a Nikon-Eclipse TE2000-U inverted fluorescence microscope and analyzed using the MetaMorph Imaging System (18, 20, 21, 23).
Statistical Analysis
All data are expressed as means ± SE. Levels of FITC-labeled ANG II or Alexa 488-labeled ANG II uptake in cultured mPCT cells or in the proximal tubule of the kidney were measured as arbitrary fluorescence units above background or autofluorescence levels. For in vitro experiments, 20 individual live cell fluorescent images from 6 samples and 3 experiments were analyzed. Cell surface receptor-bound FITC-labeled ANG II was excluded from analysis. Western blot analysis of signal protein responses was performed on four to six samples from three experiments. For in vivo experiments involving CAV-1 KO mice, 6–12 WT and CAV-1 KO mice were used to study blood pressure and renal responses to ANG II. One-way ANOVA was used to compare differences between control and experimental group, whereas Student's unpaired t-test was used to determine differences between WT and CAV-1-knockdown mPCT cells or CAV-1 KO mice. P values of <0.05 were considered to be significant for all comparisons.
RESULTS
In Vitro Evidence of CAV-1 Expression in Cultured mPCT Cells
Figure 1 shows CAV-1 expression and the effect of CAV-1 siRNA knockdown of CAV-1 expression in mPCT cells. Under basal conditions, CAV-1 protein was clearly expressed in mPCT cells as a 23-kDa protein. Three repeated experiments replicated the expression of CAV-1 in mPCT cells. To determine whether the protein detected is specific for CAV-1, specific CAV-1 siRNA was used to knockdown its expression. Transfection of mPCT cells with CAV-1 siRNA for 48 h decreased CAV-1 expression by 91 ± 3% (P < 0.01). Conversely, transfection of mPCT cells with scrambled siRNA failed to alter CAV-1 expression [not significant (NS)]. These results provide in vitro evidence for the expression of specific CAV-1 proteins in WT mPCT cells.
Fig. 1.
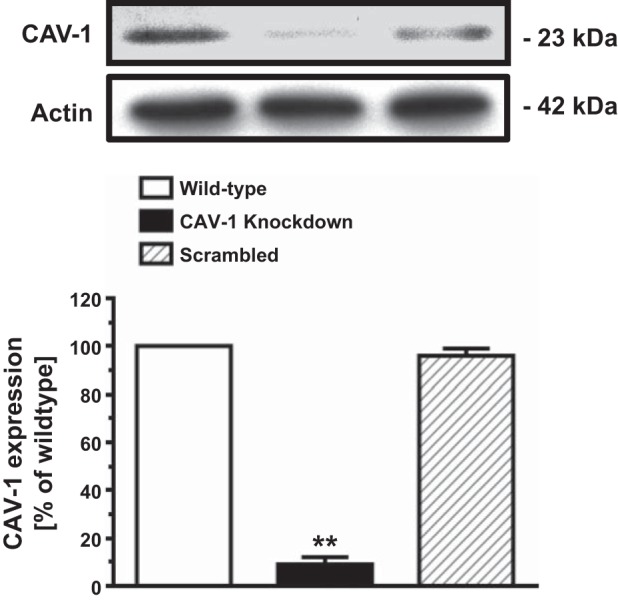
Expression of caveolin (CAV)-1 proteins and the effect of specific CAV-1 small interfering (si)RNA on CAV-1 expression in cultured mouse proximal convoluted tubule (mPCT) cells in vitro. The specificity of CAV-1 expression was verified using specific CAV-1 siRNA with ∼90% knockdown of CAV-1 expression in mPCT cells. **P < 0.01 vs. wild-type.
Role of CAV-1 in AT1a Receptor-Mediated Uptake of FITC-Labeled ANG II in mPCT Cells
AT1a receptor-mediated uptake of FITC-labeled ANG II in mPCT cells was studied at 37°C, which is the optimal temperature promoting AT1 (AT1a) receptor-mediated uptake of ANG II in cultured mPCT cells. Incubation of mPCT cells with FITC-labeled ANG II for 30 min resulted in robust uptake responses of FITC-labeled ANG II (Fig. 2, A and C). As we have previously reported (18, 20, 27), internalized FITC-labeled ANG II was observed in the cytoplasm and perinuclear locations. Knockdown of CAV-1 expression with CAV-1 siRNA significantly decreased the uptake response of FITC-labeled ANG II by 48 ± 6% in mPCT cells (P < 0.01; Fig. 2, D and F). In contrast, scrambled siRNA had no significant effect on FITC-labeled ANG II uptake (Fig. 2, G and I). The remaining FITC-labeled ANG II uptake response was largely blocked by supplemental losartan treatment (Fig. 2, J and L) compared with the effect of CAV-1 siRNA (Fig. 2, D and F). The semiquantitated results are shown in Fig. 2M.
Fig. 2.

In vitro uptake of FITC-labeled ANG II in wild-type (WT) mPCT cells and the effects of CAV-1 siRNA and losartan (Los). mPCT cells were grown on glass coverslips and incubated with FITC-labeled ANG II (10 nM) at 37°C for 30–60 min. A, D, G, and J: FITC-labeled ANG II (green). B, E, H, and K: 4′,6-diamidino-2-phenylindole (DAPI)-stained images (red). C, F, I and L: merged images. M: semiquantitative ANG II uptake by mPCT cells in arbitrary fluorescence units (AFU) with control at 100. Internalized FITC-labeled ANG II was seen in the cytoplasm and perinucler regions of the cells. The FITC-labeled ANG II uptake response was attenuated by CAV-1 siRNA but not by a scrambled version of siRNA. **P < 0.01 vs. control mPCT cells. Magnification: ×100.
Role of CAV-1 in ANG II-Induced Activation of MAPK ERK1/2 in mPCT Cells
As up to 50% of AT1a receptor-mediated ANG II uptake may be associated with CAV-1 in mPCT cells (Fig. 2), experiments were performed to determine whether CAV-1 plays any role in the well-recognized ANG II-induced activation of MAPK ERK1/2 signaling in mPCT cells. As expected, ANG II (10 nM) significantly increased phosphorylated MAPK ERK1/2 proteins by twofold (phospho-ERK1/2-to-total ERK1/2 ratio: 0.41 ± 0.03 in control vs. 0.86 ± 0.06 with ANG II, P < 0.01; Fig. 3). Knockdown of CAV-1 expression alone did not significantly alter MAPK ERK1/2 responses in the absence of ANG II (phospho-ERK1/2-to- total ERK1/2: 0.40 ± 0.05, NS vs. control). However, CAV-1 siRNA largely blocked ANG II-induced phosphorylated MAPK ERK1/2 responses in mPCT cells (phospho-ERK1/2-to-t-ERK1/2 ratio: 0.48 ± 0.03, P < 0.01 vs. ANG II; Fig. 3). In parallel experiments in which mPCT cells were pretreated with scrambled siRNA for 48 h before stimulation with ANG II, control siRNA had no effect on ANG II-induced MAPK ERK1/2 responses.
Fig. 3.
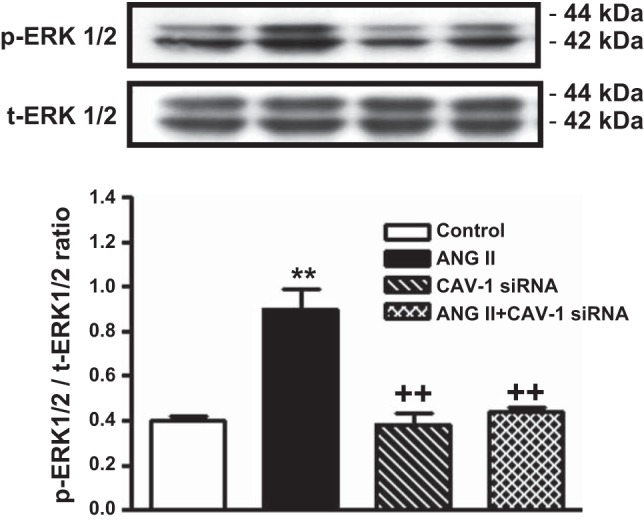
Effects of ANG II and CAV-1 siRNAs alone or in combination on ANG II-induced activation of MAPK ERK1/2 in WT mPCT cells. mPCT cells pretransfected with or without CAV-1 siRNA were incubated with ANG II (10 nM) at 37°C for 1 h before proteins were extracted for Western blots of total (t-) and phosphorylated (p-) MAPK ERK1/2. **P < 0.01 vs. control mPCT cells not transfected with CAV-1 siRNAs; ++P < 0.01 vs. ANG II-treated mPCT cells.
Role of CAV-1 in ANG II-Induced Phosphorylation of NHE3 in mPCT Cells
Phosphorylation of NHE3 proteins is associated with activation of MAPK ERK1/2 signaling and a subsequent change in NHE3 activity in proximal tubule cells in response to ANG II. In mPCT cells, ANG II increased phospho-NHE3 proteins by 41.7 ± 3% (phospho-NHE3-to-NHE3 ratio: 0.36 ± 0.02 in control vs. 0.51 ± 0.05 with ANG II, P < 0.01; Fig. 4). Pretreatment of mPCT cells with CAV-1 siRNA alone had no effect on the phospho-NHE3-to-NHE3 ratio (0.38 ± 0.03; NS). However, pretreatment of mPCT cells with CAV-1 siRNA to knock down CAV-1 expression largely blocked ANG II-induced increases in phospho-NHE3 proteins (phospho-NHE3-to-NHE3 ratio: 0.35 ± 0.03 with ANG II + CAV-1 siRNA, P < 0.01 vs. ANG II; Fig. 4).
Fig. 4.
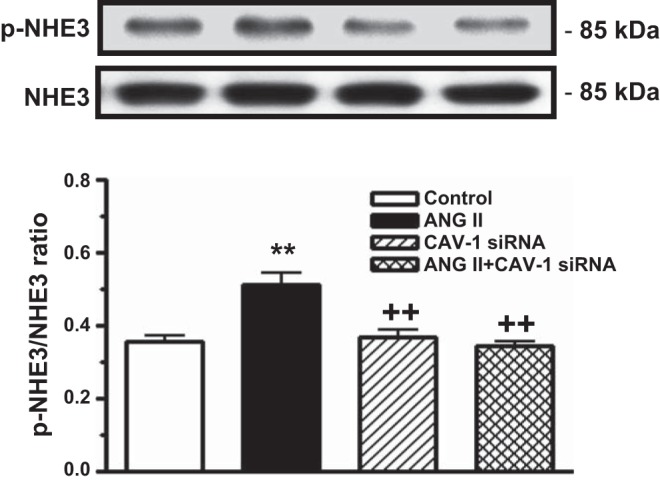
Effects of ANG II and CAV-1 siRNA alone or in combination on ANG II-induced phosphorylation of Na+/H+ exchanger 3 (NHE3) in mPCT cells. mPCT cells pretransfected with or without CAV-1 siRNA were incubated with ANG II (10 nM) at 37°C for 1 h before proteins were extracted for Western blots of total and phosphorylated NHE3 proteins. **P < 0.01 vs. control mPCT cells not transfected with CAV-1 siRNAs; ++P < 0.01 vs. ANG II-treated mPCT cells.
In Vivo Evidence of CAV-1 Expression and KO in Proximal Tubules of WT and CAV-1 KO Mice
Whether CAV-1 is expressed in the proximal tubule of the kidney remains highly controversial (2, 11, 28, 46, 47). Although the primary objective of the present study was not to determine and localize CAV-1 expression in the mouse kidney, proximal tubules from the superficial cortex were freshly isolated from WT and CAV-1 KO mice for Western blot analysis of CAV-1 proteins. Figure 5 shows CAV-1 protein expression in the proximal tubule of three representative WT mice and three representative CAV-1 KO mice. CAV-1 expression was almost completely absent in the proximal tubule of CAV-1 KO mice (CAV-1-to-actin ratio: 0.73 ± 0.06 in WT mice vs. 0.05 ± 0.03 in CAV-1 KO mice, P < 0.01). Thus, CAV-1 KO mice are an ideal model to study the role of CAV-1 in the regulation of AT1a receptor-mediated uptake of FITC-labeled ANG II and blood pressure and kidney responses to ANG II in vivo.
Fig. 5.
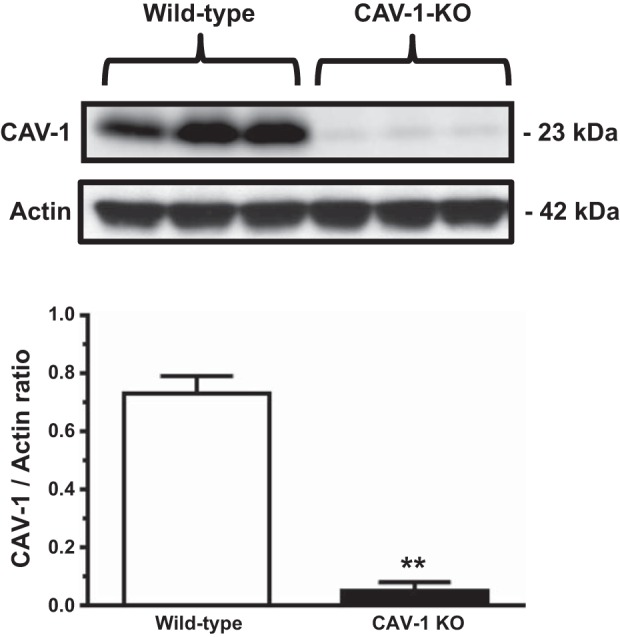
Western blot showing CAV-1 protein expression in freshly isolated proximal tubules (PTs) of WT but not CAV-1 knockout (KO) mice. CAV-1 proteins were largely absent in the PT of CAV-1 KO mice. **P < 0.01 vs. wild-type.
Role of CAV-1 in AT1a Receptor-Mediated Uptake of Alexa Fluor 488 ANG II Conjugate in Proximal Tubules of WT and CAV-1 KO Mice
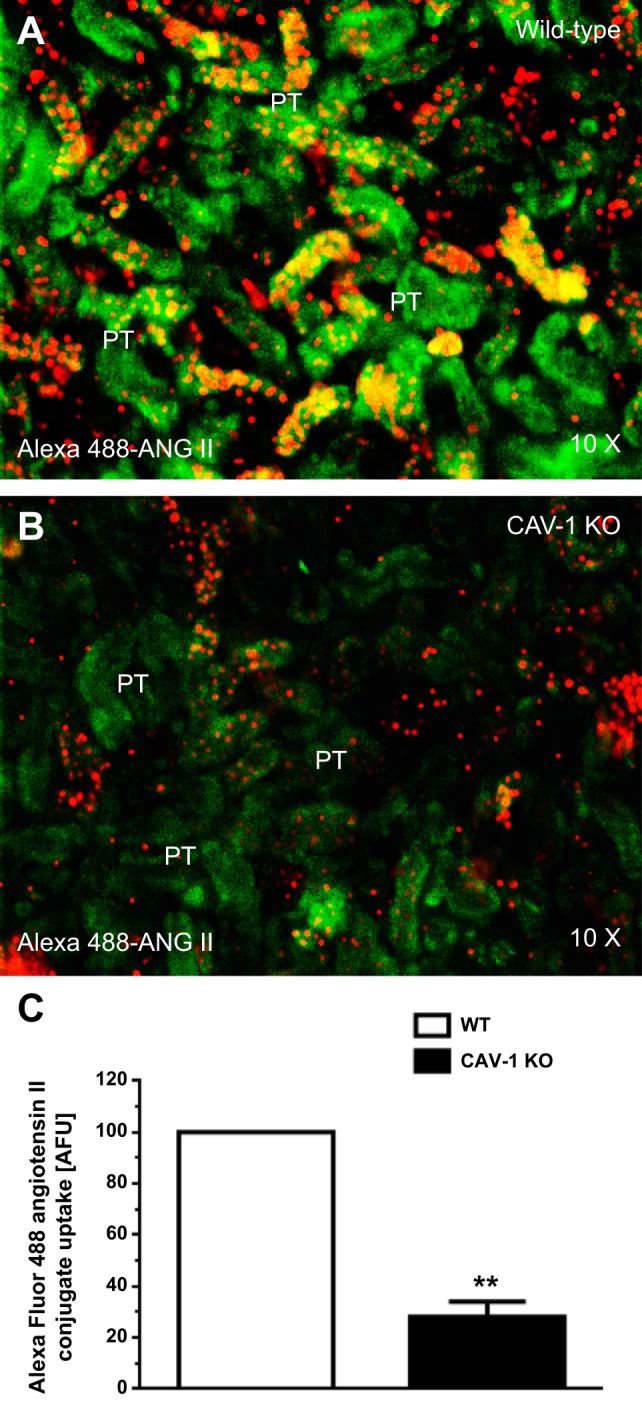
Figure 6 shows the uptake responses of Alexa fluor 488 ANG II conjugate in the proximal tubule of anesthetized WT and CAV-1 KO mice after systemic infusion of Alexa fluor 488 ANG II conjugate for 60 min. Alexa fluor 488 ANG II conjugate is a green fluorescent dye conjugate with identical spectral properties and quantum yield as FITC but is a brighter and more photostable conjugate for in vivo fluorescent imaging. In WT mice (n = 7), high levels of Alexa 488-labeled ANG II were taken up primarily in the proximal tubule (Fig. 6, A and C). In contrast, levels of uptake were very low in the glomeruli in the cortex. In the proximal tubule of CAV-1 KO mice (n = 6), levels of Alexa 488-labeled ANG II uptake were decreased by ∼70% (CAV-1 KO mice: 28.8 ± 5.6 abitrary fluorescence units vs. WT mice: 100 arbitrary fluorescence units, P < 0.01; Fig. 6, D, F, and G). In further experiments in freshly isolated proximal tubules incubated with Alexa fluor 488 ANG II conjugate (10 nM) for 60 min at 37°C, the uptake response was also significantly reduced to a similar extent in the proximal tubule of CAV-1 KO mice (Fig. 7, B and C) compared with WT mice (P < 0.01; Fig. 7A).
Fig. 6.

Effects of CAV-1 on the in vivo uptake of Alexa fluor 488 ANG II conjugate in PTs of WT and CAV-1 KO mice. A–C: PT uptake of Alexa fluor 488 ANG II conjugate in a representative WT mouse. D–F: PT uptake of Alexa fluor 488 ANG II conjugate in a representative CAV-1 KO mouse. G: semiquantitative data on the uptake of Alexa fluor 488 ANG II conjugate in PTs of WT and CAV-1 KO mice, respectively, expressed as AFU with WT mice at 100. Little uptake occurred in the glumeruli (G) in the cortex. Red shows DAPI-stained nuclei in the renal cortex. **P < 0.01 vs. WT mice. Magnification: ×10.
Fig. 7.
Effects of CAV-1 on the in vitro uptake of Alexa fluor 488 ANG II conjugate in freshly isolated PTs of WT and CAV-1 KO mice. Green shows the uptake of Alexa fluor 488 ANG II conjugate, whereas red shows the nuclei. **P < 0.01 vs. WT mice.
Basal Blood Pressure and Renal Excretory Response Phenotypes in WT and CAV-1 KO Mice
Basal blood pressure and renal water and electrolyte excretory phenotypes of WT and CAV-1 KO mice are shown in Table 1. Under control conditions, there were no significant differences in body weight, heart weight, or kidney weight, but the heart weight-to-body weight ratio and kidney weight-to-body weight ratio were increased significantly. Basal systolic blood pressure was slightly but significantly higher in age- and body weight-matched male CAV-1 KO mice compared with WT mice (P < 0.05; Table 1). There were no significant differences in basal 24-h urinary water and Na+ excretion between WT and CAV-1 KO mice, but basal 24-h urinary K+ excretion was significantly lower in CAV-1 KO mice (P < 0.05).
Table 1.
Basal SBP and renal functional phenotypes in WT and CAV-1 KO mice
| Parameters | WT Mice | CAV-1 KO Mice |
|---|---|---|
| Number of mice/group | 11 | 12 |
| Body weight, g | 25.4 ± 0.6 | 23.8 ± 0.3 |
| Heart weight-to-body weight ratio, ×100 | 0.52 ± 0.02 | 0.59 ± 0.03* |
| Kidney weight-to-body weight ratio, ×100 | 1.18 ± 0.02 | 1.44 ± 0.06† |
| Drinking, ml/24 h | 3.42 ± 0.07 | 3.32 ± 0.70 |
| SBP, mmHg | 114 ± 2 | 122 ± 3* |
| Urine excretion, ml/24 h | 1.19 ± 0.05 | 1.30 ± 0.17 |
| Urinary Na+ excretion, μmol/24 h | 203.8 ± 5.2 | 210.2 ± 10.2 |
| Urinary K+ excretion, μmol/24 h | 408.7 ± 9.9 | 293.8 ± 16.4* |
Values are means ± SE. WT, wild type; CAV-1, caveolin-1; KO, knockout; SBP, systolic blood pressure.
P < 0.05 and
P < 0.01 vs. WT mice.
Role of CAV-1 in Chronic Blood Pressure Responses to ANG II in WT and CAV-1 KO Mice
Table 2 shows systolic blood pressure and renal excretory responses to a pressor dose of ANG II infusion for 2 wk (1.5 mg·kg−1·day−1 iv) or concurrent administration of ANG II and the AT1 receptor blocker losartan (20 mg·kg−1·day−1 po) in WT and CAV-1 KO mice. In response to 2-wk ANG II infusion, systolic blood pressure increased to 167 ± 4 mmHg in WT mice (change of 54 ± 6 mmHg, P < 0.01 vs. control; Fig. 8). In comparison, systolic blood pressure increased to 153 ± 3 mmHg in CAV-1 KO mice (change of 31 ± 3 mmHg, P < 0.01 vs. control). The difference in blood pressure responses to ANG II was significant between WT and CAV-1 KO mice (P < 0.01). Concurrent administration of losartan with ANG II significantly reduced blood pressure to similar extents in both WT mice (change of 46 ± 4 mmHg, P < 0.01 vs. ANG II) and CAV-1 KO mice (change of 44 ± 3 mmHg, P < 0.01 vs. ANG II; Fig. 8).
Table 2.
SBP and renal excretory responses to 2-wk ANG II infusion (1.5 mg·kg−1·day−1 iv) or concurrent administration of ANG II and the ANG II type 1 receptor blocker losartan in WT and CAV-1 KO mice
| WT Mice |
CAV-1 KO Mice |
|||||
|---|---|---|---|---|---|---|
| Responses | Control | ANG II | ANG II + losartan | Control | ANG II | ANG II + losartan |
| Number of mice/group | 10 | 11 | 10 | 11 | 11 | 7 |
| SBP, mmHg | 113 ± 2 | 167 ± 4b | 121 ± 4d | 122 ± 3e | 153 ± 3be | 112 ± 4c |
| Kidney-to-body weight ratio, ×100 | 0.59 ± 0.02 | 0.68 ± 0.05b | 0.63 ± 0.0 | 0.72 ± 0.06 | 0.71 ± 0.02 | 0.61 ± 0.02 |
| Drinking, ml/24 h | 3.5 ± 0.2 | 5.6 ± 0.9b | 3.5 ± 0.2d | 3.3 ± 0.7 | 3.1 ± 0.5f | 5.8 ± 0.3ade |
| Urine, ml/24 h | 1.2 ± 0.1 | 2.9 ± 0.2b | 1.2 ± 0.1d | 1.3 ± 0.2 | 1.3 ± 0.2f | 1.1 ± 0.2 |
| Urinary Na+ excretion, μmol/24 h | 203.8 ± 5.2 | 260.5 ± 9.8 | 213.7.2 ± 12.3 | 210.2 ± 10.2 | 170.5 ± 3.6be | 257.0 ± 15.9c |
| Urinary K+ excretion, μmol/24 h | 408.7 ± 9.8 | 335.0 ± 12.6 | 416.9.3 ± 15.2 | 293.8 ± 16.4 | 226.6 ± 4.3e | 354.3 ± 16.9 |
Values are means ± SE.
P < 0.05 and
P < 0.01 vs. control;
P < 0.05 and
P < 0.01 vs. ANG II;
P < 0.05 and
P < 0.01 vs. WT mice that received the same treatment.
Fig. 8.
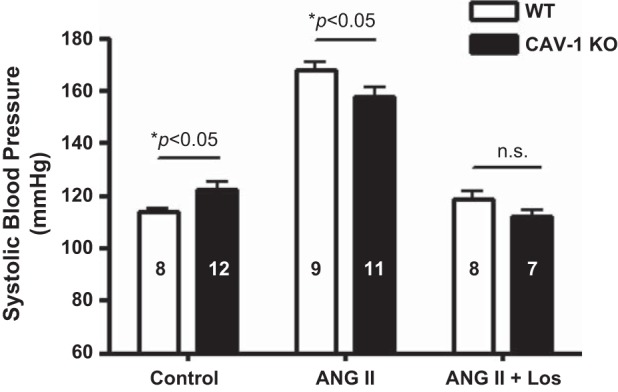
Systolic blood pressure (SBP) responses to control, 2-wk ANG II infusion, and concurrent Los treatment in WT and CAV-1 KO mice. At the same ANG II infusion rate, SBP was increased by a change of 54 ± 6 mmHg in WT mice compared with a change of 31 ± 3 mmHg in CAV-1 KO mice (P < 0.01). n.s., Not significant.
Role of CAV-1 in Chronic 24-h Renal Excretory Responses to ANG II in WT and CAV-1 KO Mice
In WT mice, the ANG II-induced increase in systolic blood pressure was associated with significant pressure-induced diuretic (control: 1.2 ± 0.1 ml/24 h vs. ANG II: 2.9 ± 0.2 ml/24 h, P < 0.01; Fig. 9) and natriuretic (control: 203.8 ± 5.2 μmol/24 h vs. ANG II: 260.5 ± 9.8 μmol/24 h, P < 0.01) responeses (Fig. 10). ANG II also significantly increased water drinking in WT mice (control: 3.5 ± 0.2 ml/24 h vs. ANG II: 5.6 ± 0.9 ml/24 h, P < 0.01). These responses to ANG II were largely blocked by concurrent administration of losartan. In CAV-1 KO mice, ANG II had no significant effects on 24-h drinking (control: 3.3 ± 0.7 ml/24 h vs. ANG II: 3.1 ± 0.5 ml/24 h, NS), 24-h urine excretion (Fig. 9), or 24-h urinary Na+ excretion in response to ANG II infusion (Fig. 10); 24-h urinary K+ excretion was also slightly decreased (control: 293.8 ± 5.2 μmol/24 h vs. ANG II: 226.6 ± 4.3 μmol/24 h, P < 0.05). Interestingly, losartan treatment reversed the urinary Na+ response to ANG II in CAV-1 KO mice (Fig. 10).
Fig. 9.
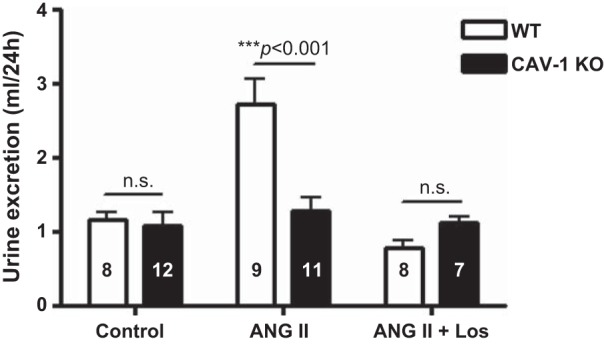
Twenty-four-hour urine excretory responses to control, 2-wk ANG II infusion, and concurrent Los treatment in WT and CAV-1 KO mice. At the same ANG II infusion rate, a pressure-induced diuretic response was observed in WT mice, which was attenuated in CAV-1 KO mice. Los, however, induced similar responses in WT and CAV-1 KO mice.
Fig. 10.
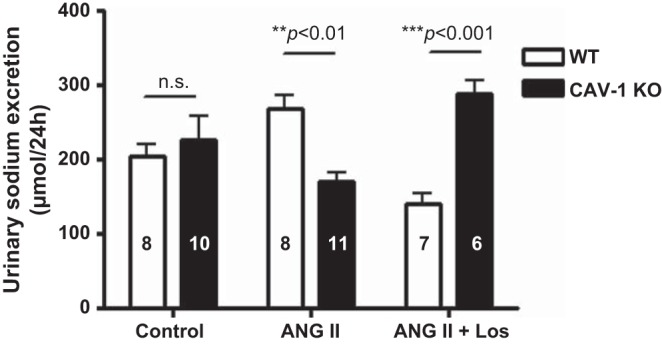
Twenty-four-hour urinary Na+ excretory responses to control, 2-wk ANG II infusion, and concurrent Los treatment in WT and CAV-1 KO mice. At the same ANG II infusion rate, a pressure-induced natriuretic response was observed in WT mice, which was attenuated in CAV-1 KO mice. Los, however, induced more robust natriuretic responses in CAV-1 KO mice.
Role of CAV-1 in Phosphoproteomic Signaling Responses to ANG II in Proximal Tubules of WT and CAV-1 KO mice
In the present study, we chose to determine the responses of three major signaling proteins in the proximal tubule of the kidney to ANG II administration, i.e., phospho-PKC-α (Ser657; Fig. 11), phospho-ERK1/2 (Fig. 12), and phospho-NHE3 (Fig. 13). In WT mice, ANG II significantly increased phospho-PKC-α (Ser657) protein levels as a ratio to actin by more than twofold (basal: 0.12 ± 0.03 vs. ANG II: 0.32 ± 0.06, P < 0.01), and the response was blocked by losartan (ANG II + losartan: 0.10 ± 0.03, P < 0.01 vs. ANG II; Fig. 11). In CAV-1 KO mice, the basal phospho-PKC-α (Ser657) protein level was similar to that of WT mice (CAV-1 KO mice: 0.08 ± 0.03, NS). However, the response to ANG II stimulation was significantly smaller than that of WT mice (CAV-1 KO mice: 0.20 ± 0.05, P < 0.05 vs. WT mice). Unlike in WT mice, losartan failed to block the effect of ANG II on phospho-PKC-α (Ser657) signaling responses in CAV-1 KO mice (Fig. 11).
Fig. 11.

Effect of CAV-1 KO and Los (L) on ANG II-induced activation of PKC-α in PTs of WT and CAV-1 KO mice. Note that p-PKC-α (Ser657) was increased in the PT by ANG II in WT mice but not in CAV-1 KO mice. **P < 0.01 vs. control (C); ++P < 0.01 vs. ANG II.
Fig. 12.

Effect of CAV-1 KO and Los on ANG II-induced activation of MAPK ERK1/2 (p-ERK1/2) in PTs of WT and CAV-1 KO mice. Note that p-ERK1/2 was increased in the PT by ANG II in WT mice but not in CAV-1 KO mice. **P < 0.01 vs. control; ++P < 0.01 vs. ANG II.
Fig. 13.
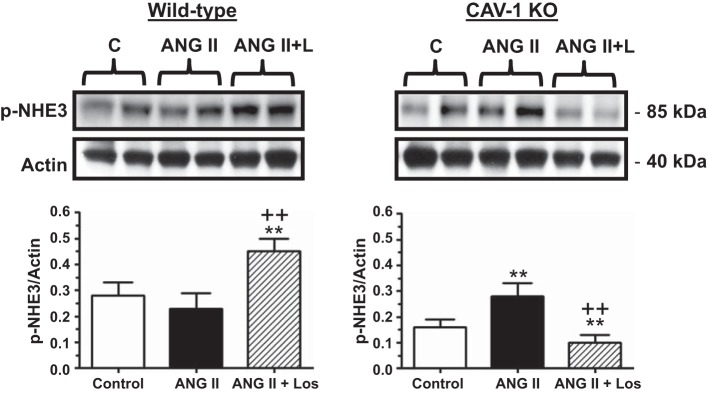
Effect of CAV-1 KO and Los on p-NHE3 levels in PTs of WT and CAV-1 KO mice. Note that p-NHE3 was slightly decreased in the PT by ANG II in WT mice, probably due to the marked hypertensive response to ANG II. In contrast, p-NHE3 was increased in the PT of CAV-1 KO mice in response to ANG II infusion. Los reversed the effects of ANG II in both WT and CAV-1 KO mice. **P < 0.01 vs. control; ++P < 0.01 vs. ANG II.
ANG II-induced MAPK ERK1/2 signaling responses were different between WT and CAV-1 KO mice (Fig. 12). In WT mice, ANG II administration increased phospho-ERK1/2 proteins by 153% (basal: 0.13 ± 0.05 vs. ANG II: 0.33 ± 0.05; P < 0.01), and the response was again blocked by losartan (ANG II + losartan: 0.10 ± 0.02, P < 0.01 vs. ANG II). In contrast, ANG II infusion had no effect on phospho-ERK1/2 signaling responses in CAV-1 KO mice (basal: 0.12 ± 0.03 vs. ANG II: 0.08 ± 0.02, NS), but losartan administration had an opposite effect (ANG II + losartan: 0.30 ± 0.05, P < 0.01 vs. ANG II; Fig. 12).
The NHE3 signaling response is downstream of the activation of PKC-α and MAPK ERK1/2 in the proximal tubule but is dependent on blood pressure (25, 31). In WT mice, ANG II administration slightly decreased phospho-NHE3 proteins, but not significantly (basal: 0.28 ± 0.05 vs. ANG II: 0.23 ± 0.06, NS; Fig. 13). However, concurrent losartan treatment led to significant increases in phospho-NHE3 proteins in the proximal tubule of WT mice (ANG II + losartan: 0.45 ± 0.05, P < 0.01 vs. ANG II). In CAV-1 KO mice, basal phospho-NHE3 proteins were significantly lower than in WT mice (basal: 0.16 ± 0.03, P < 0.05 vs. basal in WT mice). However, ANG II was able to increase phospho-NHE3 proteins significantly in CAV-1 KO mice (ANG II: 0.28 ± 0.05, P < 0.01 vs. basal). In contrast to WT mice, losartan administration completely reversed the phospho-NHE3 response in CAV-1 KO mice (ANG II + losartan: 0.10 ± 0.03, P < 0.05 vs. ANG II; Fig. 13).
DISCUSSION
The major objectives of the present study were twofold: 1) to determine whether CAV-1 is involved in the regulation of AT1 (AT1a) receptor-mediated uptake of extracellular ANG II by proximal tubule cells in vitro and in vivo and 2) to determine whether genetic deletion of CAV-1 alters blood pressure and renal excretory and signaling responses to ANG II in the proximal tubule of the kidney. Using FITC-labeled ANG II in vitro and Alexa fluor 488 ANG II conjugate in vivo as the innovative approaches, our results show that CAV-1 was clearly involved in mediating up to 50–70% of ANG II uptake by mPCT cells in vitro and in the proximal tubule of the kidney under physiological conditions. This conclusion is derived from experiments in which specific CAV-1 siRNA was used to knock down CAV-1 expression in cultured mPCT cells, and CAV-1 KO mice were used as an animal model. Furthermore, our results also suggest that CAV-1 may play an important role in AT1a receptor-mediated blood pressure and renal excretory and signaling responses to ANG II in mice.
Whether CAV-1 is biologically or physiologically involved in AT1a receptor-mediated ANG II uptake in the proximal tubule has not been previously studied. Currently, there is a lack of general consensus in the field as to whether CAV-1 is physiologically expressed or present in the proximal tubule of the kidney (2, 11, 28, 46, 47). An early study (2) using immunocytochemical staining reported that no CAV-1 proteins were found in the proximal tubule of the kidney, but there were abundant CAV-1 proteins expressed in endothelial cells, smooth muscle cells, distal tubule cells, and collecting duct principal cells in the kidney. A later study (11), however, showed that CAV-1 was expressed on the plasma membranes of early regenerating proximal tubule cells and increasingly internalized into the cytoplasm of the late regenerating proximal tubule cells of rats with gentamicin-induced acute kidney injury. Zager et al. (46) found that CAV-1 proteins were clearly detected in freshly isolated proximal tubules of rats under physiological conditions, which were substantially increased 18 h after ischemic-reperfusion injury (28, 46). A recent study by Zhuang et al. (47) confirmed that CAV-1 was expressed in cultured proximal tubule cells but that its mRNA or proteins were undetectable in proximal tubules of rat and mouse kidneys. The latter authors suggest that CAV-1 expression in proximal tubules of rat or mouse kidneys, as reported by others, is probably due to contamination with other CAV-1-rich endothelial cells or tubular epithelial cells (47). The present study was not designed specifically to determine whether the proximal tubule of the kidney expresses CAV-1 mRNA and proteins. Nevertheless, our data derived from CAV-1 siRNA (Fig. 1), CAV-1 KO mice (Fig. 5), and Western blot approaches are consistent with the above-mentioned studies in that CAV-1 mRNA and proteins were expressed or present in mPCT cells in vitro and in isolated proximal tubules of the mouse kidney. mPCT cells, WT mice, and CAV-1 KO mice may therefore be useful in vitro and in vivo models to investigate whether CAV-1 is involved in the regulation of AT1a receptor-mediated uptake of ANG II and signaling responses to ANG II in the proximal tubule of the kidney.
The results of the present study further extend our previous works that investigated the molecular and signaling mechanisms of AT1a receptor-mediated uptake of ANG II in cultured proximal tubule cells in vitro and in the proximal tubule of the kidney in vivo (18, 20, 22–24). To our knowledge, in the present study, we provide solid evidence for the first time that CAV-1 in the proximal tubule plays an important role in mediating ANG II uptake in vitro and in vivo using three complementary approaches: CAV-1 siRNA in WT mPCT cells (Fig. 2), CAV-1 KO mice (Fig. 6), and freshly isolated proximal tubules (Fig. 7). In previous studies, we have identified the roles of AT1 (AT1a) receptors (22–24), tyrosine phosphatase (18), cytoskeleton microtubule-associated proteins (18, 20), and megalin (27), all of which may interact directly or indirectly with AT1a receptors and alter ANG II uptake in proximal tubule cells. Schelling et al. (40) also showed that cytoskeleton-dependent endocytosis of apical membrane AT1 receptor was involved in ANG II-induced phospholipase C activation in cultured rat proximal tubule cells. In vascular smooth muscle cells, ANG II-induced AT1 (AT1a) receptor endocytosis is primarily involved the canonical clathrin-coated pits and may also involve cytoskeleton microtubules and CAV-1 (1, 10, 14, 15). However, clathrin-coated pits appear not to play a key role in mediating ANG II uptake in proximal tubule cells, since siRNA silencing of heavy and light chain clathrin expression has little effect on ANG II uptake (20). In the present study, it is interesting to note that the AT1 receptor blocker losartan completely blocked the uptake of FITC-labeled ANG II in mPCT cells, whereas CAV-1 knockdown or KO attenuate ∼50–70% of ANG II uptake in vitro and in vivo. FITC-labeled ANG II uptake, which persisted in the presence of CAV-1 siRNA treatment in vitro or in the kidneys of CAV-1 KO mice, may be completely abolished by losartan. These results strongly suggest that the uptake of circulating and paracrine ANG II in the proximal tubule of the kidney is primarily mediated by AT1 (AT1a) receptors and suggest that ANG II may first bind AT1 (AT1a) receptors on the apical and/or basolateral membranes, the majority of which may then be sorted to the caveolae/CAV-1-dependent pathway. Indeed, a previous study (45) has shown that CAV-1 may interact with AT1 receptors during intracellular vesicular or protein trafficking, but not at the plasma membrane.
Whether CAV-1 plays a physiological role in the regulation of proximal tubular function and arterial blood pressure also remains poorly understood. CAV-1 has been studied extensively for its role in the formation of caveolae, the regulation of the vesicular transport, the maintenance of cholesterol homeostasis, and in the modulation of signal transduction (5, 9, 34, 43). Global CAV-1 KO mice are associated with some cardiovascular disease phenotypes, such as cardiac hypertrophy, atherosclerosis, cardiacmyopathy, and pulmonary hypertension (6, 9). However, the blood pressure phenotype of CAV-1 KO mice remains inconsistent, with an increase, a decrease, or no change in blood pressure being previously reported (4, 36, 38, 41). Our present results on basal blood pressure levels and their responses to ANG II in CAV-1 KO mice are consistent with those of Pojoga et al. (4, 36, 37) but are different from those reported by Sward et al. (41) and Desjardins et al. (8). We found that basal systolic blood vessels were ∼8 ± 2 mmHg higher in conscious CAV-1 KO mice than in WT control mice. This basal blood pressure phenotype appears to be somewhat inconsistent with our previous studies, in which we found that increased AT1a receptor-mediated uptake of ANG II or overexpression of ANG II in the proximal tubule of the kidney is associated with increases in blood pressure, whereas inhibition of AT1a receptor-mediated uptake of ANG II by losartan or in AT1a KO mice is associated with lower blood pressure (19, 22, 24, 26). Thus, decreased AT1a receptor-mediated uptake of ANG II in the proximal tubule of the kidney (and other tissues as well) of CAV-1 KO mice is expected to be associated with lower blood pressure instead of elevated blood pressure. However, the mechanisms responsible for elevated basal blood pressure in CAV 1-KO mice are probably more complicated than AT1a receptor-mediated uptake of ANG II alone. For example, Pojoga et al. (35) reported that global CAV-1 deficiency is associated with increased blood pressure and vasoconstriction and decreased NO synthase (NOS)-mediated vascular relaxation and endothelial NOS expression in CAV-1 KO mice. The latter mechanism may at least partly contribute to the higher basal blood pressure in CAV-1 KO mice.
The present study further demonstrate that blood pressure responses to 2-wk ANG II infusion were significantly attenuated in CAV-1 KO mice. Although the mechanisms underlying these findings remain to be further investigated, our results suggest that CAV-1 clearly plays an important role in AT1a receptor-mediating downstream signaling responses to ANG II, and the effect on blood pressure. This interpretation is consistent with previous studies (4, 9, 12, 36) in which basal vascular and blood pressure responses and their responses to ANG II were investigated acutely. For example, Drab et al. (9) demonstrated a significant weaker Ca2+-dependent vascular contractile response to ANG II in vitro. Pojoga et al. (26) found that under basal conditions, systolic blood pressure in CAV-1 KO mice was ∼7 ± 4 mmHg higher than in their WT counterparts. The difference is that blood pressure responses to combined ANG II and N-nitro-l-arginine methyl ester treatment were increased in CAV-1 KO mice (36), whereas ANG II infusion alone was used in the present study. It is very likely that global deletion of CAV-1 significantly impairs the structure and function of caveolae in cardiovascular and renal tissues, which leads to abnormal NO and Ca2+ signaling responses to ANG II (5, 6, 9, 34, 43).
It is also interesting to comment on the basal renal excretory phenotypes and their responses to ANG II in the present study, which have not been reported previously. Although basal blood pressure was elevated in CAV-1 KO mice, this was not associated with pressure-induced diuretic and natriuretic responses (Table 1). In WT mice, ANG II-induced hypertension was associated with pressure-induced diuresis and natriuresis, as we have previously observed in mice and rats (22, 25, 50). In contrast, 24-h urine output and urinary Na+ excretory responses as well as several downstream signaling responses to ANG II in the proximal tubule of the kidney were all attenuated in CAV-1 KO mice in the present study. Gildea et al. (12) previously showed that acute infusion of specific CAV-1 siRNA directly into the renal cortical interstitium of the rat kidney or disruption of caveolae/lipid rafts with β-methyl cyclodextrin also significantly attenuated natriuretic responses. The mechanisms underlying the lack of or impaired pressure-dependent natriuretic responses in CAV-1 KO mice remain unknown, but two factors may be involved. First, the NOS/NO system has been suggested to play an important role in pressure natriuresis in the kidney (13, 29). Genetic deletion of CAV-1 impairs NOS/NO trafficking and signaling and, thus, the pressure natriuresis response. Second, ANG II has biphasic effects on the expression and activity of NHE3 in the proximal tubule of the kidney, with stimulation by nonpressor doses and inhibition by pressor doses of ANG II (25, 32). Furthermore, it has been shown that the epithelial Na+ channel is enriched in caveolin-rich lipid rafts and that pharmacological disruption of lipid raft formation decreases the activity of epithelial Na+ channels (16). These results support the notion that chronic disruption of lipid rafts and knockdown or KO of CAV-1 attenuates pressure-induced natriuretic responses in the kidney. Finally, 24-h urinary K+ excretion was significantly lower in CAV-1 KO mice than in WT mice in response to ANG II (Table 2), which suggests that ANG II may stimulate K+ absorption. However, this explanation is inconsistent with a key function of ANG II on K+ absorption in the kidney via aldosterone and mineralocorticoid receptor signaling. A recent study (26) has shown that the aldosterone/mineralocorticoid receptor signaling is significantly decreased in CAV-1 KO mice, which may partly explain the urinary K+ excretory response to ANG II in the present study.
In summary, the present study demonstrates, for the first time, that CAV-1 plays an important physiological role in the regulation of AT1 (AT1a) receptor-mediated uptake (or endocytosis) of ANG II in the proximal tubule of the kidney and blood pressure and renal responses to ANG II in mice. These conclusions are based primarily on our complementary experiments using cultured mPCTs, freshly isolated mouse proximal tubules, and CAV-1 KO mice. However, an interesting caveat of the present study is that with the use of CAV-1 KO mice as an animal model, it is difficult to rule out the possibility whether other CAV proteins, CAV-2 and CAV-3, may also be involved. Global KO of CAV-1 is known to be associated with nearly 90% loss of CAV-2 proteins due to CAV-1's heterooligomerization with CAV-2 (5). Thus, the cardiovascular, blood pressure, and renal phenotypes of CAV-1 KO mice as revealed in our study may be considered in part due to CAV-2 deficiency as well. Nevertheless, CAV-2 KO mice do not show the abnormal vascular and altered lipid homeostasis phenotypes of CAV-1 KO mice (39). Another important caveat for the present study is that CAV-1 is deleted globally in all tissues in CAV-1 KO mice; thus, the cardiovascular, blood pressure, and renal phenotypic responses to ANG II demonstrated in our study are unlikely to be kidney and/or proximal tubule specific. For these reasons, it may be necessary to generate conditional proximal tubule-specific CAV-1 KO mice to further determine the specific roles of CAV-1 in mediating ANG II uptake and signaling responses to ANG II in the proximal tubule of the kidney.
GRANTS
This work was supported in part by National Institute of Diabetes and Digestive and Kidney Diseases Grants 2-R56-DK-067299 and 2-RO1-DK-067299 and by a Hearin Foundation Medical Research Scholar Award from the University of Mississippi Medical Center (to J. L. Zhuo).
DISCLOSURES
No conflicts of interest, financial or otherwise, are declared by the author(s).
AUTHOR CONTRIBUTIONS
Author contributions: X.C.L. and J.L.Z. conception and design of research; X.C.L., V.G., E.M.-Q., and J.L.Z. performed experiments; X.C.L., V.G., E.M.-Q., and J.L.Z. analyzed data; X.C.L., E.M.-Q., and J.L.Z. interpreted results of experiments; X.C.L., V.G., E.M.-Q., and J.L.Z. prepared figures; X.C.L., V.G., and J.L.Z. drafted manuscript; X.C.L., V.G., and J.L.Z. edited and revised manuscript; X.C.L., V.G., E.M.-Q., and J.L.Z. approved final version of manuscript.
ACKNOWLEDGMENTS
The authors thank Dr. Ulrich Hopfer (Case Western Reserve University) for providing WT and AT1a KO mPCT cells for the present study.
Portions of this work were presented at the 65th Annual Fall Conference and Scientific Session of the American Heart Association in Orlando, FL, on September 20–24, 2011, and published as an abstract in Hypertension (58: e44, 2011).
REFERENCES
- 1.Anderson KM, Peach MJ. Receptor binding and internalization of a unique biologically active angiotensin II-colloidal gold conjugate: morphological analysis of angiotensin II processing in isolated vascular strips. J Vasc Res 31: 10–17, 1994 [DOI] [PubMed] [Google Scholar]
- 2.Breton S, Lisanti MP, Tyszkowski R, McLaughlin M, Brown D. Basolateral distribution of caveolin-1 in the kidney. Absence from H+-ATPase-coated endocytic vesicles in intercalated cells. J Histochem Cytochem 46: 205–214, 1998 [DOI] [PubMed] [Google Scholar]
- 3.Cao G, Yang G, Timme TL, Saika T, Truong LD, Satoh T, Goltsov A, Park SH, Men T, Kusaka N, Tian W, Ren C, Wang H, Kadmon D, Cai WW, Chinault AC, Boone TB, Bradley A, Thompson TC. Disruption of the caveolin-1 gene impairs renal calcium reabsorption and leads to hypercalciuria and urolithiasis. Am J Pathol 162: 1241–1248, 2003 [DOI] [PMC free article] [PubMed] [Google Scholar]
- 4.Chuengsamarn S, Garza AE, Krug AW, Romero JR, Adler GK, Williams GH, Pojoga LH. Direct renin inhibition modulates insulin resistance in caveolin-1-deficient mice. Metabolism 62: 275–281, 2013 [DOI] [PMC free article] [PubMed] [Google Scholar]
- 5.Cohen AW, Hnasko R, Schubert W, Lisanti MP. Role of caveolae and caveolins in health and disease. Physiol Rev 84: 1341–1379, 2004 [DOI] [PubMed] [Google Scholar]
- 6.Cohen AW, Park DS, Woodman SE, Williams TM, Chandra M, Shirani J, Pereira de SA, Kitsis RN, Russell RG, Weiss LM, Tang B, Jelicks LA, Factor SM, Shtutin V, Tanowitz HB, Lisanti MP. Caveolin-1 null mice develop cardiac hypertrophy with hyperactivation of p42/44 MAP kinase in cardiac fibroblasts. Am J Physiol Cell Physiol 284: C457–C474, 2003 [DOI] [PubMed] [Google Scholar]
- 7.Das M, Das DK. Caveolae, caveolin, and cavins: potential targets for the treatment of cardiac disease. Ann Med 44: 530–541, 2012 [DOI] [PubMed] [Google Scholar]
- 8.Desjardins F, Lobysheva I, Pelat M, Gallez B, Feron O, Dessy C, Balligand JL. Control of blood pressure variability in caveolin-1-deficient mice: role of nitric oxide identified in vivo through spectral analysis. Cardiovasc Res 79: 527–536, 2008 [DOI] [PubMed] [Google Scholar]
- 9.Drab M, Verkade P, Elger M, Kasper M, Lohn M, Lauterbach B, Menne J, Lindschau C, Mende F, Luft FC, Schedl A, Haller H, Kurzchalia TV. Loss of caveolae, vascular dysfunction, and pulmonary defects in caveolin-1 gene-disrupted mice. Science 293: 2449–2452, 2001 [DOI] [PubMed] [Google Scholar]
- 10.Ferguson SS. Evolving concepts in G protein-coupled receptor endocytosis: the role in receptor desensitization and signaling. Pharmacol Rev 53: 1–24, 2001 [PubMed] [Google Scholar]
- 11.Fujigaki Y, Sakakima M, Sun Y, Goto T, Ohashi N, Fukasawa H, Tsuji T, Yamamoto T, Hishida A. Immunohistochemical study on caveolin-1α in regenerating process of tubular cells in gentamicin-induced acute tubular injury in rats. Virchows Arch 450: 671–681, 2007 [DOI] [PubMed] [Google Scholar]
- 12.Gildea JJ, Kemp BA, Howell NL, Van Sciver RE, Carey RM, Felder RA. Inhibition of renal caveolin-1 reduces natriuresis and produces hypertension in sodium-loaded rats. Am J Physiol Renal Physiol 300: F914–F920, 2011 [DOI] [PMC free article] [PubMed] [Google Scholar]
- 13.Granger JP, Alexander BT. Abnormal pressure-natriuresis in hypertension: role of nitric oxide. Acta Physiol Scand 168: 161–168, 2000 [DOI] [PubMed] [Google Scholar]
- 14.Hein L, Meinel L, Pratt RE, Dzau VJ, Kobilka BK. Intracellular trafficking of angiotensin II and its AT1 and AT2 receptors: evidence for selective sorting of receptor and ligand. Mol Endocrinol 11: 1266–1277, 1997 [DOI] [PubMed] [Google Scholar]
- 15.Ishizaka N, Griendling KK, Lassegue B, Alexander RW. Angiotensin II type 1 receptor: relationship with caveolae and caveolin after initial agonist stimulation. Hypertension 32: 459–466, 1998 [DOI] [PubMed] [Google Scholar]
- 16.Lee IH, Campbell CR, Song SH, Day ML, Kumar S, Cook DI, Dinudom A. The activity of the epithelial sodium channels is regulated by caveolin-1 via a Nedd4-2-dependent mechanism. J Biol Chem 284: 12663–12669, 2009 [DOI] [PMC free article] [PubMed] [Google Scholar]
- 17.Leick M, Catusse J, Follo M, Nibbs RJ, Hartmann TN, Veelken H, Burger M. CCL19 is a specific ligand of the constitutively recycling atypical human chemokine receptor CRAM-B. Immunology 129: 536–546, 2010 [DOI] [PMC free article] [PubMed] [Google Scholar]
- 18.Li XC, Carretero OA, Navar LG, Zhuo JL. AT1 receptor-mediated accumulation of extracellular angiotensin II in proximal tubule cells: role of cytoskeleton microtubules and tyrosine phosphatases. Am J Physiol Renal Physiol 291: F375–F383, 2006 [DOI] [PMC free article] [PubMed] [Google Scholar]
- 19.Li XC, Cook JL, Rubera I, Tauc M, Zhang F, Zhuo JL. Intrarenal transfer of an intracellular cyan fluorescent fusion of angiotensin II selectively in proximal tubules increases blood pressure in rats and mice. Am J Physiol Renal Physiol 300: F1076–F1088, 2011 [DOI] [PMC free article] [PubMed] [Google Scholar]
- 20.Li XC, Hopfer U, Zhuo JL. AT1 receptor-mediated uptake of angiotensin II and NHE-3 expression in proximal tubule cells through the microtubule-dependent endocytic pathway. Am J Physiol Renal Physiol 297: F1342–F1352, 2009 [DOI] [PMC free article] [PubMed] [Google Scholar]
- 21.Li XC, Hopfer U, Zhuo JL. Novel signaling mechanisms of intracellular angiotensin II-induced NHE3 expression and activation in mouse proximal tubule cells. Am J Physiol Renal Physiol 303: F1617–F1628, 2012 [DOI] [PMC free article] [PubMed] [Google Scholar]
- 22.Li XC, Navar LG, Shao Y, Zhuo JL. Genetic deletion of AT1a receptors attenuates intracellular accumulation of angiotensin II in the kidney of AT1a receptor-deficient mice. Am J Physiol Renal Physiol 293: F586–F593, 2007 [DOI] [PMC free article] [PubMed] [Google Scholar]
- 23.Li XC, Zhuo JL. Selective knockdown of AT1 receptors by RNA interference inhibits Val5-Ang II endocytosis and NHE-3 expression in immortalized rabbit proximal tubule cells. Am J Physiol Cell Physiol 293: C367–C378, 2007 [DOI] [PMC free article] [PubMed] [Google Scholar]
- 24.Li XC, Zhuo JL. In vivo regulation of AT1a receptor-mediated intracellular uptake of [125I]Val5-angiotensin II in the kidneys and adrenal glands of AT1a receptor-deficient mice. Am J Physiol Renal Physiol 294: F293–F302, 2008 [DOI] [PMC free article] [PubMed] [Google Scholar]
- 25.Li XC, Zhuo JL. Phosphoproteomic analysis of AT1 receptor-mediated signaling responses in proximal tubules of angiotensin II-induced hypertensive rats. Kidney Int 80: 620–632, 2011 [DOI] [PMC free article] [PubMed] [Google Scholar]
- 26.Li XC, Zhuo JL. Proximal tubule-dominant transfer of AT1a receptors induces blood pressure responses to intracellular angiotensin II in AT1a receptor-deficient mice. Am J Physiol Regul Integr Comp Physiol 304: R588–R598, 2013 [DOI] [PMC free article] [PubMed] [Google Scholar]
- 27.Li XC, Zhuo JL. Mechanisms of AT1a receptor-mediated uptake of angiotensin II by proximal tubule cells: a novel role of the multiligand endocytic receptor megalin. Am J Physiol Renal Physiol 307: F222–F233, 2014 [DOI] [PMC free article] [PubMed] [Google Scholar]
- 28.Mahmoudi M, Willgoss D, Cuttle L, Yang T, Pat B, Winterford C, Endre Z, Johnson DW, Gobe GC. In vivo and in vitro models demonstrate a role for caveolin-1 in the pathogenesis of ischaemic acute renal failure. J Pathol 200: 396–405, 2003 [DOI] [PubMed] [Google Scholar]
- 29.Majid DS, Williams A, Navar LG. Inhibition of nitric oxide synthesis attenuates pressure-induced natriuretic responses in anesthetized dogs. Am J Physiol Renal Fluid Electrolyte Physiol 264: F79–F87, 1993 [DOI] [PubMed] [Google Scholar]
- 30.Manninen A, Verkade P, Le LS, Torkko J, Kasper M, Fullekrug J, Simons K. Caveolin-1 is not essential for biosynthetic apical membrane transport. Mol Cell Biol 25: 10087–10096, 2005 [DOI] [PMC free article] [PubMed] [Google Scholar]
- 31.McDonough AA, Leong PK, Yang LE. Mechanisms of pressure natriuresis: how blood pressure regulates renal sodium transport. Ann NY Acad Sci 986: 669–677, 2003 [DOI] [PubMed] [Google Scholar]
- 32.Nguyen MT, Lee DH, Delpire E, McDonough AA. Differential regulation of Na+ transporters along nephron during ANG II-dependent hypertension: distal stimulation counteracted by proximal inhibition. Am J Physiol Renal Physiol 305: F510–F519, 2013 [DOI] [PMC free article] [PubMed] [Google Scholar]
- 33.Park DS, Woodman SE, Schubert W, Cohen AW, Frank PG, Chandra M, Shirani J, Razani B, Tang B, Jelicks LA, Factor SM, Weiss LM, Tanowitz HB, Lisanti MP. Caveolin-1/3 double-knockout mice are viable, but lack both muscle and non-muscle caveolae, and develop a severe cardiomyopathic phenotype. Am J Pathol 160: 2207–2217, 2002 [DOI] [PMC free article] [PubMed] [Google Scholar]
- 34.Parton RG, del Pozo MA. Caveolae as plasma membrane sensors, protectors and organizers. Nat Rev Mol Cell Biol 14: 98–112, 2013 [DOI] [PubMed] [Google Scholar]
- 35.Pojoga LH, Adamova Z, Kumar A, Stennett AK, Romero JR, Adler GK, Williams GH, Khalil RA. Sensitivity of NOS-dependent vascular relaxation pathway to mineralocorticoid receptor blockade in caveolin-1-deficient mice. Am J Physiol Heart Circ Physiol 298: H1776–H1788, 2010 [DOI] [PMC free article] [PubMed] [Google Scholar]
- 36.Pojoga LH, Romero JR, Yao TM, Loutraris P, Ricchiuti V, Coutinho P, Guo C, Lapointe N, Stone JR, Adler GK, Williams GH. Caveolin-1 ablation reduces the adverse cardiovascular effects of N-ω-nitro-l-arginine methyl ester and angiotensin II. Endocrinology 151: 1236–1246, 2010 [DOI] [PMC free article] [PubMed] [Google Scholar]
- 37.Pojoga LH, Yao TM, Opsasnick LA, Garza AE, Reslan OM, Adler GK, Williams GH, Khalil RA. Dissociation of hyperglycemia from altered vascular contraction and relaxation mechanisms in caveolin-1 null mice. J Pharmacol Exp Ther 348: 260–270, 2014 [DOI] [PMC free article] [PubMed] [Google Scholar]
- 38.Pojoga LH, Yao TM, Sinha S, Ross RL, Lin JC, Raffetto JD, Adler GK, Williams GH, Khalil RA. Effect of dietary sodium on vasoconstriction and eNOS-mediated vascular relaxation in caveolin-1-deficient mice. Am J Physiol Heart Circ Physiol 294: H1258–H1265, 2008 [DOI] [PMC free article] [PubMed] [Google Scholar]
- 39.Razani B, Wang XB, Engelman JA, Battista M, Lagaud G, Zhang XL, Kneitz B, Hou H, Jr, Christ GJ, Edelmann W, Lisanti MP. Caveolin-2-deficient mice show evidence of severe pulmonary dysfunction without disruption of caveolae. Mol Cell Biol 22: 2329–2344, 2002 [DOI] [PMC free article] [PubMed] [Google Scholar]
- 40.Schelling JR, Hanson AS, Marzec R, Linas SL. Cytoskeleton-dependent endocytosis is required for apical type 1 angiotensin II receptor-mediated phospholipase C activation in cultured rat proximal tubule cells. J Clin Invest 90: 2472–2480, 1992 [DOI] [PMC free article] [PubMed] [Google Scholar]
- 41.Sward K, Albinsson S, Rippe C. Arterial dysfunction but maintained systemic blood pressure in cavin-1-deficient mice. PLOS ONE 9: e92428, 2014 [DOI] [PMC free article] [PubMed] [Google Scholar]
- 42.Takayanagi T, Crawford KJ, Kobayashi T, Obama T, Tsuji T, Elliott KJ, Hashimoto T, Rizzo V, Eguchi S. Caveolin-1 is critical for abdominal aortic aneurysm formation induced by angiotensin II and inhibition of lysyl oxidase. Clin Sci (Lond) 126: 785–794, 2013 [DOI] [PMC free article] [PubMed] [Google Scholar]
- 43.Williams TM, Lisanti MP. The caveolin genes: from cell biology to medicine. Ann Med 36: 584–595, 2004 [DOI] [PubMed] [Google Scholar]
- 44.Woost PG, Kolb RJ, Finesilver M, Mackraj I, Imboden H, Coffman TM, Hopfer U. Strategy for the development of a matched set of transport-competent, angiotensin receptor-deficient proximal tubule cell lines. In Vitro Cell Dev Biol Anim 42: 189–200, 2006 [DOI] [PubMed] [Google Scholar]
- 45.Wyse BD, Prior IA, Qian H, Morrow IC, Nixon S, Muncke C, Kurzchalia TV, Thomas WG, Parton RG, Hancock JF. Caveolin interacts with the angiotensin II type 1 receptor during exocytic transport but not at the plasma membrane. J Bio Chem 278, 23738–23746. 2003 [DOI] [PubMed] [Google Scholar]
- 46.Zager RA, Johnson A, Hanson S, dela R, V. Altered cholesterol localization and caveolin expression during the evolution of acute renal failure. Kidney Int 61: 1674–1683, 2002 [DOI] [PubMed] [Google Scholar]
- 47.Zhuang Z, Marshansky V, Breton S, Brown D. Is caveolin involved in normal proximal tubule function? Presence in model PT systems but absence in situ. Am J Physiol Renal Physiol 300: F199–F206, 2011 [DOI] [PMC free article] [PubMed] [Google Scholar]
- 48.Zhuo JL, Alcorn D, Harris PJ, Mendelsohn FA. Localization and properties of angiotensin II receptors in rat kidney. Kidney Int Suppl 42: S40–S46, 1993 [PubMed] [Google Scholar]
- 49.Zhuo JL, Alcorn D, McCausland J, Casley D, Mendelsohn FA. In vivo occupancy of angiotensin II subtype 1 receptors in rat renal medullary interstitial cells. Hypertension 23: 838–843, 1994 [DOI] [PubMed] [Google Scholar]
- 50.Zhuo JL, Imig JD, Hammond TG, Orengo S, Benes E, Navar LG. Ang II accumulation in rat renal endosomes during Ang II-induced hypertension: role of AT1 receptor. Hypertension 39: 116–121, 2002 [DOI] [PubMed] [Google Scholar]