Abstract
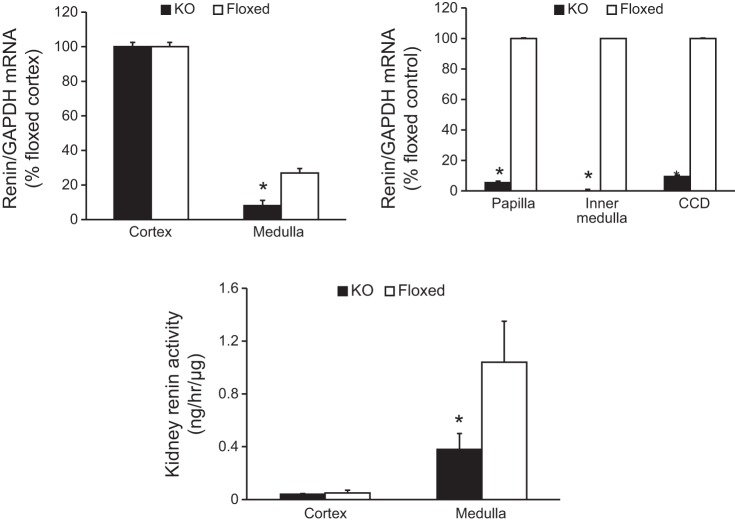
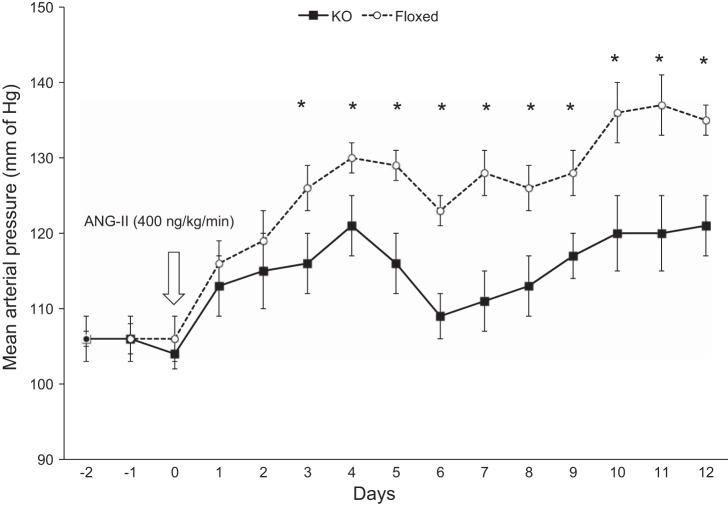
The physiological and pathophysiological significance of collecting duct (CD)-derived renin, particularly as it relates to blood pressure (BP) regulation, is unknown. To address this question, we generated CD-specific renin knockout (KO) mice and examined BP and renal salt and water excretion. Mice containing loxP-flanked exon 1 of the renin gene were crossed with mice transgenic for aquaporin-2-Cre recombinase to achieve CD-specific renin KO. Compared with controls, CD renin KO mice had 70% lower medullary renin mRNA and 90% lower renin mRNA in microdissected cortical CD. Urinary renin levels were significantly lower in KO mice (45% of control levels) while plasma renin concentration was significantly higher in KO mice (63% higher than controls) during normal-Na intake. While no observable differences were noted in BP between the two groups with varying Na intake, infusion of angiotensin II at 400 ng·kg−1·min−1 resulted in an attenuated hypertensive response in the KO mice (mean arterial pressure 111 ± 4 mmHg in KO vs. 128 ± 3 mmHg in controls). Urinary renin excretion and epithelial Na+ channel (ENaC) remained significantly lower in the KO mice following ANG II infusion compared with controls. Furthermore, membrane-associated ENaC protein levels were significantly lower in KO mice following ANG II infusion. These findings suggest that CD renin modulates BP in ANG II-infused hypertension and these effects are associated with changes in ENaC expression.
Keywords: renin, collecting duct, hypertension
the intrarenal renin-angiotensin system (RAS) contains all the necessary elements to generate tubular angiotensin II (ANG II). One essential component of the intrarenal RAS may be collecting duct (CD)-derived renin. Described initially by Rohrwasser et al. in 1999 (21), renin immunostaining was localized to principal cells of the connecting segment in murine and human kidney sections and in cultured isolated connecting segment cells. Subsequent studies demonstrated that renin colocalized with aquaporin-2 in cortical and medullary CD and connecting segment (17, 20). Furthermore, medullary renin levels are increased in the setting of exogenous ANG II hypertension, 2-kidney 1-clip Goldblatt hypertension, and in a transgenic rat model with inducible extra-renal mouse renin gene (Ren 2) expression (15, 16, 18). Urinary renin excretion was increased in ANG II-infused hypertension, despite suppression of systemic renin, suggesting that the nephron, and possibly the CD, was responsible for the augmented urinary renin (9). In addition, medullary renin activity and renin fluorescence, as determined by multiphoton confocal microscopy, are elevated in experimental diabetes (7). These studies have led to the notion that CD renin secreted into the lumen may hydrolyze angiotensinogen (derived from the proximal tubule) to ultimately generate luminal ANG II, which in turn can modulate Na+ transport via activation of the epithelial Na+ channel (ENaC) (10, 13) and regulate blood pressure (BP) (3). However, despite advances in understanding CD renin expression, the functional significance of CD renin in BP regulation remains largely unknown.
We previously examined whether CD renin can regulate BP using mice with selective overexpression of renin in the CD. Mice with CD-specific overexpression of renin displayed modest salt-sensitive hypertension and reduced plasma renin concentration (PRC), suggesting that CD renin has the potential to regulate BP independent of the systemic RAS (19). In this study, we hypothesized that CD renin is important in BP regulation under both physiological and pathophysiological conditions. We describe a mouse model with CD-specific renin ablation and examine the effects on BP and Na+ balance under varying Na+ intakes and in response to ANG II infusion.
MATERIALS AND METHODS
Animal care.
All animal studies were conducted with the approval of the University of Utah Animal Care and Use Committee in accordance with the National Institutes of Health Guide for the Care and Use of Laboratory Animals.
Generation of CD-specific renin KO mice.
Details on generation of floxed renin mice have already been published (26). In brief, a targeting construct was made wherein exon 1 of the Ren1 gene was flanked by two loxP sites (floxed) and electroporated into mouse embryonic stem cells. Since exon 1 contains the transcriptional start site and encodes the initiation codon for translation, ablation of this exon leads to markedly reduced renin synthesis. Previous studies have described an alternative transcription start site in intron 1 denoted as exon 1b that can lead to renin synthesis; however, this renin lacks the signaling peptide, remains intracellular, and is found predominantly in the brain (26). Mice harboring the floxed exon 1 allele were bred with mice transgenic for aquaporin-2 (AQP2)-Cre to obtain principal cell-specific knockout (KO) of renin (Fig. 1). All mice were bred on a C57BL/6J background since C57BL/6J mice carry a single allele of the renin gene compared with other strains that carry two alleles (e.g., SvJ129 strain) (26). Mice were bred for at least six generations and homozygous KO and floxed mice of both sexes were used for all studies.
Fig. 1.
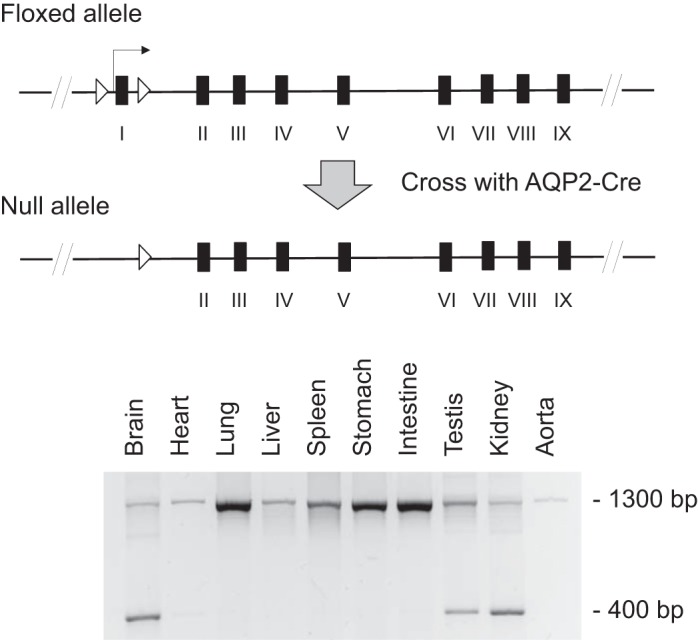
Gene-targeting strategy and aquaporin-2 (AQP2)-Cre-mediated recombination in collecting duct (CD)-specific renin knockout (KO) mice. Top: construct wherein exon 1 of the renin gene, flanked by loxP sites, is removed in the presence of Cre recombinase. Bottom: DNA recombination in the kidney, testis, and brain.
Genotyping.
Tail DNA was isolated and PCR was performed using the following primers: Renin, forward 5′-CCCATGCCTGCCACCACTCTGC-3′ and reverse 5′-CCTCCTTTCATCTAGACTCACCAT-3′, which yields a 418-bp product from the floxed renin gene and a 312-bp product from the wild-type allele; and AQP2, forward 5′-GAGACGTCAATCCTTATCTGGAG-3′; creTag, reverse 5′-GCGAACATCTTCAGGTTCTGCGG-3′; and R2D2, reverse 5′-GGCTACTCACAGCATTGACAGC-3′, which yield 600- and 650-bp products for AQP2-Cre and wild-type DNA, respectively.
Verification of organ-specific renin gene recombination.
DNA was isolated from a variety of organs and PCR was performed to examine the organ-specific expression of the recombined targeted renin gene. PCR was performed for 40 cycles at 94°C for 30 s, 68°C for 30 s, and 72°C for 50 s using the following primers to amplify the transgene: 5′-CCCATGCCTGCCACCACTCTGC-3′ and 5′-CTTCCTCCAGACACCTCATCTG-3′. These primers are located in introns 1 and 2 and yield a 1,300-bp product in nonrecombined DNA and a 400-bp product in recombined DNA.
Quantitation of renin mRNA.
Renal cortex, inner medulla, and papilla were dissected from CD renin KO and floxed mice for RNA isolation. In addition, cortical collecting ducts (CCD) were microdissected for determination of RNA content. Reverse transcription was performed on 2 μg of total RNA with oligo(dt) and Superscript III reverse transcriptase according to the manufacturer's protocol (Invitrogen, Grand Island, NY). The resulting cDNA was then assayed for relative expression of renin mRNA in KO and floxed mice using a Taqman Gene Expression Assay (Renin probe cat. no. Mm02342889_g1, GAPDH probe cat. no. Mm03302249_g1; Applied Biosystems, Carlsbad, CA).
BP monitoring.
BP was recorded via telemetry (TA11-PAC10, Data Sciences International, St. Paul, MN). CD renin KO and floxed mice aged 4 mo or older were anesthetized with 2% isoflorane, implanted with radio transmitters with the catheter in the carotid artery, and allowed to recover for 5 days. Automated BP and heart rate were recorded continuously for 3 wk thereafter with measurements taken every 10 min. Animals were maintained on a normal-Na+ diet (0.15% Na+) for 5 days, a high-Na+ diet (3.2% Na+) for 6 days, and a low-Na+ diet (0.01% Na+) for 3 days. Standard rodent chow was used for a normal-Na+ diet. High-Na+ (57BQ) and low-Na+ (5881) mouse chow were obtained from Testdiet (St. Louis, MO). Animals were not handled during BP recording period since even small stimuli can markedly affect BP in mice. Mean arterial pressure (MAP) was calculated as (1/3 × pulse pressure) + diastolic pressure.
Plasma and urine assays.
At the conclusion of the BP studies, KO and floxed mice were placed in metabolic cages for measurement of food and water intake, weight, and 24-h urine collection with varying Na+ intakes. Mice were allowed free access to water and given 9 ml of a gelled diet comprised of 62 g of rodent food (Testdiet), 7 g of gelatin, and 110 ml of water. The amount of Na+ and water that the mice ingest is identical using a pellet or gel diet; the gel diet is used for metabolic cage studies since it provides the most accurate assessment of food and water intake (8). A small amount of blood (35 μl) was collected from the dorsal pedal vein in chilled polypropylene tubes containing heparin lithium. Plasma was separated and chilled at −80°C until assay. Urine samples were centrifuged at 15,000 rpm for 15 min and the supernatant was frozen in aliquots at −80°C until assay. PRC and urine renin activity were measured as the amount of ANG I generated after incubation with excess porcine angiotensinogen using the ANG I enzyme immunoassay (EIA) kit (Bachem, San Carlos, CA). Ten microliters of plasma or urine were incubated for 20 min with excess porcine angiotensinogen (0.4 μmol/l; Sigma, St. Louis, MO) in a 50-μl reaction containing sodium acetate (50 mmol/l, pH 6.5), AEBSF (2 mmol/l), 8-hydoxoyquinoline (1 mmol/l), and EDTA (5 mmol/l), and ANG I generated was measured using a commercially available EIA (Bachem). PRC and urine renin activity were expressed as the amount of ANG I generated per hour per microliter of plasma or urine. Urinary Na+ and K+ were determined using the EasyVet Analyzer (Medica, Bedford, MA). Plasma ANG II was measured using EIA (Bachem).
ANG II infusion.
In separate experiments, adult mice were implanted with radio transmitters for BP and heart rate measurement. After 3 days of continuous BP monitoring, mini-osmotic pumps (Alzet model 1002, Durect, Cupertino, CA) were surgically placed in between the scapulas under isoflurane anesthesia. ANG II was infused for 14 days at 400 ng·kg−1·min−1 and BP was recorded continuously for 12 days on a normal-Na+ diet administered as a gel diet. At the end of the BP studies, mice were placed in metabolic cages for 24 h for urine collection as described above. Mice were then killed and kidneys were isolated for renin activity and Western blot analyses.
Western analysis.
Whole kidney was homogenized in ice-cold sucrose buffer (10 mM triethanolamine, 250 mM sucrose, pH 7.6) and complete protease inhibitors (Roche, Pleasanton, CA) and subject to differential centrifugation to isolate the membrane-bound protein. After the samples were centrifuged at 1,000 g for 15 min at 4°C in a Beckman J2-21 refrigerated centrifuge, the supernatant was collected and processed further at 17,000 g for 60 min at 4°C. The resulting pellet was solubilized in 500 μl of HBSS containing 15 mM HEPES, pH 7.4. An aliquot was taken for determination of protein content using the Bradford assay and the remaining sample was solubilized with Laemmli loading buffer containing 0.5% lithium dodecyl sulfate and boiled for 10 min.
Plasma membrane-enriched protein (20 μg/lane) was run on a denaturing NUPAGE 4–12% Bis-Tris minigel (Invitrogen), transferred to a polyvinylidene difluoride plus nylon membrane, and visualized with the Advance ECL system (GE Healthcare, Piscataway, NJ). Densitometry was performed with a Bio-Rad gel documentation system (Hercules, CA).
Primary antibodies used for immunoblotting were incubated with membranes in blocking buffer for 2 h at room temperature. Rabbit polyclonal anti-ENaC-α, -β, or -γ (StressMarq, Victoria, BC) were used at a dilution of 1:2,000. Secondary horseradish peroxidase-conjugated antibodies (goat anti-rabbit; Santa Cruz Biotechnology, Santa Cruz, CA) at a dilution of 1:5,000 were incubated at room temperature in blocking buffer for 1 h. After visualization, blots were reprobed with anti-β-actin antibody (Cell Signaling, Danvers, MA) at a dilution of 1:2,000 to control for loading, and exposed to secondary antibody at a dilution of 1:5,000.
The other kidney was used for measurement of renin activity in the cortex and medulla. Samples were homogenized in EIA buffer containing protease inhibitors (Roche) and centrifuged for 15 min at 4°C. The supernatant was collected and incubated with excess porcine angiotensinogen in a reaction similar to plasma and urine renin activity described above. ANG I was measured using EIA and the results were normalized to protein levels measured by Bradford assay.
Statistical analysis.
All results are expressed as means ± SE. The Student's unpaired t-test was used to compare differences between KO and floxed animals within a given diet for all parameters except BP. We initially analyzed BP as daytime and nighttime separately to reduce the effects caused by the heterogeneity in activity during the two periods. Since daytime and nighttime results parallel the BP trends from 24-h readings, we present all BP values as 24-h readings. One-way ANOVA was used to examine the differences in BP between the two groups.
RESULTS
Verification of kidney-specific expression of renin.
CD renin KO mice were born at the expected frequency, had normal growth rates, and had no apparent gross abnormalities. The kidneys had normal gross morphology and histology (hematoxylin and eosin) by light microscopy.
PCR of DNA isolated from a series of organs from the CD renin KO mouse demonstrated recombination in the kidneys, testes, and brain (Fig. 1). Our previous studies using the AQP2-Cre transgene showed that the degree of recombination within the brain is very small compared with the testis or kidney (2, 22, 23). Within the kidney, renin mRNA levels were similar in the cortex of KO and floxed mice presumably due to the predominance of juxtaglomerular renin in this region (juxtaglomerular cells are not targeted by AQP2-Cre). In contrast, renin mRNA levels were 70% lower in the medulla of KO mice compared with floxed mice (Fig. 2). Furthermore, renin mRNA levels were markedly lower in the inner medulla, papilla, and microdissected CCD in the KO mice compared with floxed controls (Fig. 2). Cortical renin activity was similar between KO and floxed mice (Fig. 2), presumably owing to the large amount of juxtaglomerular renin in this region. In contrast, medullary renin activity was reduced in the KO mice compared with floxed mice (Fig. 2) reflecting lower CD renin synthesis. These results confirmed CD-specific KO of renin.
Fig. 2.
Relative renin mRNA expression within the kidney as assessed by RT-PCR and kidney renin activity in CD renin KO and floxed mice. Top left: n = 8 for both genotypes. Top right: n = 4–6 for both genotypes. CCD, cortical CD isolated by microdissection. Bottom: renin activity in cortex and medulla by EIA, n = 12 for both genotypes. *P < 0.05 comparing with floxed mice.
Assessment of BP and metabolic balance.
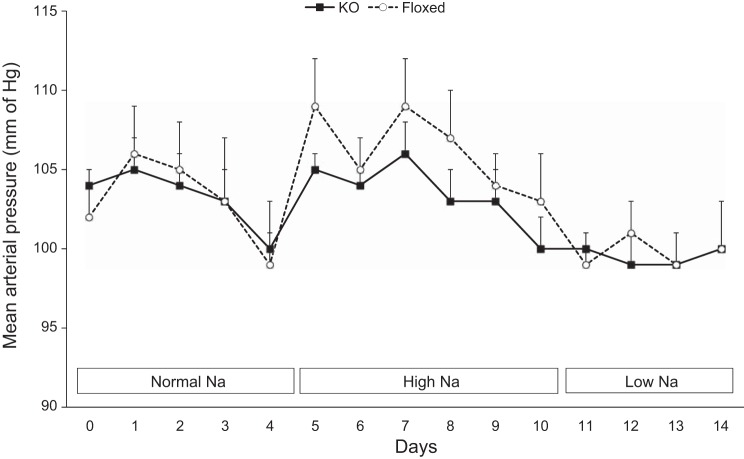
There were no detectable differences in 24-h MAP between the KO mice and floxed mice on normal-, high-, or low-Na+ diets (Fig. 3). Likewise, systolic and diastolic BP showed similar values between KO and floxed mice with varying Na+ intakes (data not shown). Both KO and floxed mice had comparable food and water intake, body weight, urine volume, and urinary excretion of Na+ and K+ with varying Na+ intakes (Table 1). Values for urinary solute and water excretion were determined on every day of the varying Na+ diets and were not different between the two mouse genotypes on any day; only those values for day 3 of each diet are shown to limit the magnitude of data presentation. Furthermore, cumulative Na+ and K+ excretion at the end of each diet were similar between the two groups (data not shown). The metabolic balance studies were conducted on a shorter duration to accurately determine changes in urinary Na+ excretion in response to a low- or a high-Na+ diet.
Fig. 3.
Mean arterial pressure by telemetry in CD renin KO and floxed mice on normal (0.15%)-, high (3.2%)-, and low (0.01%)-Na+ diets, n = 12 for both groups.
Table 1.
Food intake, water intake, weight, UV, UNaV, and UKV in CD renin KO and floxed mice
| Normal Na+ (0.15%) |
High Na+ (3.2%) |
Low Na+ (0.01%) |
||||
|---|---|---|---|---|---|---|
| KO | Floxed | KO | Floxed | KO | Floxed | |
| Food, g/day | 9.3 ± 0.5 | 9.2 ± 0.2 | 9.0 ± 0.7 | 10.0 ± 0.3 | 11.4 ± 0.3 | 10.9 ± 0.3 |
| Water, ml/day | 7.5 ± 0.6 | 6.9 ± 0.3 | 14.6 ± 1.2 | 16.1 ± 0.7 | 7.2 ± 0.7 | 7.9 ± 0.2 |
| Weight, g | 29.8 ± 1.2 | 29.5 ± 1.1 | 30.0 ± 1.1 | 29.8 ± 1.0 | 31.7 ± 1.1 | 31.4 ± 0.8 |
| UV, ml/day | 3.3 ± 0.2 | 3.7 ± 0.3 | 6.6 ± 0.6 | 7.2 ± 0.7 | 4.5 ± 0.3 | 4.5 ± 0.2 |
| UNaV, μeq/day | 319 ± 24 | 340 ± 24 | 2,595 ± 256 | 2,827 ± 181 | 96 ± 13 | 89 ± 8 |
| UKV, μeq/day | 289 ± 21 | 308 ± 24 | 575 ± 21 | 604 ± 14 | 573 ± 37 | 562 ± 21 |
Data are means ± SE. Food intake, water intake, weight, urine volume (UV), urinary Na+ excretion (UNaV), and urinary K+ excretion (UKV) are shown in collecting duct (CD) renin knockout (KO) and floxed mice. Data are shown on the third day after transitioning to each diet, n = 12 for both groups.
ANG II infusion.
Under baseline conditions on a normal-Na+ diet, MAP was similar in the KO and floxed groups (Fig. 4). Following ANG II infusion at 400 ng·kg−1·min−1, MAP was significantly higher in the floxed mice starting on day 3 (floxed: 126 ± 3 mmHg vs. KO: 116 ± 4 mmHg) and remained elevated throughout the study period (day 7 floxed: 128 ± 3 mmHg vs. KO: 111 ± 4 mmHg; day 12 floxed: 132 ± 2 mmHg vs. KO: 121 ± 4 mmHg; Fig. 4). Similarly, systolic BP was 14–20 mmHg higher and diastolic BP 10–15 mmHg higher in the floxed mice compared with the KO mice from day 3 onwards of ANG II infusion. Body weight, food intake, water intake, and urine volume were similar between the two groups following ANG II infusion (Table 2).
Fig. 4.
Mean arterial pressure by telemetry in CD renin KO and floxed mice following ANG II infusion (400 ng·kg−1·min−1) on a normal-Na+ (0.15%) diet, n = 8 for both groups. *P < 0.05 vs. floxed mice.
Table 2.
Food intake, water intake, weight, UV, UNaV, and UKV in CD renin KO and floxed mice following 12 days of ANG II infusion while on a normal-Na+ diet
| KO | Floxed | |
|---|---|---|
| Food, g/day | 5.5 ± 0.7 | 5.8 ± 0.1 |
| Water, ml/day | 7.4 ± 0.4 | 8.5 ± 0.3 |
| Weight, g | 28.2 ± 1.0 | 27.8 ± 0.8 |
| UV, ml/day | 1.8 ± 0.1 | 1.8 ± 0.2 |
| UNaV, μeq/day | 162 ± 16 | 185 ± 17 |
| UKV, μeq/day | 274 ± 16 | 249 ± 17 |
Data are means ± SE, n = 8 for each group.
Before ANG II infusion, PRC was significantly elevated in KO mice compared with floxed mice (Fig. 5). ANG II infusion suppressed PRC in both the KO and floxed mice on day 13 of ANG II infusion, with no discernible differences noted between the two groups (Fig. 5). Furthermore, plasma ANG II levels measured by EIA were similar between the two groups post ANG II infusion (KO: 1.53 ± 0.4 ng/ml, floxed: 1.92 ± 0.3 ng/ml), suggesting that the systemic RAS was comparable in the KO and floxed mice. In contrast, urinary renin excretion was significantly lower in KO than in floxed mice both before and following ANG II infusion (Fig. 5).
Fig. 5.
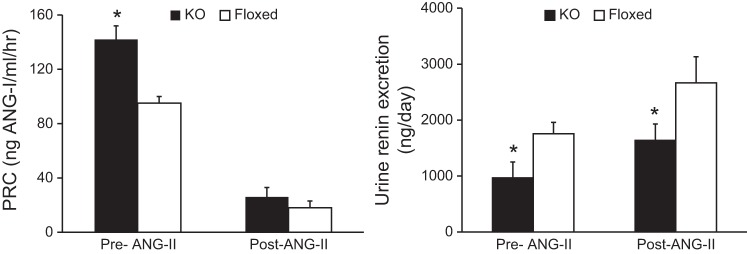
Renin activity in CD renin KO and floxed mice before and after 13 days of ANG II infusion (400 ng·kg−1·min−1) on a normal-Na+ (0.15%) diet. Left: plasma renin concentration (PRC). Right: 24-h urinary renin excretion, n = 12 for both groups, pre-ANG II infusion and n = 8 for both groups, post-ANG II infusion. *P < 0.05 vs. floxed mice.
Effects on ENaC expression.
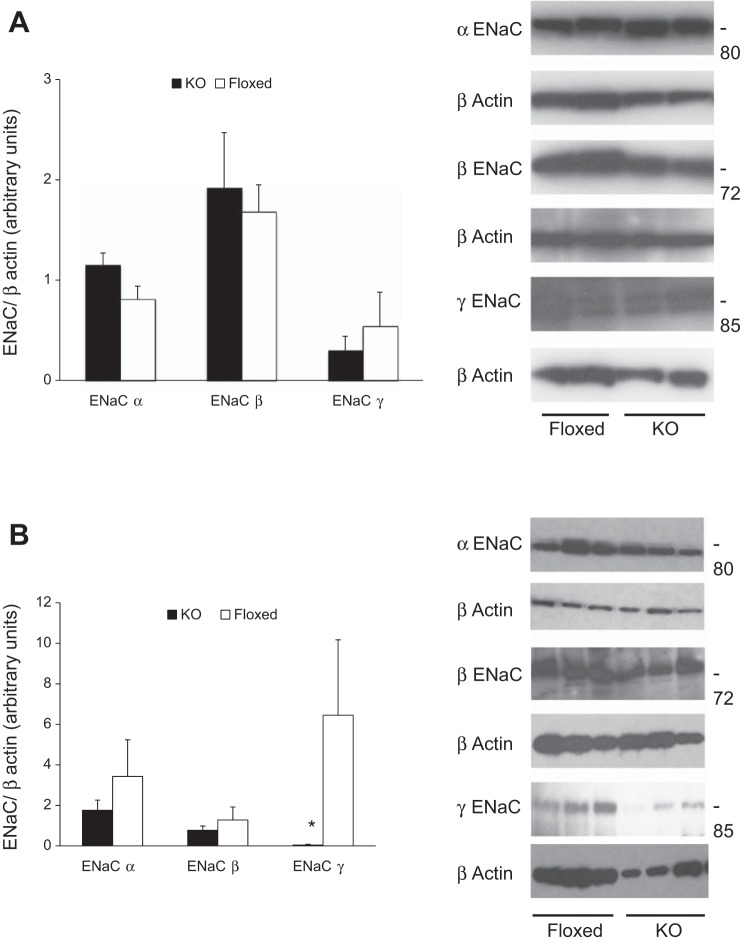
Plasma membrane-enriched ENaC content analyzed by Western blot was similar between KO and floxed mice fed a normal-Na+ diet (Fig. 6A). In contrast, following ANG II infusion, plasma membrane-enriched ENaC γ content was significantly reduced in KO mice; ENaC α and β isoforms tended to be lower in KO mice, although they did not achieve statistical significance (Fig. 6B). Compared with pre-ANG II infusion, ENaC β expression was significantly higher following ANG II infusion in the floxed mice while α and γ isoforms tended to be higher following ANG II infusion. Conversely, KO mice had similar ENaC expression levels both pre and post ANG II infusion.
Fig. 6.
Kidney epithelial sodium channel (ENaC) protein content in CD renin KO and floxed mice on a normal-Na+ diet. A: before ANG II infusion. Left: plasma membrane-enriched ENaC protein levels by densitometry (n = 5 each group). Right: representative Western blots of plasma membrane-enriched ENaC isoform (n = 2 each group). B: following ANG II infusion. Left: plasma membrane-enriched ENaC protein levels by densitometry (n = 5 each group). Right: representative Western blots of plasma membrane-enriched ENaC isoform (n = 3 each group). *P < 0.05 comparing with floxed mice.
DISCUSSION
The current study was designed in part to examine for the first time the role of CD renin in BP regulation under normal physiological conditions. No detectable differences in BP were noted between floxed and KO mice during normal-, high-, or low-Na+ intakes. Yet, PRC was elevated in KO mice, suggesting that under physiological conditions, absence of CD renin may lead to a compensatory increase in systemic renin levels to potentially alleviate lower arterial pressures due to enhanced renal Na+ excretion. This is only speculative since there were no differences observed in Na+ excretion or ENaC expression between the two groups at any time point. One way to test whether the increase in PRC was a compensatory response would be to block systemic ANG II and see whether there is a greater fall in BP in the KO mice. However, such a study is problematic since ANG II blockade would also potentially impact the effect of the CD renin system. Another possibility is that small differences in urinary Na+ excretion or ENaC expression were missed due to the rather high intrinsic variability in these parameters in mice. Nonetheless, the bottom line is that even if CD renin does regulate renal Na+ excretion or BP under physiologic conditions, its presence does not appear to be critical since compensatory systems seem able to mitigate any BP and Na+-handling effects due to loss of CD renin.
In contrast to normal physiological conditions, chronic ANG II infusion-induced hypertension was significantly attenuated in KO mice compared with controls. Of note, PRC and plasma ANG II levels were comparable in KO and control mice following ANG II infusion, indicating that the differences in BP observed between genotypes were not due to different systemic RAS activity. Importantly, urinary renin levels were lower post-ANG II infusion in KO mice compared with controls. These findings are in agreement with previous studies showing that CD renin expression is markedly upregulated by ANG II infusion (5, 17); this effect of ANG II on CD renin is most likely mediated by AT1 receptor activation (18). The lower BP in KO mice post-ANG II infusion was associated with reduced ENaC expression, and particularly ENaC γ protein expression, suggesting that reduced CD renin may lead to reduced CD ENaC expression compared with ANG II-infused control mice. We did not directly test whether ENaC activity was reduced in CD renin KO mice; such studies would involve examination of ENaC channel number and open probability in split-open cortical CD from CD renin KO and control mice. Nonetheless, previous studies lend credence to the notion that ENaC could be involved in the differential BP responsiveness between CD renin KO and control mice. A recent study showed that chronic ANG II infusion in mice increases ENaC activity and this activity was twice that observed in response to physiological manipulations such as dietary salt restriction (11). Furthermore, chronic ANG II infusion increased plasma membrane-bound ENaC abundance (11). Taken together, the current and previous studies support the idea that CD-derived renin is of importance in BP regulation during nonphysiological elevations in ANG II and that this effect may be due to CD renin augmentation of ENaC activity.
The mechanisms by which CD renin might modulate BP have not been definitely identified; however, at least two potential mechanisms could be involved. At the outset, it is important to note that CD-derived renin may be primarily secreted into the tubule lumen (9), hence it is most pertinent to consider how luminal renin in the CD could modulate CD Na+ reabsorption. One possibility is that CD renin leads to increased AT1 receptor activation. As described earlier, luminal angiotensinogen derived from the proximal tubule could be cleaved by luminal renin in the CD; since abundant angiotensin-converting enzyme is present in the CD luminal membrane, ANG II may be formed locally. It is notable that AT1 receptors are expressed on both the CD apical and basolateral membranes; however, ANG II activation of ENaC is much greater when added to the apical side (13). Since ANG II, via AT1 receptor activation, increases CD renin production, this scenario suggests a positive feedback whereby systemic ANG II, via CD renin, leads to increased CD luminal ANG II, which in turn complements systemic ANG II activation of basolateral CD AT1 receptors by now stimulating luminal AT1 receptors. In this regard, it is relevant to note that ANG II can increase cortical CD pendrin-mediated chloride reabsorption, albeit only basolateral ANG II effects on this system have been assessed (12). The second possibility is that CD renin modulates CD function through an ANG II-independent pathway. Relatively recent studies have localized the prorenin receptor (PRR) to CD intercalated cells (1). In addition, the PRR has been reported to be expressed by inner medullary CD cells, at least in vitro (6). Binding of renin or prorenin to CD cells in vitro, in the absence of angiotensinogen, induces activation of ERK1/2 leading to upregulation of cyclooxygenase 2 and other signaling pathways (4). Thus, the possibility exists that luminal renin or prorenin, via PRR activation, may alter CD solute reabsorption. While this issue was not examined in the current study, it would be interesting to study whether luminal prorenin or renin alters CD ENaC activity. Clearly, a range of additional studies is necessary to clarify how CD renin might affect, via ANG II-dependent and -independent mechanisms, CD ion reabsorption.
CD renin KO mice exhibited CD-specific ablation of renin as demonstrated by marked reduction of renin mRNA in microdissected CCD, papilla, and inner medulla. There were no differences in cortical renin message between floxed and KO mice, most likely due to relatively high amounts of nontargeted juxtaglomerular renin in this region. Medullary renin levels were reduced by ∼60% in the KO mice in contrast to 90% reduction in mRNA levels. This discrepancy may be due to the contribution of systemic renin within the vasculature of the medulla. Notably, KO mice had lower urinary renin excretion compared with control mice on normal-Na+ diet, suggesting that, at least under these conditions, urinary renin partly originates in the CD. The possibility exists that urinary renin derives from both the nephron and from the systemic circulation. While some studies have observed low-level renin mRNA in the proximal tubule (24, 25), it is unlikely to contribute to urinary renin levels since renin protein levels have not been detected in the proximal tubule (14), even under conditions in which CD renin is markedly induced by ANG II or diabetes (7, 17). Our study does not directly address this possibility since only the CD was targeted; whole nephron renin gene disruption would be needed to examine this issue. Resolution of this question is important since it has obvious implications with regard to the relative roles of systemic and nephron-derived renin in modulation of nephron function. Another potentially important issue is whether CD renin is secreted as active renin/prorenin or inactivated prorenin, which was not directly examined in the current study. As prorenin synthesis is upregulated in diabetes (7), it is possible that the molecular form of CD renin may be different under physiological and pathophysiological states.
In summary, the current study identifies, for the first time, the role of CD renin in BP regulation both under physiological conditions and during pathophysiological elevations in ANG II levels. These data show that the CD renin system may be of fundamental importance in mediating high ANG II-induced elevations in BP and that this is associated with alterations in ENaC activity. Key remaining questions include the mechanisms by which CD renin modulates ion transport on the CD, including whether ANG II-dependent or -independent pathways are involved.
GRANTS
The research in this study was supported by research grants from the National Institutes of Health (NIH) to C. D. Sigmund (HL048058 and HL084207), by an American Society of Nephrology Fellowship Grant to N. Ramkumar, and by NIH Grant R01 HL093457 to D. E. Kohan.
DISCLOSURES
No conflicts of interest, financial or otherwise, are declared by the author(s).
AUTHOR CONTRIBUTIONS
Author contributions: N.R., C.D.S., and D.E.K. conception and design of research; N.R., D.S., S.R., and A.N.V.H. performed experiments; N.R. and D.E.K. analyzed data; N.R. and D.E.K. interpreted results of experiments; N.R. and D.E.K. prepared figures; N.R. and D.E.K. drafted manuscript; N.R., C.D.S., and D.E.K. edited and revised manuscript; N.R., D.S., S.R., A.N.V.H., C.D.S., and D.E.K. approved final version of manuscript.
ACKNOWLEDGMENTS
We thank Di Xu and the Transgenic Mouse Facility at the University of Iowa for contributing to the generation of the conditional renin allele used herein.
REFERENCES
- 1.Advani A, Kelly DJ, Cox AJ, White KE, Advani SL, Thai K, Connelly KA, Yuen D, Trogadis J, Herzenberg AM, Kuliszewski MA, Leong-Poi H, Gilbert RE. The (Pro)renin receptor: site-specific and functional linkage to the vacuolar H+-ATPase in the kidney. Hypertension 54: 261–269, 2009 [DOI] [PubMed] [Google Scholar]
- 2.Ahn D, Ge Y, Stricklett PK, Gill P, Taylor D, Hughes AK, Yanagisawa M, Miller L, Nelson RD, Kohan DE. Collecting duct-specific knockout of endothelin-1 causes hypertension and sodium retention. J Clin Invest 114: 504–511, 2004 [DOI] [PMC free article] [PubMed] [Google Scholar]
- 3.Davisson RL, Kim HS, Krege JH, Lager DJ, Smithies O, Sigmund CD. Complementation of reduced survival, hypotension, and renal abnormalities in angiotensinogen-deficient mice by the human renin and human angiotensinogen genes. J Clin Invest 99: 1258–1264, 1997 [DOI] [PMC free article] [PubMed] [Google Scholar]
- 4.Gonzalez AA, Luffman C, Bourgeois CR, Vio CP, Prieto MC. Angiotensin II-independent upregulation of cyclooxygenase-2 by activation of the (Pro)renin receptor in rat renal inner medullary cells. Hypertension 61: 443–449, 2013 [DOI] [PMC free article] [PubMed] [Google Scholar]
- 5.Gonzalez-Villalobos RA, Satou R, Ohashi N, Semprun-Prieto LC, Katsurada A, Kim C, Upchurch GM, Prieto MC, Kobori H, Navar LG. Intrarenal mouse renin-angiotensin system during ANG II-induced hypertension and ACE inhibition. Am J Physiol Renal Physiol 298: F150–F157, 2010 [DOI] [PMC free article] [PubMed] [Google Scholar]
- 6.Huang J, Siragy HM. Sodium depletion enhances renal expression of (pro)renin receptor via cyclic GMP-protein kinase G signaling pathway. Hypertension 59: 317–323, 2012 [DOI] [PMC free article] [PubMed] [Google Scholar]
- 7.Kang JJ, Toma I, Sipos A, Meer EJ, Vargas SL, Peti-Peterdi J. The collecting duct is the major source of prorenin in diabetes. Hypertension 51: 1597–1604, 2008 [DOI] [PMC free article] [PubMed] [Google Scholar]
- 8.Kittikulsuth W, Stuart D, Van Hoek AN, Stockand JD, Bugaj V, Mironova E, Blount MA, Kohan DE. Lack of an effect of collecting duct-specific deletion of adenylyl cyclase 3 on renal Na+ and water excretion or arterial pressure. Am J Physiol Renal Physiol 306: F597–F607, 2014 [DOI] [PMC free article] [PubMed] [Google Scholar]
- 9.Liu L, Gonzalez AA, McCormack M, Seth DM, Kobori H, Navar LG, Prieto MC. Increased renin excretion is associated with augmented urinary angiotensin II levels in chronic angiotensin II-infused hypertensive rats. Am J Physiol Renal Physiol 301: F1195–F1201, 2011 [DOI] [PMC free article] [PubMed] [Google Scholar]
- 10.Mamenko M, Zaika O, Ilatovskaya DV, Staruschenko A, Pochynyuk O. Angiotensin II increases activity of the epithelial Na+ channel (ENaC) in distal nephron additively to aldosterone. J Biol Chem 287: 660–671, 2012 [DOI] [PMC free article] [PubMed] [Google Scholar]
- 11.Mamenko M, Zaika O, Prieto MC, Jensen VB, Doris PA, Navar LG, Pochynyuk O. Chronic angiotensin II infusion drives extensive aldosterone-independent epithelial Na+ channel activation. Hypertension 62: 1111–1122, 2013 [DOI] [PMC free article] [PubMed] [Google Scholar]
- 12.Pech V, Kim YH, Weinstein AM, Everett LA, Pham TD, Wall SM. Angiotensin II increases chloride absorption in the cortical collecting duct in mice through a pendrin-dependent mechanism. Am J Physiol Renal Physiol 292: F914–F920, 2007 [DOI] [PubMed] [Google Scholar]
- 13.Peti-Peterdi J, Warnock DG, Bell PD. Angiotensin II directly stimulates ENaC activity in the cortical collecting duct via AT1 receptors. J Am Soc Nephrol 13: 1131–1135, 2002 [DOI] [PubMed] [Google Scholar]
- 14.Pohl M, Kaminski H, Castrop H, Bader M, Himmerkus N, Bleich M, Bachmann S, Theilig F. Intrarenal renin angiotensin system revisited: role of megalin-dependent endocytosis along the proximal nephron. J Biol Chem 285: 41935–41946, 2010 [DOI] [PMC free article] [PubMed] [Google Scholar]
- 15.Prieto MC, Williams DE, Liu L, Kavanagh KL, Mullins JJ, Mitchell KD. Enhancement of renin and prorenin receptor in collecting duct of Cyp1a1-Ren2 rats may contribute to development and progression of malignant hypertension. Am J Physiol Renal Physiol 300: F581–F588, 2011 [DOI] [PMC free article] [PubMed] [Google Scholar]
- 16.Prieto-Carrasquero MC, Botros FT, Pagan J, Kobori H, Seth DM, Casarini DE, Navar LG. Collecting duct renin is upregulated in both kidneys of 2-kidney, 1-clip goldblatt hypertensive rats. Hypertension 51: 1590–1596, 2008 [DOI] [PMC free article] [PubMed] [Google Scholar]
- 17.Prieto-Carrasquero MC, Harrison-Bernard LM, Kobori H, Ozawa Y, Hering-Smith KS, Hamm LL, Navar LG. Enhancement of collecting duct renin in angiotensin II-dependent hypertensive rats. Hypertension 44: 223–229, 2004 [DOI] [PMC free article] [PubMed] [Google Scholar]
- 18.Prieto-Carrasquero MC, Kobori H, Ozawa Y, Gutierrez A, Seth D, Navar LG. AT1 receptor-mediated enhancement of collecting duct renin in angiotensin II-dependent hypertensive rats. Am J Physiol Renal Physiol 289: F632–F637, 2005 [DOI] [PMC free article] [PubMed] [Google Scholar]
- 19.Ramkumar N, Ying J, Stuart D, Kohan DE. Overexpression of Renin in the collecting duct causes elevated blood pressure. Am J Hypertens 26: 965–972, 2013 [DOI] [PubMed] [Google Scholar]
- 20.Rohrwasser A, Ishigami T, Gociman B, Lantelme P, Morgan T, Cheng T, Hillas E, Zhang S, Ward K, Bloch-Faure M, Meneton P, Lalouel JM. Renin and kallikrein in connecting tubule of mouse. Kidney Int 64: 2155–2162, 2003 [DOI] [PubMed] [Google Scholar]
- 21.Rohrwasser A, Morgan T, Dillon HF, Zhao L, Callaway CW, Hillas E, Zhang S, Cheng T, Inagami T, Ward K, Terreros DA, Lalouel JM. Elements of a paracrine tubular renin-angiotensin system along the entire nephron. Hypertension 34: 1265–1274, 1999 [DOI] [PubMed] [Google Scholar]
- 22.Roos KP, Strait KA, Raphael KL, Blount MA, Kohan DE. Collecting duct-specific knockout of adenylyl cyclase type VI causes a urinary concentration defect in mice. Am J Physiol Renal Physiol 302: F78–F84, 2012 [DOI] [PMC free article] [PubMed] [Google Scholar]
- 23.Stegbauer J, Gurley SB, Sparks MA, Woznowski M, Kohan DE, Yan M, Lehrich RW, Coffman TM. AT1 receptors in the collecting duct directly modulate the concentration of urine. J Am Soc Nephrol 22: 2237–2246, 2011 [DOI] [PMC free article] [PubMed] [Google Scholar]
- 24.Taugner R, Hackenthal E, Inagami T, Nobiling R, Poulsen K. Vascular and tubular renin in the kidneys of mice. Histochemistry 75: 473–484, 1982 [DOI] [PubMed] [Google Scholar]
- 25.Taugner R, Hackenthal E, Rix E, Nobiling R, Poulsen K. Immunocytochemistry of the renin-angiotensin system: renin, angiotensinogen, angiotensin I, angiotensin II, and converting enzyme in the kidneys of mice, rats, and tree shrews. Kidney Int Suppl 12: S33–S43, 1982 [PubMed] [Google Scholar]
- 26.Xu D, Borges GR, Grobe JL, Pelham CJ, Yang B, Sigmund CD. Preservation of intracellular renin expression is insufficient to compensate for genetic loss of secreted renin. Hypertension 54: 1240–1247, 2009 [DOI] [PMC free article] [PubMed] [Google Scholar]


