Abstract
Instability of the inner mitochondrial membrane potential (ΔΨm) has been implicated in electrical dysfunction, including arrhythmogenesis during ischemia-reperfusion. Monitoring ΔΨm has led to conflicting results, where depolarization has been reported as sporadic and as a propagating wave. The present study was designed to resolve the aforementioned difference and determine the unknown relationship between ΔΨm and electrophysiology. We developed a novel imaging modality for simultaneous optical mapping of ΔΨm and transmembrane potential (Vm). Optical mapping was performed using potentiometric dyes on preparations from 4 mouse hearts, 14 rabbit hearts, and 7 human hearts. Our data showed that during ischemia, ΔΨm depolarization is sporadic and changes asynchronously with electrophysiological changes. Spatially, ΔΨm depolarization was associated with action potential duration shortening but not conduction slowing. Analysis of focal activity indicated that ΔΨm is not different within the myocardium where the focus originates compared with normal ventricular tissue. Overall, our data suggest that during ischemia, mitochondria maintain their function at the expense of sarcolemmal electrophysiology, but ΔΨm depolarization does not have a direct association to ischemia-induced arrhythmias.
Keywords: ischemia, imaging, metabolism, arrhythmia
mitochondria are well recognized for their roles in both energy production and cell death and have recently been implicated as mediators of ventricular arrhythmias (1–3, 6–8, 35). A critical parameter of mitochondrial function is the tightly regulated inner mitochondrial membrane potential (ΔΨm). Stable ΔΨm is necessary for mitochondrial function, whereas hyperpolarization or depolarization through excessive movement of ions (i.e., Ca2+, ROS, and H+) across the mitochondrial membranes is indicative of a pathophysiological state. Stabilization of ΔΨm has been shown to mitigate ventricular arrhythmias (1, 5), reduce apoptosis and necrosis (17, 18, 30), and protect against ischemic heart failure (22).
Ischemia involves complex changes across metabolic and electrophysiological systems. The lack of O2 during ischemia causes metabolic pathways to switch from oxidative phosphorylation to glycolysis for ATP production. To maintain ΔΨm, ATPase synthase reverses direction, consuming dwindling cytosolic ATP and competing with ionic pumps and contractile proteins for energy (32, 40). With increased cytosolic ADP, sarcolemmal ATP-sensitive K+ (KATP) channels have a greater probability of being open and produce an outward K+ current (33). This leads to action potential (AP) duration (APD) shortening and depolarization of the resting membrane potential, which results in a reduction in excitability and conduction block (16).
Measuring ΔΨm in the intact myocardium is not trivial and has yielded conflicting results across different methodologies. Several groups have monitored ΔΨm using either wide-field optical mapping (21, 26, 38) or microscopy, including two-photon laser-scanning microscopy (13, 23, 28, 37) and confocal microscopy (38). Wide-field optical mapping studies of rat hearts have characterized ΔΨm depolarization as prompt (<1 min) and spatially spreading as an actively propagating unidirectional wave (21, 26), whereas two-photon laser-scanning and confocal microscopy has shown delayed [i.e., >15 min (28), >50 min (23), 10–20 min (37), 27–69 min (38)] depolarization that is sporadic within clusters of cells (13, 28, 37). The collapse of ΔΨm has been thought to contribute to arrhythmogenic substrates during metabolic stress (1, 42); however, the relationship between ΔΨm depolarization and electrophysiological changes in the intact heart is unknown.
In this report, we present a novel method for simultaneous optical imaging of sarcolemmal transmembrane potential (Vm) and ΔΨm. We monitored these parameters in mouse, rabbit, and human preparations to determine the relation between ΔΨm and electrophysiology during ischemia. Our data indicate that ischemia-associated cardiac contracture induces artifacts in ΔΨm, but when contracture is avoided, ΔΨm depolarization is sporadic, reversible, and asynchronous with electrophysiological changes. We assessed the spatial association between ΔΨm depolarization and electrophysiological changes to determine the role that ΔΨm plays in arrhythmia substrate development. Finally, we quantified ΔΨm during ischemia-induced focal arrhythmias to establish if mitochondrial function differs in the focal origin compared with the remaining myocardium.
METHODS
Optical Mapping
An automated dual-camera imaging system was designed for simultaneous optical mapping of ΔΨm and Vm. Optical mapping was performed with two orthogonal MiCAM ULTIMA-L CMOS cameras (SciMedia, Costa Mesa, CA), which have high spatial (100 × 100 pixels, 300 μm/pixel) and temporal (500 frame/s) resolution. A dichroic mirror (635-nm cutoff, Omega Optical, Brattleboro, VT) separated fluorescence signals between cameras. RH-237 (500 nmol/l, Life Technologies, Grand Island, NY) provided fluorescence signals for Vm, whereas tetramethylrhodamine methyl ester (TMRM; 150 nmol/l; Life Technologies) provided fluorescence signals for ΔΨm (FΔΨm). Once administered, both dyes were continuously perfused. FΔΨm was band-pass filtered (590 ± 10 or ± 25 nm, Thorlabs, Newtown, NJ), and Vm was long-pass filtered (>700 nm; Thorlabs). A single light emitting diode (LED; 520 ± 5 nm, Prizmatix, Southfield, MI) provided excitation light, and a programmable controller (CompactRio, National Instruments, Austin, TX) was used for precise temporal triggering of the LED and cameras. The excitation-contraction uncoupler blebbistatin (5–10 μmol/l, Caymen Chemical, Ann Arbor, MI) was added to the perfusate to minimize motion-induced artifacts.
Tissue Preparation
The present study was approved by the Institutional Review Board of Washington University School of Medicine. Human subjects gave informed consent. Donated hearts were provided by Barnes-Jewish Hospital and Mid-America Transplant Services (S. Louis, MO). The Institutional Animal Studies Care and Use Committee of Washington University approved the animal protocols of this study, which involved C57BL/6J mice (n = 4) and New Zealand White rabbits (n = 14, 4–5 mo old, 3–4 kg).
Mice were anesthetized with a ketamine-xylazine cocktail (ketamine: 80 mg/kg body wt and xylazine: 10 mg/kg body wt) and heparinized (100 units) by intraperitoneal injection. Rabbits were anesthetized intravenously with a cocktail made of pentobarbital sodium (80 mg/kg body wt) and 1,000 units of heparin. Hearts were removed after a midsternal incision. As previously reported (15, 25), explanted human hearts (n = 7) were arrested with cardioplegic solution [containing (in mmol/l) 10 NaCl, 1.2 CaCl2, 16 KCl, 16 MgCl2, and 10 NaHCO3] in the operating room and were maintained at 4–7°C during a 15-min transportation period to the research laboratory. Donated hearts were then dissected into left ventricular (LV) wedge preparations.
Both heart and wedge preparations were perfused via coronary arteries and superfused with warmed (37°C), oxygenated (95% O2-5% CO2) Tyrode solution [containing (in mmol/l) 128.2 NaCl, 1.3 CaCl2, 4.7 KCl, 1.05 MgCl2, 1.19 NaH2PO4, 20 NaHCO3, and 11.1 d-glucose]. Tissue was perfused under constant pressure (70–90 mmHg), and a far-field ECG was recorded (PowerLab 26T, AD Instruments, Colorado Springs, CO) throughout experimentation. Mouse, rabbit, and human tissues were continuously paced at cycle lengths of 120, 250, and 1,000 ms, respectively, for the duration of the experiment.
Experimental Protocols
We applied one of following four experimental protocols.
Protocol 1.
The fluorescence stability of TMRM was tested on mouse hearts (n = 4) to ensure that fluorescence changes did not occur from extraneous factors such as photobleaching.
Protocol 2.
Targeted depolarization of ΔΨm was accomplished by adding FCCP (2.5 μmol/l, Sigma-Aldrich, St. Louis, MO), a known proton ionophore that dissipates ΔΨm, to the perfusate (n = 5 rabbit hearts).
Protocol 3.
Low-flow ischemia was induced for 90 min by reducing perfusion pressure to 15% of baseline (n = 8 rabbit hearts and n = 7 LV wedges). N2 was bubbled into the superfusion to prevent O2 reaching the epicardial surface during ischemia. After 45 min of low-flow ischemia, a bolus of FCCP (100 μmol/l) was administered to collapse any remaining ΔΨm. In a subset of rabbit experiments (4 of 8 experiments), the pulmonary artery was cannulated to control perfusate removal from the right ventricle (RV), which helps to maintain the volume of fluid in the RV and the shape of the heart. In human wedge preparations, Vm imaging was performed on all preparations (n = 7), whereas dual ΔΨm-Vm imaging was performed on three of seven preparations.
Protocol 4.
No-flow ischemia (30 min) followed by reperfusion was implemented in a single rabbit preparation (n = 1).
Data Analysis
Signal processing.
Vm signals were processed using freely available MATLAB software (24). Vm signals were spatially binned (3 × 3 pixels), filtered (0- to 100-Hz finite impulse response filter), and normalized. Activation times were defined at dVm/dtmax, and APD values were calculated as the time from activation to 70% of repolarization (APD70). FΔΨm signals were spatially binned (3 × 3 pixels) and baseline corrected. FΔΨm was normalized from steady-state fluorescence attained just before the administration of FCCP (protocol 2) or low-flow ischemia (protocol 3) to fluorescence after 45 min of FCCP addition. After circulation of FCCP for 45 min, FΔΨm was assumed to be at its minimum value (4, 14).
Spatial analysis.
Changes in heart shape were quantified by determining the percent change in pixels over the preparation throughout the experimental protocols. To increase the sample size of protocol 4 and to measure the percent change during no-flow ischemia, the perfusion pump was turned off after the completion of protocol 3 (5 of 8 rabbit preparations). Spatial heterogeneity in FΔΨm was calculated on ∼40 × 40-pixel regions by taking the magnitude of the spatial gradient or |d(FΔΨm)/dx + d(FΔΨm)/dy|. The spatial heterogeneity in FΔΨm was compared between ischemia and FCCP administration. The spatial correlation between changes in FΔΨm and optical AP (OAP) parameters was also calculated on ∼40 × 40-pixel regions. The percent change in OAP parameters (abscissa) and FΔΨm (ordinate) during ischemia were plotted, and the Pearson product-moment correlation coefficient (r) was calculated for 1,600 points (protocol 3, n = 4 rabbit hearts).
Arrhythmia analysis.
Sustained arrhythmias (focal and reentrant) were considered those lasting longer than 30 s and were confirmed both optically and with the ECG. The focal origin was defined as the area of the epicardium activating in the 0 to 0.05 quantile (approximately earliest 5 ms), whereas the epicardium activating in the 0.75 to 1.0 quantile was defined as late activating. During focal activity, FΔΨm was calculated in the focal origin, late-activated region, and across the entire epicardial surface.
Statistical Analysis
All data are expressed as means ± SE. P values of <0.05 were considered significant. Statistically significant differences were identified using a Student's t-test or one-way ANOVA. A post hoc Tukey test was performed if ANOVA was significant.
RESULTS
Signal Artifacts: Alterations in Heart Shape
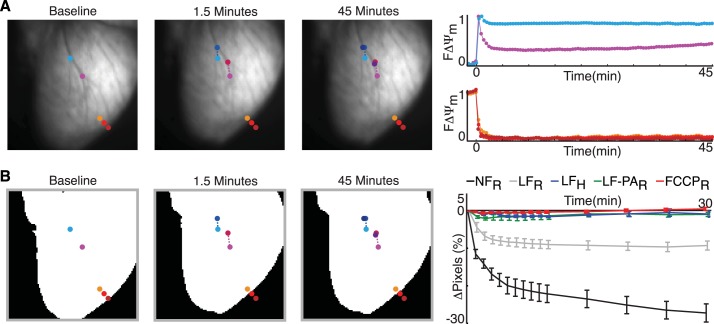
Figure 1 shows a typical example of a rabbit heart during low-flow ischemia. As shown in Fig. 1A, left, at baseline, teal and pink circles emphasize coronary branches, whereas the orange, red, and crimson circles emphasize the edge of the heart. At 1.5 min, low-flow ischemia caused the heart to subtly drift and shrink in size. This led to the coronary branches moving vertically in the optical field of view, which are labeled as blue and magenta circles (Fig. 1A, left). Note that the red and crimson circles are completely off the tissue, whereas the orange circle is located on the curved edge of the heart (Fig. 1A, left). Minimal additional tissue deformation occurred beyond 1.5 min.
Fig. 1.
Signal artifacts in inner mitochondrial membrane potential (ΔΨm) fluorescence (FΔΨm). A, left: images of an explanted rabbit heart at baseline and at 1.5 and 45 min of low-flow ischemia. The teal, blue, and navy circles as well as pink, magenta, and purple circles highlight the movement of coronary branches. The orange, red, and crimson circles emphasize the change in ventricular shape. Right, FΔΨm signals from teal and pink circles (top) and edge circles (bottom). B: binary representation of hearts (left), which was used to quantify imaged surface area (right). Shown is a plot of the percent change in the imaged surface area in rabbit (R) and human (H) preparations during no-flow ischemia (NFR, n = 6), low-flow ischemia (LFR, n = 4; LFH, n = 3), low-flow ischemia with pulmonary artery cannulation (LF-PAR, n = 4), and administration of FCCPR (n = 5). Data are expressed as means ± SE.
The drifting and shrinking of tissue is reflected in the optical signals (Fig. 1A, right). The interior pixels (i.e., at the coronary branches) continuously collected data from different heart locations, and, in this case, there was an artificial increase in fluorescence. Pixels near the edge of the tissue rapidly decreased fluorescence because they were no longer focused on the tissue. Such shrinking created an appearance of a propagating wave of mitochondrial depolarization near the edge of the heart. The amount of tissue contracture was quantified from binary images during each protocol (Fig. 1B). When the perfusate flow out of the RV was controlled in rabbit hearts during low-flow ischemia (green vs. gray; Fig. 1B), heart shape was maintained and artifacts in the optical signal were minimized. Supplemental Movie SI in the Supplemental Material further shows the extensive shrinking of a rabbit heart during no-flow ischemia, which made it impossible to monitor FΔΨm.1 In the subsequent sections, only preparations that maintained their shape (green, blue, and red; Fig. 1B) are discussed.
Sporadic FΔΨm Depolarization
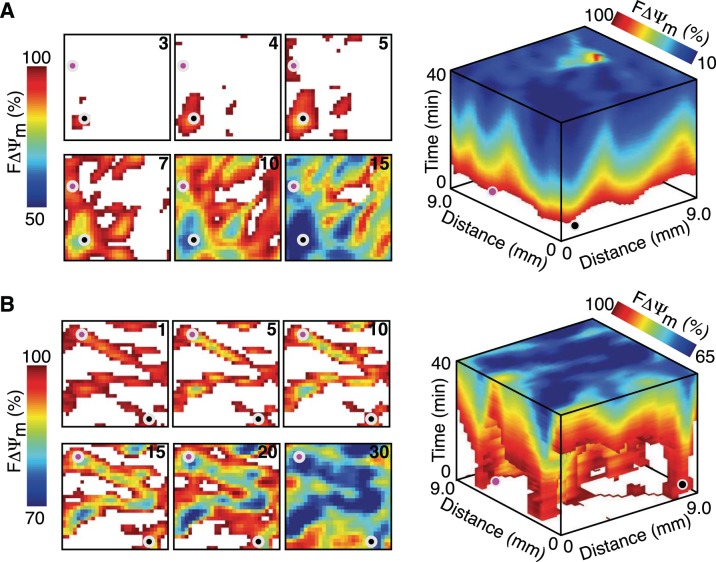
Figure 2 shows that during the administration of FCCP (A) and low-flow ischemia (B), the reduction in FΔΨm is sporadic and doesn't propagate as a unidirectional wave. After 3 min of FCCP administration, only the small area near the black circle had reduced FΔΨm. This area expanded over the next 2 min, and the region near the pink circle showed a reduction in FΔΨm. These areas, as well as others that showed an early reduction in FΔΨm, continued to expand until the entire epicardial surface had reduced FΔΨm. Low-flow ischemia showed a different spatial pattern, where after the first minute nearly half the 9 × 9-mm region showed reduced FΔΨm. These regions did not expand over the next 10 min but instead slightly shrank in area and showed a decrease in FΔΨm. After 15 min, FΔΨm expanded from these early reduced regions to occupy the entire surface.
Fig. 2.
Sporadic depolarization of FΔΨm during FCCP administration and low-flow ischemia. A: spatial changes in FΔΨm during FCCP administration. B: spatial changes in FΔΨm during low-flow ischemia. In A and B, a 9 × 9-mm region is shown at six time points (left) as well as a 40-min stacked time series (right). The time after FCCP administration and low-flow ischemia is shown in the top right corner (in min). The pink and black circles highlight areas with an early reduction in FΔΨm and provide orientation between two- and three-dimensional displays. Areas with increased FΔΨm are masked (white) to enhance the visualization of areas with decreased FΔΨm.
Dye Stability and Targeted ΔΨm Depolarization
The stability of FΔΨm (Fig. 3, A–C) and targeted ΔΨm depolarization (Fig. 3, D–F) served as positive controls. The stability of FΔΨm was monitored in mouse hearts (n = 4) during the time when a metabolic insult is typically applied (gray region). A representative FΔΨm signal and spatial FΔΨm maps showed similar FΔΨm at the beginning and end of stability testing. Overall, FΔΨm increased from 2,100 ± 315 to 2,200 ± 290 arbitrary units during stability testing but was not significantly different. Administration of the potent ΔΨm uncoupler FCCP (2.5 μmol/l) caused a substantial reduction in FΔΨm. The change in FΔΨm was monitored in rabbit hearts (n = 5), and representative FΔΨm signals and maps are shown in Fig. 3, D and E. FΔΨm maps at 30 s, 15 min, and 30 min showed a near-homogenous change in FΔΨm, which is shown in Fig. 3F.
Fig. 3.
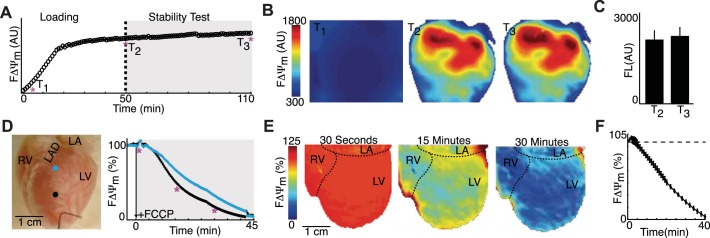
Dye stability test and targeted ΔΨm depolarization. A: representative FΔΨm signals during the dye stability test. B: spatial FΔΨm maps early in dye loading (T1) as well as at the beginning (T2) and end (T3) of stability testing. C: FΔΨm intensity (FL) at T2 and T3 (n = 4 mice). D: representative rabbit heart showing the spatial location of FΔΨm signals (right) during targeted depolarization with FCCP administration. E: FΔΨm maps at 30 s, 15 min, and 30 min after FCCP administration. F: summary (n = 5 rabbits) of epicardial FΔΨm. All data are expressed as means ± SE. AU, arbitrary units; RV, right ventricle; LV, left ventricle; LA, left atrium; LAD, left anterior descending coronary artery.
Low-Flow Ischemia in Rabbit Hearts
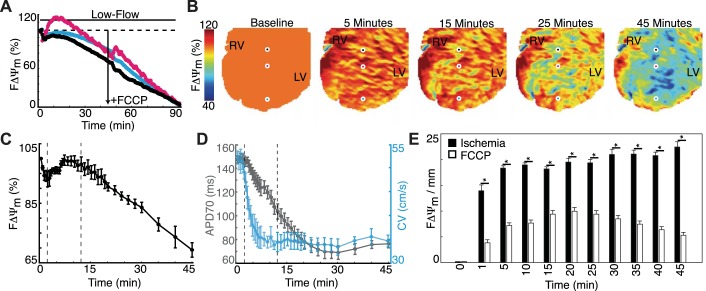
To investigate the relation between ΔΨm and electrophysiology, we applied low-flow ischemia in rabbit hearts (n = 4) and subsequently injected a bolus of FCCP at 45 min to collapse any remaining ΔΨm. Three representative FΔΨm signals (black, teal, and pink) and spatial maps are shown in Fig. 4, A and B. During ischemia, FΔΨm had three phases: 1) FΔΨm decreased for 2 min, 2) FΔΨm increased and stabilized for ∼10 min, 3) FΔΨm decreased for the remainder of ischemia. At 2, 12, and 45 min, FΔΨm was 93.0 ± 2.5%, 98.1 ± 2.4%, and 69.3 ± 2.4%, respectively (Fig. 4C). Plots of APD70 (gray) and conduction velocity (CV; teal) over the same time course are shown in Fig. 4D and demonstrate the asynchrony between electrophysiological and FΔΨm changes. Spatial FΔΨm heterogeneity was found to be significantly greater (P < 0.05) in ischemia (Fig. 4E) compared with targeted depolarization with FCCP (Fig. 3), which emphasizes the large spatial variation in FΔΨm during ischemia.
Fig. 4.
Metabolic and electrophysiological changes during low-flow ischemia in explanted rabbit hearts (n = 4). A: three FΔΨm signals. B: sequential FΔΨm maps throughout the protocol. The black, teal, and pink circles illustrate the spatial location of FΔΨm signals in A. C: summary (n = 4) of the changes in FΔΨm during low-flow ischemia. D: summary (n = 4) of the changes in action potential duration at 70% repolarization (APD70; gray) and conduction velocity (CV; teal). E: spatial FΔΨm heterogeneity during low-flow ischemia versus targeted ΔΨm depolarization (Fig. 3). All data are expressed as means ± SE. *P < 0.05.
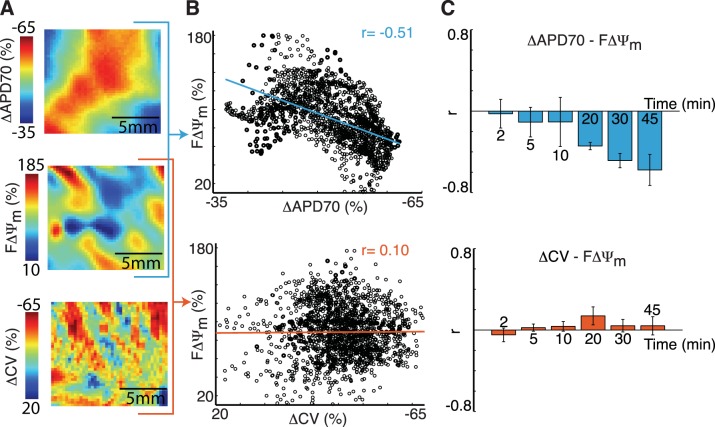
The spatial correlation between FΔΨm and changes in electrophysiological parameters was determined. Figure 5, A and B, shows a representative correlation calculation at 30 min of low-flow ischemia. Electrophysiological maps are shown as changes from baseline (ΔAPD70 and ΔCV), where large APD70 shortening and conduction slowing are shown as red. Blue FΔΨm values identify areas with depolarized mitochondria. When FΔΨm and ΔAPD70 were plotted together (Fig. 5B, top), there was a strong inverse relation; however, when FΔΨm and ΔCV were plotted together (Fig. 5B, bottom), no relation was present. The summary of r values (n = 4; Fig. 5C) showed that FΔΨm-ΔAPD70 had a progressively stronger inverse relation, reaching an r value of −0.58 ± 0.15 at 45 min. Spatial changes in CV were not associated with changes in FΔΨm, and, at 45 min of ischemia, FΔΨm-ΔCV had an r value of 0.04 ± 0.09.
Fig. 5.
Spatial correlation between changes in FΔΨm and optical action potential parameters during low-flow ischemia. A: representative ADP70, FΔΨm, and CV maps at 30 min, where electrophysiological parameters are shown as changes from baseline (ΔAPD70 and ΔCV). B: pixel-by-pixel plot of FΔΨm against ΔAPD70 (top) and FΔΨm against ΔCV (bottom). C: summary (n = 4 rabbits) of r values for FΔΨm-ΔAPD70 (top) and FΔΨm-ΔCV (bottom) at 2, 5, 10, 20, 30, and 45 min. All data are expressed as means ± SE.
Low-Flow Ischemia in Human Wedge Preparations
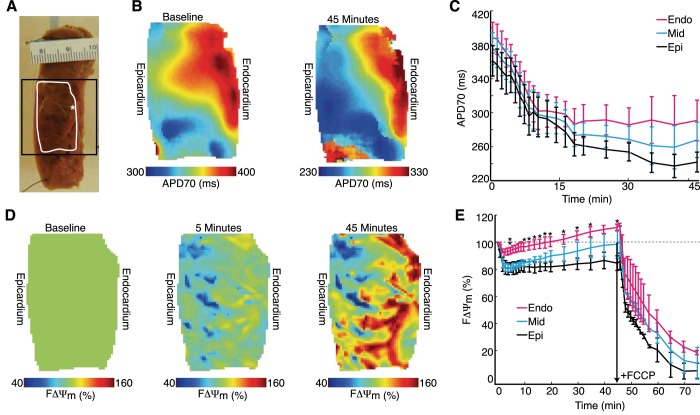
To determine the clinical relevance of our observations in mice and rabbits, we investigated the relation between ΔΨm and electrophysiology in human ventricular preparations. Figure 6A shows a representative LV wedge preparation with the optical field of view (black square) and the location of optical maps (white outline) highlighted. A transmural gradient in APD70 was seen in five of seven preparations at baseline and was maintained in four of five preparations throughout low-flow ischemia (Fig. 6B). Subepicardial, midmyocardial, and subendocardial APD70 changes during ischemia are shown for all preparations (7 of 7 prepartations) in Fig. 6C.
Fig. 6.
Metabolic and electrophysiological changes during low-flow ischemia in human LV wedge preparations. A: representative LV wedge showing the spatial location of the pacing electrode (*), optical maps (white outline), and the field of view (black square) during the optical mapping experiment. B: representative ADP70 maps at baseline and 45 min of ischemia. C: summary (n = 7) of APD70 changes during ischemia. D: FΔΨm maps at baseline and at 5 and 45 min into ischemia. E: summary (n = 3) of subendocardial (Endo), midmyocardial (Mid), and subepicardial (Epi) FΔΨm after the initiation of ischemia. All data are expressed as means ± SE. *P < 0.05, Endo vs. Epi; **P < 0.05, Endo vs. Mid.
The change in FΔΨm was also quantified for the subepicardium, midmyocardium, and subendocardium during low-flow ischemia (n = 3; Fig. 6, D and E). Upon the initiation of low-flow ischemia, all three regions decreased FΔΨm, with the subepicardium, midmyocardium, and subendocardium reaching minimums of 80.5% (at 4 min), 81.3% (at 4 min), and 92.7% (at 3 min), respectively. The midmyocardium and subendocardium exhibited an increase in FΔΨm after reaching their minimum values. Subepicardium FΔΨm was statistically different (P < 0.05) compared with the subendocardium at 10–35 and 45 min, whereas subendocardium FΔΨm was statistically different (P < 0.05) compared with the midmyocardium at 5 min. Thus, as in rabbits, the initial ΔΨm depolarization is reversible, but the extent varies transmurally.
Sustained Ventricular Arrhythmias
After 45 min of FCCP perfusion (protocol 2), 0% of rabbit hearts (0 of 5 hearts) had a sustained arrhythmia, whereas after 45 min of low-flow ischemia (protocol 3), 25% of rabbit hearts (2 of 8 hearts) and 0% of wedge preparations (0 of 7 preparations) had a sustained arrhythmia (Fig. 7A). The combination of low-flow ischemia and bolus injection of FCCP resulted in multiple episodes of sustained arrhythmias in 100% rabbit hearts (6 of 6 hearts) and 100% human preparations (3 of 3 preparations).
Fig. 7.
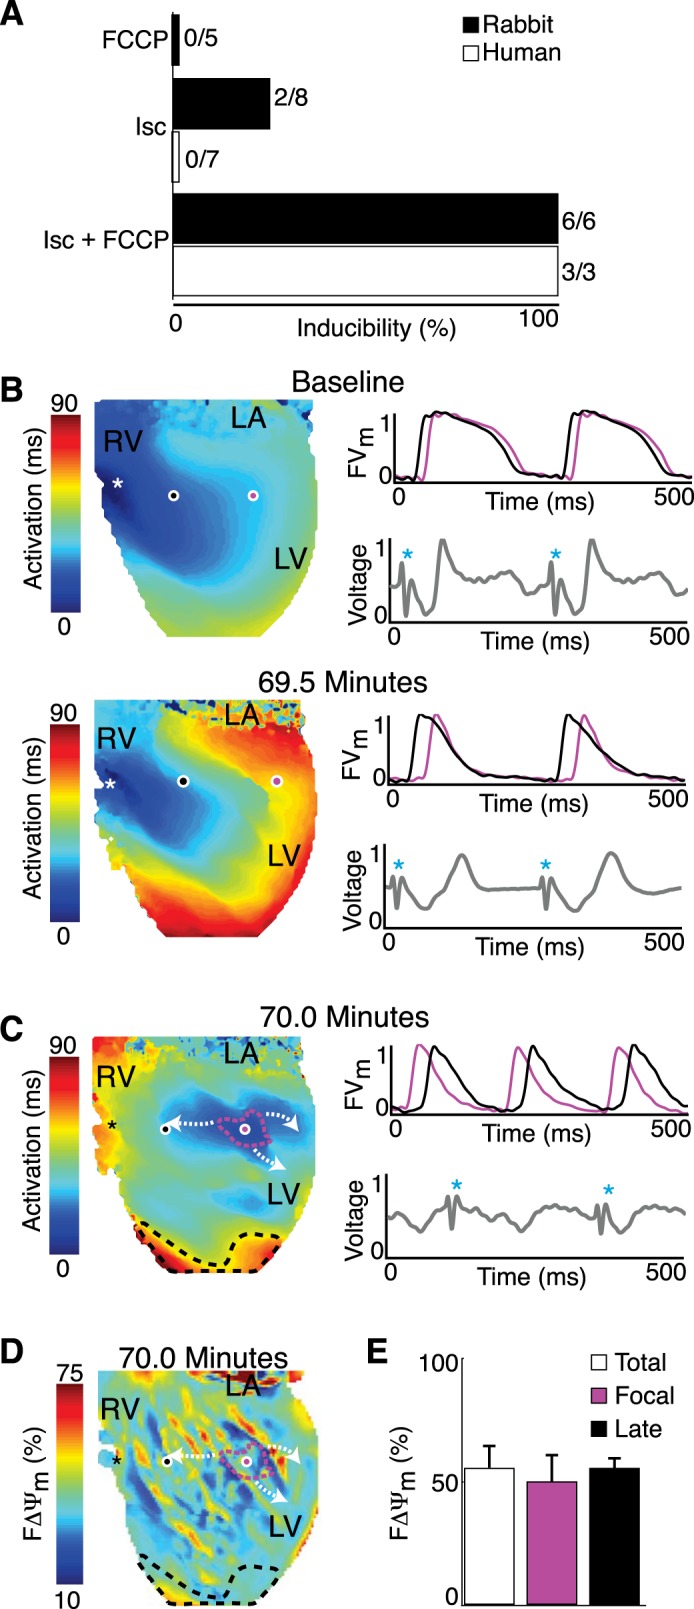
Arrhythmias during metabolic insults. A: arrhythmia inducibility during FCCP administration, low-flow ischemia (Isc), and low-flow ischemia plus FCCP bolus. In B–D, symbols are as follows: white/black asterisks, location of the pacing electrode; black and pink circles, location of optical signals; blue asterisk, stimulus artifact. B: activation map, optical action potentials (black and pink), and far-field ECG (gray) at baseline (top) and 69.5 min into ischemia (bottom). FCCP was added at 45 min. C: activation map during focal activity, where the focal origin (pink) and late-activated region (black) are shown. D: FΔΨm map at 70 min. E: summary (n = 5) of FΔΨm calculated in the focal origin, late-activated region, and across the entire epicardial surface (total). All data are expressed as means ± SE.
Sustained arrhythmias in rabbit hearts included focal activity (n = 11 episodes, Supplement Movie SII), reentry (n = 2 episodes, Supplement Movie SIII), and multiwave reentry (n = 18 episodes, Supplement Movie SIV). Focal activity and reentry are uncommon for human wedge preparations. Reentry is rare because the size of the wedge in relation to the wavelength (APD × CV) usually prevents the occurrence of reentry. Supplementary Movie SV shows an example of a stable (likely reentrant) arrhythmia in a human LV wedge preparation. However, arrhythmias in other wedge preparations could not be categorized because of the limited optical field of view.
A representative example of substrate development for focal activity in a rabbit heart is shown in Fig. 7, B–D. OAPs (black and pink) and far-field ECGs (gray) are shown at baseline and 69.5 min after the initiation of ischemia. The activation maps, OAPs, and far-field ECG emphasize the predictable response to ischemia, i.e., conduction slowing and repolarization shortening. Figure 7, C and D, shows the activation sequence initiated by 5.86-Hz focal activity at 70 min and the corresponding FΔΨm map. The optical signals have reversed order, and the pacing stimulus no longer captures the tissue. The location of a focal origin was in the optical field of view in four of four rabbit hearts with pulmonary artery cannulation. In a single experiment, there were two focal origin sites for different sustained arrhythmias. FΔΨm was quantified (n = 5; Fig. 7E) across the entire epicardium (54.9 ± 8.7%), in the focal origin (49.4 ± 10.6%), and in the late-activating region (54.9 ± 4.6%) and was not significantly different (P = 0.87).
DISCUSSION
Here, we present, for the first time, a dual-imaging methodology for optical mapping of sarcolemmal and mitochondrial membrane potentials. Our data show that 1) ΔΨm depolarization does not propagate as a unidirectional wave, 2) ΔΨm depolarization is sporadic and reversible during ischemia, 3) ΔΨm depolarization is spatially associated with APD shortening late in ischemia but not associated to conduction slowing, and 4) the origin of focal arrhythmias is not related to ΔΨm depolarization. Overall, mitochondrial potential and sarcolemmal electrophysiological properties are asynchronous during ischemia, and no connection between mitochondrial depolarization and arrhythmogenic substrates was found.
Comparison With Previous Reports
Sporadic depolarization during ischemia contradicts previous wide-field optical mapping reports (21, 26) but is in good agreement with previous microscopy studies that imaged multiple myocytes (∼10 myocytes) per experiment. Microscopy studies (23, 28, 37, 38) on intact hearts showed individual myocytes having isolated FΔΨm loss within 10–60 min, whereas neighboring myocytes were unaffected and maintained FΔΨm. In addition to microscopy studies, Berkich and colleagues (4) used a lipophilic isotope to measure ΔΨm in rat hearts and demonstrated that significant depolarization started after 35 min. We observed FΔΨm loss on the majority of the epicardial surface after 12 min of low-flow ischemia and a 30.7% decrease at 45 min (Fig. 4).
Effect of Vm and ΔΨm on FΔΨm
Measurement of fluorescence relies on the Nernstian distribution of lipophilic cations to accumulate inside negatively charged compartments, especially the cytosol and mitochondria. During the progression of ischemia, changes in FΔΨm are not only dependent on ΔΨm depolarization but also depolarization of Vm. Vm depolarizes ∼25 mV during ischemia, which will lead to FΔΨm loss that is not associated with ΔΨm depolarization. Mathematical models (31, 39, 40) have been developed to quantify FΔΨm changes within the mitochondrial matrix, cytosol, and extracellular space and can determine the influence of Vm depolarization on FΔΨm. A 25-mV depolarization of Vm will cause 4.3% FΔΨm loss when ΔΨm is held at −180 mV. Thus, Vm depolarization will have a minimal effect on FΔΨm, especially early in the protocol, when Vm is just beginning to depolarize.
Transmural FΔΨm
Here, we report the first transmural recordings of FΔΨm. The distinct transmural FΔΨm response to low-flow ischemia could be due to functionally different mitochondria or substrate availability (9, 29). Overall, both morphometric and functional studies (27, 36) on mitochondria have shown few differences transmurally; however, the quantity of glycogen and activity of glycogen phosphorylase have been found to be significantly greater in the subendocardium compared with the subepicardium (19, 20). Ichihara and Abiko (19) showed that ligation of a coronary artery leads to subepicardial and subendocardial decreases in glycogen content, but the subendocardium does so more rapidly and markedly. Excess substrate consumption may allow for the subendocardium to maintain FΔΨm and have a greater ability to reverse FΔΨm loss.
FΔΨm and Arrhythmias
Monitoring ΔΨm in conjunction with Vm is advantageous for understanding the role of metabolism in the genesis of arrhythmias. During the ischemia protocol, we observed both focal activity and reentrant arrhythmias. It has been theorized that spatiotemporal heterogeneities in mitochondrial function may be the underlying mechanism for the genesis of ischemia-induced arrhythmias in that they promote arrhythmogenic substrates, including heterogeneous AP repolarization and depressed excitability (1).
During ischemia, we observed large spatial heterogeneities in mitochondrial function within hearts (Fig. 4E) and determined the spatial association between ΔΨm and electrophysiological parameters. Our data indicate that early in ischemia, ΔΨm polarization is not associated with APD shortening but has an increasing inverse association throughout the protocol. The early dissociation reflects mitochondria reversing and maintaining their potential while APs begin to shorten. Mitochondrial ATP synthase can compete for cytosolic ATP to maintain ΔΨm and delay depolarization. The KATP channel is very sensitive to the metabolic state of the cytosol, and opening of <1% of channels can result in significant AP shortening (34). It is important to note that the end of repolarization is not equivalent to the refractory period in ischemic tissue, which has postrepolarization refractoriness (11). Thus, heterogeneous AP repolarization during ischemia is an unreliable predictor of reentrant arrhythmias. Slowing of conduction greatly increases the likelihood of the occurrence of arrhythmias, but our data show that ΔΨm depolarization is not spatially associated with conduction slowing.
Simultaneous monitoring of ΔΨm and Vm allowed for detailed analysis of focal arrhythmias and showed that the focal origin does not have different mitochondrial function compared with the rest of the myocardium. ΔΨm depolarization does not seem to have a direct association with ischemia-induced arrhythmias; however, the metabolic state of the tissue likely plays a role in arrhythmogenesis. Injury current has also been proposed as the source of ectopic activity during ischemia and is the electrotonic flow of current between regions of tissue with large variation in membrane potential (10, 12). Accumulation of regional extracellular K+ is a major cause for differences in membrane potential, and thus KATP channel sensitivity to the cytosolic nucleotide concentration is an important element in producing an injury current.
Limitations
There are several limitations to this study. First, tissue preparations were perfused with the excitation-contraction uncoupler blebbistatin, consequently leaving hearts in an energetically favorable condition. The metabolic demand of different isolated heart models has been previously reported. Using NADH imaging, Wengrowski and colleagues (41) elegantly showed the increase delay in metabolic changes when using biventricular working, Langendorff-perfused, and mechanically arrested models during ischemia. In addition, we used a model of low-flow ischemia instead of no-flow ischemia or regional ischemia by coronary ligation. Venable and colleagues (38) have provided a well-founded argument against the use of wide-field optical mapping of ΔΨm during no-flow ischemia. The pool of fluorophores remains constant with no-flow ischemia and thus requires the imaging technique to resolve dye redistribution between cellular compartments. Moreover, explanted hearts were denervated, leaving sympathetic/parasympathetic tone absent, and differences in cardiac cell populations were not considered. Finally, analysis of focal activity was performed on the epicardial surface, whereas the source could be deeper within the myocardium.
Conclusions
Ischemia involves a complex interplay between metabolic and electrophysiological systems. Mitochondrial depolarization is sporadic, reversible, and asynchronous with sarcolemmal electrophysiological changes. Mitochondrial depolarization is not directly associated with ischemia-induced arrhythmias.
GRANTS
This work was supported by National Heart, Lung, and Blood Institute Grants R21-HL-112278, R01-HL-114395, and R01-HL-115415 (to I. R. Efimov). M. S. Sulkin was supported by an American Heart Association predoctoral fellowship. F. S. Ng was funded by British Heart Foundation Travel Fellowship Grant FS/11/69/29017 and a Clinical Lectureship from the UK National Institute for Health Research.
DISCLOSURES
No conflicts of interest, financial or otherwise, are declared by the author(s).
AUTHOR CONTRIBUTIONS
Author contributions: M.S.S., B.J.B., F.S.N., and I.R.E. conception and design of research; M.S.S., B.J.B., M.T., and S.R.G. performed experiments; M.S.S. and S.R.G. analyzed data; M.S.S., F.S.N., and I.R.E. interpreted results of experiments; M.S.S. and I.R.E. prepared figures; M.S.S. and I.R.E. drafted manuscript; M.S.S., B.J.B., F.S.N., and I.R.E. edited and revised manuscript; M.S.S., B.J.B., M.T., S.R.G., F.S.N., and I.R.E. approved final version of manuscript.
Supplementary Material
Footnotes
Supplemental Material for this article is available at the American Journal of Physiology-Heart and Circulatory Physiology website.
REFERENCES
- 1.Akar FG, Aon MA, Tomaselli GF, O'Rourke B. The mitochondrial origin of postischemic arrhythmias. J Clin Invest 115: 3527–3535, 2005. [DOI] [PMC free article] [PubMed] [Google Scholar]
- 2.Akar FG, O'Rourke B. Mitochondria are sources of metabolic sink and arrhythmias. Pharmacol Ther 131: 287–294, 2011. [DOI] [PMC free article] [PubMed] [Google Scholar]
- 3.Aon MA, Cortassa S, Akar FG, Brown DA, Zhou L, O'Rourke B. From mitochondrial dynamics to arrhythmias. Int J Biochem Cell Biol 41: 1940–1948, 2009. [DOI] [PMC free article] [PubMed] [Google Scholar]
- 4.Berkich DA, Salama G, LaNoue KF. Mitochondrial membrane potentials in ischemic hearts. Arch Biochem Biophys 420: 279–286, 2003. [DOI] [PubMed] [Google Scholar]
- 5.Brown DA, Aon MA, Akar FG, Liu T, Sorarrain N, O'Rourke B. Effects of 4′-chlorodiazepam on cellular excitation-contraction coupling and ischaemia-reperfusion injury in rabbit heart. Cardiovasc Res 79: 141–149, 2008. [DOI] [PMC free article] [PubMed] [Google Scholar]
- 6.Brown DA, Aon MA, Frasier CR, Sloan RC, Maloney AH, Anderson EJ, O'Rourke B. Cardiac arrhythmias induced by glutathione oxidation can be inhibited by preventing mitochondrial depolarization. J Mol Cell Cardiol 48: 673–679, 2010. [DOI] [PMC free article] [PubMed] [Google Scholar]
- 7.Brown DA, Moukdar F. Are post-operative arrhythmias in patients with metabolic syndrome a sign of dysfunctional mitochondria? J Am Coll Cardiol 62: 1474–1475, 2013. [DOI] [PubMed] [Google Scholar]
- 8.Brown DA, O'Rourke B. Cardiac mitochondria and arrhythmias. Cardiovasc Res 88: 241–249, 2010. [DOI] [PMC free article] [PubMed] [Google Scholar]
- 9.Carabello BA. Understanding coronary blood flow: the wave of the future. Circulation 113: 1721–1722, 2006. [DOI] [PubMed] [Google Scholar]
- 10.Coronel R, Fiolet JW, Wilms-Schopman FJ, Schaapherder AF, Johnson TA, Gettes LS, Janse MJ. Distribution of extracellular potassium and its relation to electrophysiologic changes during acute myocardial ischemia in the isolated perfused porcine heart. Circulation 77: 1125–1138, 1988. [DOI] [PubMed] [Google Scholar]
- 11.Coronel R, Janse MJ, Opthof T, Wilde AA, Taggart P. Postrepolarization refractoriness in acute ischemia and after antiarrhythmic drug administration: action potential duration is not always an index of the refractory period. Heart Rhythm 9: 977–982, 2012. [DOI] [PubMed] [Google Scholar]
- 12.Coronel R, Wilms-Schopman FJ, Opthof T, van Capelle FJ, Janse MJ. Injury current and gradients of diastolic stimulation threshold, TQ potential, and extracellular potassium concentration during acute regional ischemia in the isolated perfused pig heart. Circ Res 68: 1241–1249, 1991. [DOI] [PubMed] [Google Scholar]
- 13.Davidson SM, Yellon DM, Murphy MP, Duchen MR. Slow calcium waves and redox changes precede mitochondrial permeability transition pore opening in the intact heart during hypoxia and reoxygenation. Cardiovasc Res 93: 445–453, 2012. [DOI] [PubMed] [Google Scholar]
- 14.Dedkova EN, Blatter LA. Measuring mitochondrial function in intact cardiac myocytes. J Mol Cell Cardiol 52: 48–61, 2012. [DOI] [PMC free article] [PubMed] [Google Scholar]
- 15.Glukhov AV, Fedorov VV, Kalish PW, Ravikumar VK, Lou Q, Janks D, Schuessler RB, Moazami N, Efimov IR. Conduction remodeling in human end-stage nonischemic left ventricular cardiomyopathy. Circulation 125: 1835–1847, 2012. [DOI] [PMC free article] [PubMed] [Google Scholar]
- 16.Glukhov AV, Flagg TP, Fedorov VV, Efimov IR, Nichols CG. Differential KATP channel pharmacology in intact mouse heart. J Mol Cell Cardiol 48: 152–160, 2010. [DOI] [PMC free article] [PubMed] [Google Scholar]
- 17.Halestrap AP, Clarke SJ, Javadov SA. Mitochondrial permeability transition pore opening during myocardial reperfusion–a target for cardioprotection. Cardiovasc Res 61: 372–385, 2004. [DOI] [PubMed] [Google Scholar]
- 18.Hausenloy DJ, Maddock HL, Baxter GF, Yellon DM. Inhibiting mitochondrial permeability transition pore opening: a new paradigm for myocardial preconditioning? Cardiovasc Res 55: 534–543, 2002. [DOI] [PubMed] [Google Scholar]
- 19.Ichihara K, Abiko Y. Difference between endocardial and epicardial utilization of glycogen in the ischemic heart. Am J Physiol 229: 1585–1589, 1975. [DOI] [PubMed] [Google Scholar]
- 20.Jedeikin LA. Regional distribution of glycogen and phosphorylase in the ventricles of the heart. Circ Res 14: 202–211, 1964. [DOI] [PubMed] [Google Scholar]
- 21.Jin H, Nass RD, Joudrey PJ, Lyon AR, Chemaly ER, Rapti K, Akar FG. Altered spatiotemporal dynamics of the mitochondrial membrane potential in the hypertrophied heart. Biophys J 98: 2063–2071, 2010. [DOI] [PMC free article] [PubMed] [Google Scholar]
- 22.Kadenbach B, Ramzan R, Moosdorf R, Vogt S. The role of mitochondrial membrane potential in ischemic heart failure. Mitochondrion 11: 700–706, 2011. [DOI] [PubMed] [Google Scholar]
- 23.Kato M, Akao M, Matsumoto-Ida M, Makiyama T, Iguchi M, Takeda T, Shimizu S, Kita T. The targeting of cyclophilin D by RNAi as a novel cardioprotective therapy: evidence from two-photon imaging. Cardiovasc Res 83: 335–344, 2009. [DOI] [PubMed] [Google Scholar]
- 24.Laughner JI, Ng FS, Sulkin MS, Arthur RM, Efimov IR. Processing and analysis of cardiac optical mapping data obtained with potentiometric dyes. Am J Physiol Heart Circ Physiol 303: H753–H765, 2012. [DOI] [PMC free article] [PubMed] [Google Scholar]
- 25.Lou Q, Fedorov VV, Glukhov AV, Moazami N, Fast VG, Efimov IR. Transmural heterogeneity and remodeling of ventricular excitation-contraction coupling in human heart failure. Circulation 123: 1881–1890, 2011. [DOI] [PMC free article] [PubMed] [Google Scholar]
- 26.Lyon AR, Joudrey PJ, Jin D, Nass RD, Aon MA, O'Rourke B, Akar FG. Optical imaging of mitochondrial function uncovers actively propagating waves of mitochondrial membrane potential collapse across intact heart. J Mol Cell Cardiol 49: 565–575, 2010. [DOI] [PMC free article] [PubMed] [Google Scholar]
- 27.Matlib MA, Rembert JC, Millard RW, Ashraf M, Rouslin W, Asano G, Greenfield JC, Jr, Schwartz A. Mitochondrial function in canine experimental cardiac hypertrophy. J Mol Cell Cardiol 15: 221–232, 1983. [DOI] [PubMed] [Google Scholar]
- 28.Matsumoto-Ida M, Akao M, Takeda T, Kato M, Kita T. Real-time 2-photon imaging of mitochondrial function in perfused rat hearts subjected to ischemia/reperfusion. Circulation 114: 1497–1503, 2006. [DOI] [PubMed] [Google Scholar]
- 29.Mirsky I. Left ventricular stresses in the intact human heart. Biophys J 9: 189–208, 1969. [DOI] [PMC free article] [PubMed] [Google Scholar]
- 30.Nazareth W, Yafei N, Crompton M. Inhibition of anoxia-induced injury in heart myocytes by cyclosporin A. J Mol Cell Cardiol 23: 1351–1354, 1991. [DOI] [PubMed] [Google Scholar]
- 31.Nicholls DG. Simultaneous monitoring of ionophore- and inhibitor-mediated plasma and mitochondrial membrane potential changes in cultured neurons. J Biol Chem 281: 14864–14874, 2006. [DOI] [PubMed] [Google Scholar]
- 32.Nicholls DG, Ferguson SJ. Bioenergetics. Boston, MA: Academic, 2002. [Google Scholar]
- 33.Nichols CG. KATP channels as molecular sensors of cellular metabolism. Nature 440: 470–476, 2006. [DOI] [PubMed] [Google Scholar]
- 34.Nichols CG, Ripoll C, Lederer WJ. ATP-sensitive potassium channel modulation of the guinea pig ventricular action potential and contraction. Circ Res 68: 280–287, 1991. [DOI] [PubMed] [Google Scholar]
- 35.Plank G, Zhou L, Greenstein JL, Cortassa S, Winslow RL, O'Rourke B, Trayanova NA. From mitochondrial ion channels to arrhythmias in the heart: computational techniques to bridge the spatio-temporal scales. Philos Trans A Math Phys Eng Sci 366: 3381–3409, 2008. [DOI] [PMC free article] [PubMed] [Google Scholar]
- 36.Schaper J, Meiser E, Stammler G. Ultrastructural morphometric analysis of myocardium from dogs, rats, hamsters, mice, and from human hearts. Circ Res 56: 377–391, 1985. [DOI] [PubMed] [Google Scholar]
- 37.Slodzinski MK, Aon MA, O'Rourke B. Glutathione oxidation as a trigger of mitochondrial depolarization and oscillation in intact hearts. J Mol Cell Cardiol 45: 650–660, 2008. [DOI] [PMC free article] [PubMed] [Google Scholar]
- 38.Venable PW, Taylor TG, Sciuto KJ, Zhao J, Shibayama J, Warren M, Spitzer KW, Zaitsev AV. Detection of mitochondrial depolarization/recovery during ischaemia-reperfusion using spectral properties of confocally recorded TMRM fluorescence. J Physiol 591: 2781–2794, 2013. [DOI] [PMC free article] [PubMed] [Google Scholar]
- 39.Ward MW, Huber HJ, Weisova P, Dussmann H, Nicholls DG, Prehn JH. Mitochondrial and plasma membrane potential of cultured cerebellar neurons during glutamate-induced necrosis, apoptosis, and tolerance. J Neurosci 27: 8238–8249, 2007. [DOI] [PMC free article] [PubMed] [Google Scholar]
- 40.Ward MW, Rego AC, Frenguelli BG, Nicholls DG. Mitochondrial membrane potential and glutamate excitotoxicity in cultured cerebellar granule cells. J Neurosci 20: 7208–7219, 2000. [DOI] [PMC free article] [PubMed] [Google Scholar]
- 41.Wengrowski AM, Kuzmiak-Glancy S, Jaimes R, 3rd, Kay MW. NADH changes during hypoxia, ischemia, and increased work differ between isolated heart preparations. Am J Physiol Heart Circ Physiol 306: H529–H537, 2014. [DOI] [PMC free article] [PubMed] [Google Scholar]
- 42.Zhou L, Solhjoo S, Millare B, Plank G, Abraham MR, Cortassa S, Trayanova N, O'Rourke B. Effects of regional mitochondrial depolarization on electrical propagation: implications for arrhythmogenesis. Circ Arrhythm Electrophysiol 7: 143–151, 2014. [DOI] [PMC free article] [PubMed] [Google Scholar]
Associated Data
This section collects any data citations, data availability statements, or supplementary materials included in this article.


