Abstract
Objective
The spot sign is related with the risk of hematoma expansion in spontaneous intracerebral hemorrhage (ICH). However, not all spot sign positive patients undergo hematoma expansion. Thus, the present study investigates the specific factors enhancing the spot sign positivity in predicting hematoma expansion.
Methods
We retrospectively studied 316 consecutive patients who presented between March 2009 to March 2011 with primary ICH and whose initial computed tomography brain angiography (CTA) was performed at our Emergency Department. Of these patients, 47 primary ICH patients presented spot signs in their CTA. We classified these 47 patients into two groups based on the presence of hematoma expansion then analyzed them with the following factors : gender, age, initial systolic blood pressure, history of anti-platelet therapy, volume and location of hematoma, time interval from symptom onset to initial CTA, spot sign number, axial dimension, and Hounsfield Unit (HU) of spot signs.
Results
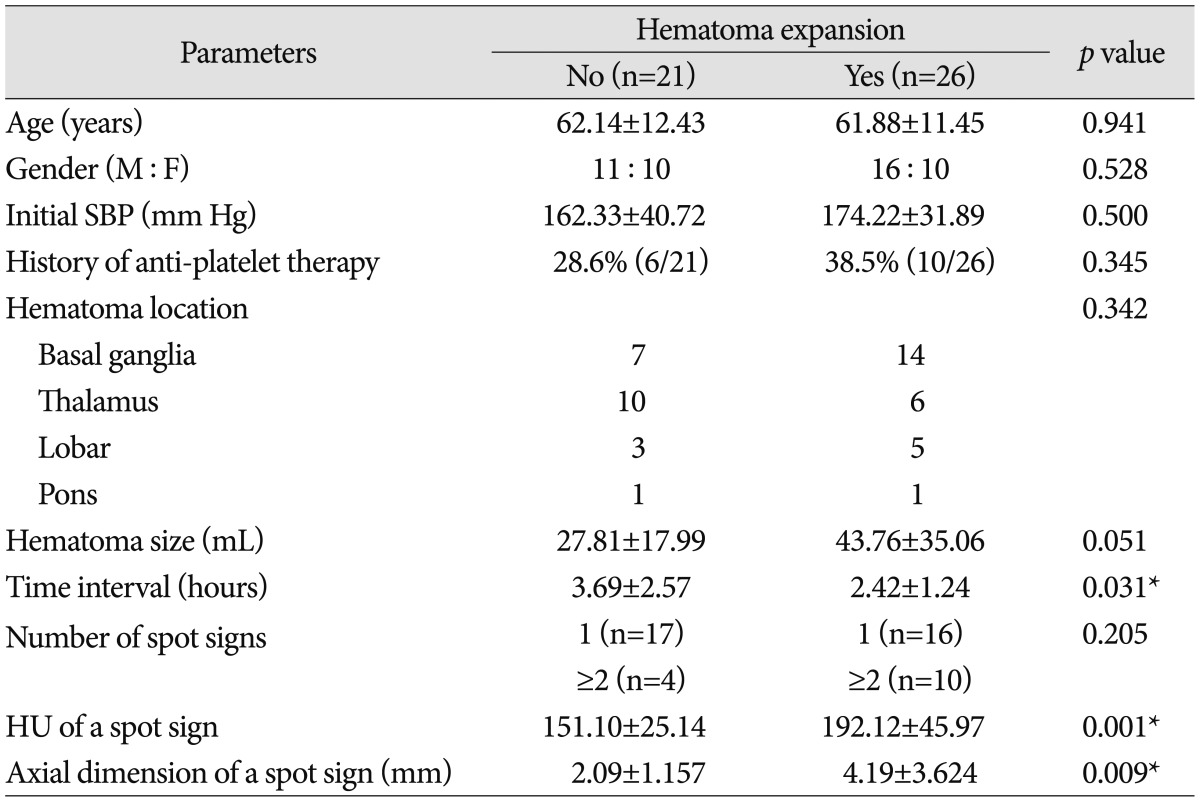
Of the 47 spot sign positive patients, hematoma expansion occurred in 26 patients (55.3%) while the remaining 21 (44.7%) showed no expansion. The time intervals from symptom onset to initial CTA were 2.42±1.24 hours and 3.69±2.57 hours for expansion and no expansion, respectively (p=0.031). The HU of spot signs were 192.12±45.97 and 151.10±25.14 for expansion and no expansion, respectively (p=0.001).
Conclusions
The conditions of shorter time from symptom onset to initial CTA and higher HU of spot signs are the emphasizing factors for predicting hematoma expansion in spot sign positive patients.
Keywords: Spot sign, Hematoma expansion, Intracerebral hemorrhage
INTRODUCTION
Spontaneous intracerebral hemorrhage (ICH) is one of the most detrimental stroke types worldwide, leading to an adverse neurological sequelae and high rates of one month mortality of 30-50%27,31). The time-dependent nature of ICH requires early diagnosis and prompt decision for rapid management to prevent further progression of the disease20,25,28). Despite the efforts of many on-going clinical trials to fight ICH, survivors of ICH with good outcome comprise only 30% approximately10) and no proven therapy is yet established to improve the survival rates and functional outcome due to the irreversible damage of brain parenchyma by the hematoma itself and its growth4,9,13,20). In-hospital hematoma expansion is a potentially modifiable therapeutic target, because its clinical consequence is equally fatal as a major complication of ICH1,9,13,15). It occurs most frequently within three hours of symptom onset2,4,9,13), but also at delayed phases7,12).
The well-known radiological marker "spot sign" on the computed tomography brain angiography (CTA) images has been introduced to be an independent predictor of hematoma expansion in many studies14,17,24,26,32). The neuroendovascular pathophysiology of spot sign is not yet fully understood, however, it is widely speculated to contribute to the chronologically heterogeneous nature of hematoma formation8,19,29). This time-dependent feature could further explain an evolving spectrum of spot signs which are observed dynamically at different timelines of hematoma expansion12,16). The fact that not all spot sign positive patients developed hematoma expansion raises the question of the emphasizing factors associated with the prevalence of hematoma expansion specifically in the spot sign positive patients at the hyperacute phase of ICH.
MATERIALS AND METHODS
Patients and clinical parameters
We retrospectively studied 358 patients with ICH who visited our institution between March 2009 and March 2011. Our institution has a primary protocol of performing a routine CTA with contrast in all non-traumatic ICH patients. However, there were cases in which we were unable to perform CTA on arrival due to the following situations : 1) 23 patients had kidney dysfunction; 2) five patients underwent CT scans with contrast to evaluate other parts of the body within 24 hours; 3) nine patients underwent brain CT with contrast from other hospitals within 24 hours; and 4) five patients underwent a non-contrast CT (NCCT), because they did not consent to brain CT with contrast on arrival. The remaining 316 patients underwent initial CTA without any conflict.
All spot sign positive patients underwent a follow-up NCCT within 24 hours. The follow-up NCCT of spot sign negative patients took place when there were newly developed neurologic symptoms within 24 hours. The exclusion criteria of this study included patients with ICH originated from aneurysmal rupture, vascular malformation, neoplasm, dissection, hemorrhagic transformation of acute ischemic stroke, and trauma. We classified 47 spot sign positive patients into two subgroups based on the presence of hematoma expansion in the follow-up NCCT. Data for each group was analyzed considering gender, age, initial systolic blood pressure, history of anti-platelet therapy, volume and location of hematoma, time interval from symptom onset to initial CTA, spot sign number, axial dimension and Hounsfield Unit (HU) of spot signs.
Hematoma expansion was defined by an increase in volume of >33% or >6 mL from the baseline brain CT scan by the criteria of Wada et al.32). The spot sign was identified as one or more 1-2 mm foci of enhancement within the hematoma on CTA source images32). Hematoma volume measurement was validated using the ABC/2 method21). The axial dimension of spot sign was defined as the longest diameter of a spot within the hematoma. The spot signs were independently verified and confirmed by one neuroradiologist and two neurovascular surgeons from our institution.
Imaging studies
All brain CT scans were performed according to the standard departmental protocols on 64-channel CT scanners (Philips, Brilliance CT-64 channel scanner, Eindhoven, The Netherlands). Pre-contrast image examinations were performed using brain standard technique with 120 kVp, 150 mA, and 5-mm slice thickness reconstruction prior to CTA. CTA was subsequently performed by scanning from the C1 vertebral body to the parietal vertex using axial technique with the following parameters : 0.891 pitch; 64×0.625 mm collimation; 280 mA; 120 kVp; 30 cm field of view; table speed 16 mm/rotation; gantry rotation speed 0.5 s/rotation; reconstructed section thickness 0.5 mm; reconstruction increment 0.3 mm; Iohexol (Bonorex 350; Daihan Pharm, Seoul, Korea) 300 mgI/mL (administered by power injector at 4.5 mL per second); and a fixed 10-second delay between the onset of contrast injection and the start of scanning. The contrast varies (80-100 mL) depending on the age, weight, and cardiac output of the patient.
Statistical analysis
All parameters were evaluated retrospectively. Prognostic factors were evaluated with a chi-square test, Student t-test, receiver operation characteristic (ROC) curve, and binary logistic regression test with significance defined as p<0.05. All statistical analysis was performed with commercial software (Predictable Analysis Software, Version 18.0, IBM Inc., Chicago, IL, USA).
RESULTS
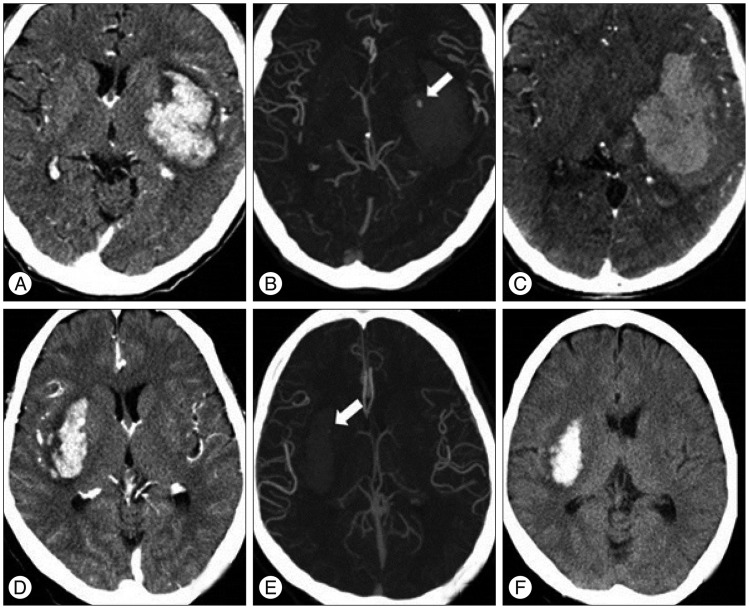
Study inclusion criteria resulted in 316 consecutive patients for the study. Forty-seven patients (14.9%) were spot sign positive. Of these, 26 patients (55.3%) developed hematoma expansion within the 24 hours follow-up CT scan, while the other 21 patients (44.7%) showed no interval change (Fig. 1). As a part of reference, of 269 spot sign negative patients, 31 patients (11.2%) developed hematoma expansion (data not in the Table). The mean volume of expanded hematoma was 29.20±18.50 mL while the maximal and minimal volumes were 80.00 mL and 10.00 mL, respectively, in the spot sign negative patients.
Fig. 1.
CT angiograms of two spot sign positive patients with and without hematoma expansion. Brain CT scans demonstrate basal ganglia hemorrhage. The upper row CT images of a 47-year-old female display hematoma expansion 2 hours after presentation with a spot sign of 3.63 mm and a density of 194 Hounsfield units (HU) (A, B, and C). The lower row CT images of a 61-year-old male show no hematoma expansion 24 hours after presentation with a spot sign of 1.21 mm and a density of 117 HU (D, E, and F).
There was no statistical significance with the gender, age, initial hematoma volume, initial systolic blood pressure (SBP) and the history of anti-platelet therapy in predicting hematoma expansion in spot sign positive patients (p>0.05 for all)(Table 1). Additionally, the location of ICH and the number of spot signs were statistically insignificant.
Table 1.
Clinical characteristics of hematoma expansion in spot sign positive patients

*Statistical significance based on Student t-test and chi-square test (p<0.05). M : male, F : female, SBP : systolic blood pressure, HU : Hounsfield unit, n : number of patients
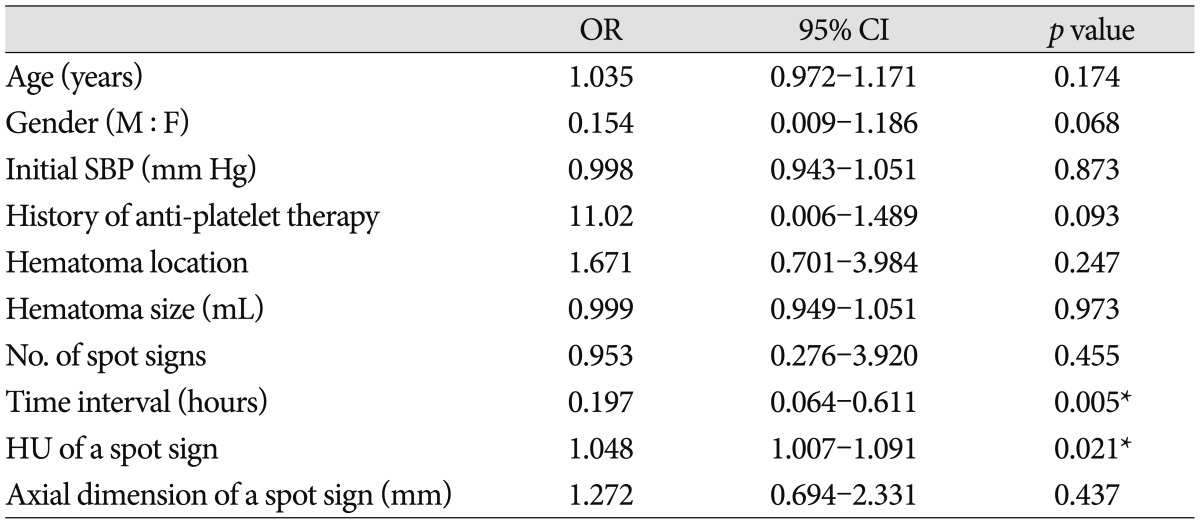
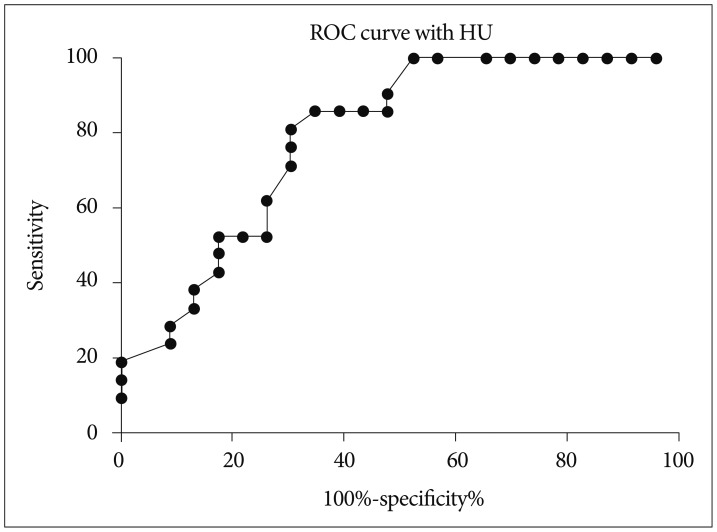
In univariate analysis, shorter time interval to initial CTA (p=0.031), higher HU (p=0.001) and larger axial dimension of spot signs (p=0.009) were markedly associated with hematoma expansion. When binary logistic regression test was performed, shorter time interval to initial CTA and HU of a spot sign showed statistical significance (OR of 0.197; 95% CI, 0.064-0.611; and OR of 1.048; 95% CI, 1.007-1.091, respectively) (Table 2). Additionally, the association between HU of a spot sign and hematoma expansion was investigated. When the cut-off value of HU was set at 171 in the ROC curve measurements, the sensitivity and specificity for hematoma expansion were 65.4% and 85.7%, respectively (Fig. 2). The sensitivity of data was 100% when the absolute HU was over 191.0.
Table 2.
Multivariate analysis for factors associated with hematoma expansion in patients with spot signs

*Statistical significance based on binary logistic regression analysis for the variables associated with hematoma expansion and spot signs (p<0.05). OR : odds ratio, CI : confidence interval, M : male, F : female, SBP : systolic blood pressure, HU : Hounsfield unit
Fig. 2.
Receiver operating characteristic (ROC) curve using the Hounsfield unit (HU). The cut-off HU value was 171 [sensitivity, 65.4%; specificity, 85.7%; area under the ROC curve (AUC)=0.7919]. If the cut-off HU value was set higher than 191.0, sensitivity was 100%.
DISCUSSION
This original investigation has focused on verifying the emphasizing factors with prognostic significance for hematoma expansion in the spot sign positive patients. This is a single-institutional study and all patients with non-traumatic ICH uniformly underwent CTA protocols to minimize variations in the measurements of spot sign positivity and axial size.
Unlike the multicenter studies on spot sign characteristics14,22), our results demonstrated that the number of spot sign was statistically insignificant in predicting hematoma expansion among the spot sign positive patients. The multivariate analysis also showed that shorter interval time from symptom onset to initial CTA and higher absolute HU of a spot sign were the specific factors most predictive of hematoma expansion in the spot sign positive patients. Huynh et al.22) addressed the issue of variations in measuring the spot density and size with NCCT. The same authors also mentioned the impracticality of risk-stratifying hematoma expansion by using the association of density and size in an acute and multicenter setting. In contrast, when our data was based on all patients who underwent a routine CTA, we experienced no difficulties in measuring the spot sign density and size effectively under an acute clinical situation. Furthermore, we believe that the information from our study is significantly important and easily applicable in assessing the spot sign positivity in higher risk groups.
Many studies reported that the factor of shorter interval time from symptom onset to initial CT is closely related with the risk of hematoma expansion, and this is firmly supported by our data3,4). This result strongly implicates the importance of capturing or, if not possible, narrowing the range of average critical time of pending hematoma expansion when the spot sign was forming real-time. Higher HU of a spot sign may reflect an active bleeding site of acute ICH (i.e., the focus of impending hematoma expansion at hyperacute phase). Pathophysiologically, the question remains as to whether this feature indicates the site of vessel injuries with an on-going process of hemorrhage or the final "clot" of injured vessels8,29). Similarly speaking, larger axial dimension of a spot sign may also indicate the growing patterns of bleeding site, implicating the hematoma expansion subsequently.
The interpretations of the factors mentioned so far add to understanding the acute progressive nature of hematoma expansion itself in spot sign positive patients with hyperacute ICH specifically. It is obvious that the prediction tool for hematoma expansion needs to be readily applicable because ICH, by its nature, is an abrupt clinical disease with a rapid progressive aggravation jeopardizing a patient's clinical outcome27). Realistically, one cannot wait for a follow-up brain CT to confirm hematoma expansion, as there is always a subgroup of ICH patients undergoing clinical deterioration at any time. The information given by the initial CTA and by stratifying patients with higher risks of hematoma expansion is critical in acute management of ICH. With this in mind, our study has demonstrated the emphasizing factors most predictive of hematoma expansion in spot sign positive patients.
Unfortunately, at present, the positive predictive values of spot signs are variable between different studies depending on how each clinical center defines spot sign and hematoma expansion9,15,24,32). For example, of 47 spot sign positive patients with ICH at hyperacute phase, only 55.3% developed hematoma expansion in our study. This data only represents an analysis of one subset of patients presented "ultra-early" to our emergency department. Not all spot sign positive patients within this subset underwent hematoma expansion. This may also imply that the simple presence of spot sign itself is insufficient to predict hematoma expansion. For the past few years, many efforts have been made to characterize spot signs for better detection through designing useful spot sign scoring systems6,23) and through the experiences with various CT modalities for real-time information of spot signs30). This has helped the clinicians in developing a better understanding of the link between hematoma expansion and spot signs. Nevertheless, the optimal time for spot sign detection for better prediction of hematoma expansion may not be possible as a spot sign is currently conceptualized to evolve during hematoma expansion due to its dynamic pathophysiological nature16,30). For this reason, we sought to investigate the factors that strongly emphasize the spot sign positivity for better prediction of hematoma expansion at hyperacute phase of ICH specifically.
There are limitations in this study. This investigation does not intend to analyze the spot sign positive patients with hematoma expansion at the delayed phase of ICH. Further studies are required, firstly, to classify a wider range of subsets of patients at different timelines of ICH. Secondly, the analysis of each subset will help define a common feature of factors most predictive of hematoma expansion for the whole spot sign positive population at different times. There needs to be a separate investigation for a substantial group of hematoma expansion with spot sign negative patients to help understanding the pathology of spot signs17). It is equally important to note that 11.2% (31/269) of spot sign negative patients underwent hematoma expansion. This suggests the dynamic nature of spot sign in the time sequence of ICH development where spot signs may evolve and disappear at certain time from ictus as being the hemostatically unstable lesions of ICH. Further studies will be required to seek the elusive time line to link the spot sign formation and hematoma expansion, which will guide the neurosurgeons to make decisions for planning treatment. This study also needs to consider the fact that ICH is medically complex as patients usually are presented with premorbid conditions of putative risk factors33). The recent publications on the genetic5) and biochemical serum markers11) concerning ICH and hematoma expansion are other areas to be investigated in terms of the role of spot sign. These may help enhancing the predictive power of spot sign positivity in hematoma expansion as it is reasonable to say that they all eventually influence the pathology of forming spot signs. Gazzola et al.18) reported the vascular and nonvascular mimics of the CTA spot signs, and these present another limitations to consider when interpreting our data. Lastly, there may be inter-observer and intra-observer variability which could act as a confounding factor in analyzing spot signs.
CONCLUSION
As many studies have already explored the potential of spot signs in predicting hematoma expansion, we have further analyzed the factors that concurrently emphasized the spot sign positivity in predicting hematoma expansion with patients presenting with ICH at hyperacute phase. From this study, spot sign positivity is predictive of hematoma expansion under the conditions of shorter time from symptom to initial CTA and higher HU of spot signs. It will be our next task to unravel the common features of both spot sign positive and negative patients with hematoma expansion in order to investigate the strategic characterization and treatment of the high-risk ICH population.
References
- 1.Balami JS, Buchan AM. Complications of intracerebral haemorrhage. Lancet Neurol. 2012;11:101–118. doi: 10.1016/S1474-4422(11)70264-2. [DOI] [PubMed] [Google Scholar]
- 2.Broderick JP, Brott TG, Tomsick T, Barsan W, Spilker J. Ultra-early evaluation of intracerebral hemorrhage. J Neurosurg. 1990;72:195–199. doi: 10.3171/jns.1990.72.2.0195. [DOI] [PubMed] [Google Scholar]
- 3.Broderick JP, Diringer MN, Hill MD, Brun NC, Mayer SA, Steiner T, et al. Determinants of intracerebral hemorrhage growth : an exploratory analysis. Stroke. 2007;38:1072–1075. doi: 10.1161/01.STR.0000258078.35316.30. [DOI] [PubMed] [Google Scholar]
- 4.Brott T, Broderick J, Kothari R, Barsan W, Tomsick T, Sauerbeck L, et al. Early hemorrhage growth in patients with intracerebral hemorrhage. Stroke. 1997;28:1–5. doi: 10.1161/01.str.28.1.1. [DOI] [PubMed] [Google Scholar]
- 5.Brouwers HB, Biffi A, Ayres AM, Schwab K, Cortellini L, Romero JM, et al. Apolipoprotein E genotype predicts hematoma expansion in lobar intracerebral hemorrhage. Stroke. 2012;43:1490–1495. doi: 10.1161/STROKEAHA.111.643262. [DOI] [PMC free article] [PubMed] [Google Scholar]
- 6.Brouwers HB, Chang Y, Falcone GJ, Cai X, Ayres AM, Battey TW, et al. Predicting hematoma expansion after primary intracerebral hemorrhage. JAMA Neurol. 2014;71:158–164. doi: 10.1001/jamaneurol.2013.5433. [DOI] [PMC free article] [PubMed] [Google Scholar]
- 7.Brouwers HB, Falcone GJ, McNamara KA, Ayres AM, Oleinik A, Schwab K, et al. CTA spot sign predicts hematoma expansion in patients with delayed presentation after intracerebral hemorrhage. Neurocrit Care. 2012;17:421–428. doi: 10.1007/s12028-012-9765-2. [DOI] [PMC free article] [PubMed] [Google Scholar]
- 8.Brouwers HB, Goldstein JN, Romero JM, Rosand J. Clinical applications of the computed tomography angiography spot sign in acute intracerebral hemorrhage : a review. Stroke. 2012;43:3427–3432. doi: 10.1161/STROKEAHA.112.664003. [DOI] [PMC free article] [PubMed] [Google Scholar]
- 9.Brouwers HB, Greenberg SM. Hematoma expansion following acute intracerebral hemorrhage. Cerebrovasc Dis. 2013;35:195–201. doi: 10.1159/000346599. [DOI] [PMC free article] [PubMed] [Google Scholar]
- 10.Castellanos M, Leira R, Tejada J, Gil-Peralta A, Dávalos A, Castillo J, et al. Predictors of good outcome in medium to large spontaneous supratentorial intracerebral haemorrhages. J Neurol Neurosurg Psychiatry. 2005;76:691–695. doi: 10.1136/jnnp.2004.044347. [DOI] [PMC free article] [PubMed] [Google Scholar]
- 11.Castillo J, Dávalos A, Alvarez-Sabín J, Pumar JM, Leira R, Silva Y, et al. Molecular signatures of brain injury after intracerebral hemorrhage. Neurology. 2002;58:624–629. doi: 10.1212/wnl.58.4.624. [DOI] [PubMed] [Google Scholar]
- 12.Chakraborty S, Blacquiere D, Lum C, Stotts G. Dynamic nature of the CT angiographic "spot sign". Br J Radiol. 2010;83:e216–e219. doi: 10.1259/bjr/74416385. [DOI] [PMC free article] [PubMed] [Google Scholar]
- 13.Davis SM, Broderick J, Hennerici M, Brun NC, Diringer MN, Mayer SA, et al. Hematoma growth is a determinant of mortality and poor outcome after intracerebral hemorrhage. Neurology. 2006;66:1175–1181. doi: 10.1212/01.wnl.0000208408.98482.99. [DOI] [PubMed] [Google Scholar]
- 14.Delgado Almandoz JE, Yoo AJ, Stone MJ, Schaefer PW, Goldstein JN, Rosand J, et al. Systematic characterization of the computed tomography angiography spot sign in primary intracerebral hemorrhage identifies patients at highest risk for hematoma expansion : the spot sign score. Stroke. 2009;40:2994–3000. doi: 10.1161/STROKEAHA.109.554667. [DOI] [PMC free article] [PubMed] [Google Scholar]
- 15.Dowlatshahi D, Demchuk AM, Flaherty ML, Ali M, Lyden PL, Smith Ee, et al. Defining hematoma expansion in intracerebral hemorrhage : relationship with patient outcomes. Neurology. 2011;76:1238–1244. doi: 10.1212/WNL.0b013e3182143317. [DOI] [PMC free article] [PubMed] [Google Scholar]
- 16.Dowlatshahi D, Wasserman JK, Momoli F, Petrcich W, Stotts G, Hogan M, et al. Evolution of computed tomography angiography spot sign is consistent with a site of active hemorrhage in acute intracerebral hemorrhage. Stroke. 2014;45:277–280. doi: 10.1161/STROKEAHA.113.003387. [DOI] [PubMed] [Google Scholar]
- 17.Ederies A, Demchuk A, Chia T, Gladstone DJ, Dowlatshahi D, Bendavit G, et al. Postcontrast CT extravasation is associated with hematoma expansion in CTA spot negative patients. Stroke. 2009;40:1672–1676. doi: 10.1161/STROKEAHA.108.541201. [DOI] [PubMed] [Google Scholar]
- 18.Gazzola S, Aviv RI, Gladstone DJ, Mallia G, Li V, Fox AJ, et al. Vascular and nonvascular mimics of the CT angiography "spot sign" in patients with secondary intracerebral hemorrhage. Stroke. 2008;39:1177–1183. doi: 10.1161/STROKEAHA.107.499442. [DOI] [PubMed] [Google Scholar]
- 19.Greenberg CH, Frosch MP, Goldstein JN, Rosand J, Greenberg SM. Modeling intracerebral hemorrhage growth and response to anticoagulation. PLoS One. 2012;7:e48458. doi: 10.1371/journal.pone.0048458. [DOI] [PMC free article] [PubMed] [Google Scholar]
- 20.Huttner HB, Schellinger PD, Hartmann M, Köhrmann M, Juettler E, Wikner J, et al. Hematoma growth and outcome in treated neurocritical care patients with intracerebral hemorrhage related to oral anticoagulant therapy : comparison of acute treatment strategies using vitamin K, fresh frozen plasma, and prothrombin complex concentrates. Stroke. 2006;37:1465–1470. doi: 10.1161/01.STR.0000221786.81354.d6. [DOI] [PubMed] [Google Scholar]
- 21.Huttner HB, Steiner T, Hartmann M, Köhrmann M, Juettler E, Mueller S, et al. Comparison of ABC/2 estimation technique to computer-assisted planimetric analysis in warfarin-related intracerebral parenchymal hemorrhage. Stroke. 2006;37:404–408. doi: 10.1161/01.STR.0000198806.67472.5c. [DOI] [PubMed] [Google Scholar]
- 22.Huynh TJ, Demchuk AM, Dowlatshahi D, Gladstone DJ, Krischek O, Kiss A, et al. Spot sign number is the most important spot sign characteristic for predicting hematoma expansion using first-pass computed tomography angiography : analysis from the PREDICT study. Stroke. 2013;44:972–977. doi: 10.1161/STROKEAHA.111.000410. [DOI] [PubMed] [Google Scholar]
- 23.Huynh TJ, Flaherty ML, Gladstone DJ, Broderick JP, Demchuk AM, Dowlatshahi D, et al. Multicenter accuracy and interobserver agreement of spot sign identification in acute intracerebral hemorrhage. Stroke. 2014;45:107–112. doi: 10.1161/STROKEAHA.113.002502. [DOI] [PubMed] [Google Scholar]
- 24.Kim J, Smith A, Hemphill JC, 3rd, Smith WS, Lu Y, Dillon WP, et al. Contrast extravasation on CT predicts mortality in primary intracerebral hemorrhage. AJNR Am J Neuroradiol. 2008;29:520–525. doi: 10.3174/ajnr.A0859. [DOI] [PMC free article] [PubMed] [Google Scholar]
- 25.Mayer SA. Ultra-early hemostatic therapy for primary intracerebral hemorrhage : a review. Can J Neurol Sci. 2005;32(Suppl 2):S31–S37. [PubMed] [Google Scholar]
- 26.Park SY, Kong MH, Kim JH, Kang DS, Song KY, Huh SK. Role of 'spot sign' on CT angiography to predict hematoma expansion in spontaneous intracerebral hemorrhage. J Korean Neurosurg Soc. 2010;48:399–405. doi: 10.3340/jkns.2010.48.5.399. [DOI] [PMC free article] [PubMed] [Google Scholar]
- 27.Qureshi AI, Mendelow AD, Hanley DF. Intracerebral haemorrhage. Lancet. 2009;373:1632–1644. doi: 10.1016/S0140-6736(09)60371-8. [DOI] [PMC free article] [PubMed] [Google Scholar]
- 28.Rodríguez-Yáñez M, Castellanos M, Freijo MM, López-Fernández JC, Martí-Fàbregas J, Nombela F, et al. Clinical practice guidelines in intracerebral haemorrhage. Neurologia. 2013;28:236–249. doi: 10.1016/j.nrl.2011.03.010. [DOI] [PubMed] [Google Scholar]
- 29.Skidmore CT, Andrefsky J. Spontaneous intracerebral hemorrhage : epidemiology, pathophysiology, and medical management. Neurosurg Clin N Am. 2002;13:281–288. doi: 10.1016/s1042-3680(02)00019-0. [DOI] [PubMed] [Google Scholar]
- 30.Sun SJ, Gao PY, Sui BB, Hou XY, Lin Y, Xue J, et al. "Dynamic spot sign" on CT perfusion source images predicts haematoma expansion in acute intracerebral haemorrhage. Eur Radiol. 2013;23:1846–1854. doi: 10.1007/s00330-013-2803-4. [DOI] [PubMed] [Google Scholar]
- 31.van Asch CJ, Luitse MJ, Rinkel GJ, van der Tweel I, Algra A, Klijn CJ. Incidence, case fatality, and functional outcome of intracerebral haemorrhage over time, according to age, sex, and ethnic origin : a systematic review and meta-analysis. Lancet Neurol. 2010;9:167–176. doi: 10.1016/S1474-4422(09)70340-0. [DOI] [PubMed] [Google Scholar]
- 32.Wada R, Aviv RI, Fox AJ, Sahlas DJ, Gladstone DJ, Tomlinson G, et al. CT angiography "spot sign" predicts hematoma expansion in acute intracerebral hemorrhage. Stroke. 2007;38:1257–1262. doi: 10.1161/01.STR.0000259633.59404.f3. [DOI] [PubMed] [Google Scholar]
- 33.Wartenberg KE, Mayer SA. Reducing the risk of ICH enlargement. J Neurol Sci. 2007;261:99–107. doi: 10.1016/j.jns.2007.04.044. [DOI] [PubMed] [Google Scholar]


