Abstract
Hydrogen composition and occupation state provide basic information for understanding various properties of the metal–hydrogen system, ranging from microscopic properties such as hydrogen diffusion to macroscopic properties such as phase stability. Here the deuterization process of face-centred cubic Fe to form solid-solution face-centred cubic FeDx is investigated using in situ neutron diffraction at high temperature and pressure. In a completely deuterized specimen at 988 K and 6.3 GPa, deuterium atoms occupy octahedral and tetrahedral interstitial sites with an occupancy of 0.532(9) and 0.056(5), respectively, giving a deuterium composition x of 0.64(1). During deuterization, the metal lattice expands approximately linearly with deuterium composition at a rate of 2.21 Å3 per deuterium atom. The minor occupation of the tetrahedral site is thermally driven by the intersite movement of deuterium atoms along the ‹111› direction in the face-centred cubic metal lattice.
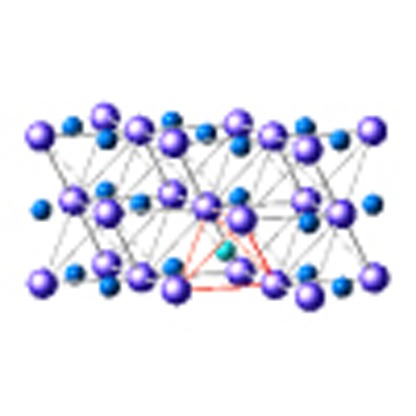 Knowledge of hydrogen content and coordination in deuterized metals is of importance. Here, the authors study the deuterization of face-centred cubic iron in-situ via neutron diffraction, observing the occupation by hydrogen of both octahedral and tetrahedral interstitial sites.
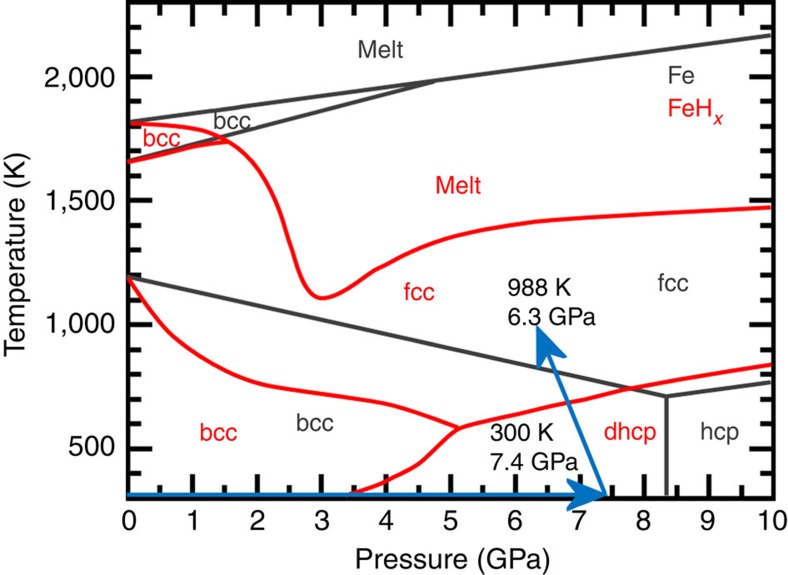
At high hydrogen pressures (several GPa), metals react with hydrogen (H) to form hydrides, with the hydrogen atoms occupying the interstitial sites of metal lattices. Iron hydrides have been intensively studied for many decades and the diagram of the Fe–H system is well established at temperatures up to 2,000 K and pressures up to 20 GPa1,2,3,4. Three hydride forms exist: body-centred cubic (bcc)-FeHx, double hexagonal close-packed (dhcp)-FeHx and face-centred cubic (fcc)-FeHx, which correspond to the bcc, hcp and fcc phases of pure Fe, respectively (Fig. 1); in the hydride, the stacking of the closed-packed metal plane of hcp Fe is slightly modified into dhcp stacking.
Figure 1. Compression and heating path of the deuterization of iron.
Pressure–temperature phase diagram of FeHx (red lines) and Fe (grey lines), which are reproduced from those presented in refs 2, 3, 4 for FeHx, and ref. 17 for Fe, respectively. In situ neutron diffraction measurements were made along the compression and heating paths indicated by the light-blue arrows.
Knowledge of hydrogen composition is essential for interpreting the physical and chemical properties of hydrides. The solubility of hydrogen in bcc Fe is very low (that is, <10–6 H/Fe) at ambient temperature in hydrogen pressure of 0.1 GPa5. The hydrogen solubility in iron increases drastically as the gas pressure increases above several GPa and a nearly stoichiometric hydride dhcp FeH is obtained above 3.5 GPa at ambient temperature6. The high-temperature phase of fcc FeHx is a solid solution with x ranging up to or even beyond unity7,8. The quantity of H (x) in fcc FeHx varies with temperature and pressure; however, the details are still unknown. The iron hydride, fcc FeHx, is thermodynamically stable only at high pressures and attempts to quench it at ambient pressure have not succeed yet9.
Site occupancy of H atom is also essential for the characterization of fcc FeHx. The fcc metal lattice has two interstitial sites available for accommodating H atoms: octahedral (O) and tetrahedral (T) sites. In transition metals with fcc lattice, dissolved H atoms preferentially occupy the O site with larger free space than the T site10. T-site occupation has been reported only for fcc PdDx and seems to remain inconclusive11. Volume expansion vH caused by hydrogen absorption is another essential quantity; a value of 2.4 Å3 per H4 has been reported for dhcp-FeH, which is significantly larger than those of 1.66–1.82 Å3 per H for other 3d-transition metals’ hydrides with hcp metal lattice10. For the vH of fcc FeHx, an experimentally determined value has not been reported; the value of 1.9 Å3 per H conventionally used for fcc FeHx was derived from the concentration of hydrogen measured in fcc-(Fe0.65Mn0.29Ni0.06)H0.95, which was cooled to ~220 K (ref. 12). Recently, a slightly larger value (2.09 Å3 per H), obtained from the compression data of fcc FeHx, has been proposed2,7,8.
The high-pressure neutron diffractometer, PLANET, constructed at the Materials and Life Science Experimental Facility in J-PARC provides a diagnostic method for the hydrogenation of metals occurring at high temperature and pressure13,14. Deuterium (D) has chemical properties similar to those of H, and reacts with iron to form deuterides. Since the nucleus of D atom has a scattering length comparable to that of the Fe nucleus against neutron beams, neutron diffraction measurement enables us to precisely investigate the crystal structures of iron deuterides, including the location and occupancy of D atoms at the interstitial sites of the Fe metal lattice.
In this study, the high-temperature phase of fcc Fe is reacted with deuterium fluid above 870 K and approximately at 6 GPa, and the deuterization process is monitored by in situ neutron diffraction measurements. The crystal structures are refined using the Rietveld refinement by employing the diffraction profiles measured during deuterization and for a completely deuterized product. In addition to the dominant O site occupation, the slight occupation of D at the T site is unexpectedly observed and interpreted in terms of thermally activated intersite movement of D atoms by quantum mechanical calculation.
Results
Deuterium composition and site occupancies of fcc FeD x
Solid solution of fcc FeDx was prepared by heating bcc Fe in the presence of an internal deuterium source (that is, AlD3) at an initial pressure of 7.4 GPa. The bcc–fcc transition of Fe occurred approximately at 800 K. Deuterization started at 870 K concurrently with decomposition of the inner deuterium source AlD3, and proceeded on further heating to 988 K, at which the temperature was maintained constant to form the equilibrium state of fcc FeDx. Diffraction profiles used for structural analysis were required to be free from grain growth and chemical contamination, which were carefully examined by in situ neutron diffraction measurement at 988 K and 6.3 GPa (Supplementary Figs 1 and 2 and Supplementary Table 1), X-ray diffraction and chemical analysis of the recovered specimen at ambient conditions (Supplementary Figs 3 and 4 and Supplementary Methods).
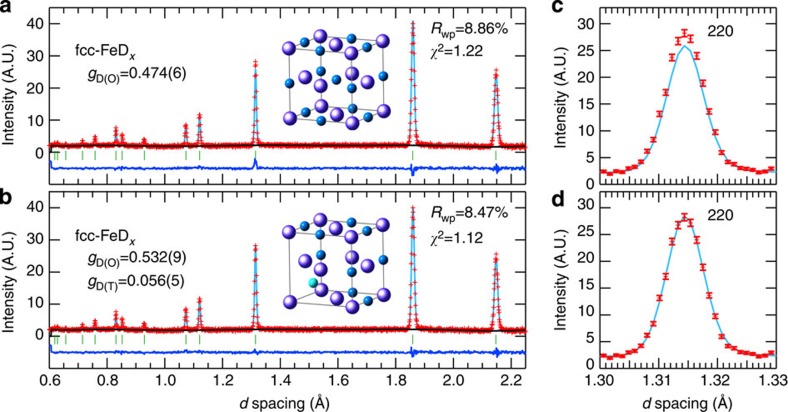
The crystal structure of fcc FeDx at equilibrium has been refined using the 988 K–6.3 GPa profile by employing the Rietveld refinement within the Z-Rietveld software (version 0.9.42.2)15,16. We examined two structural models: the fcc metal lattice with D atoms only at the O sites (model 1), and that with D atoms occupying both the T and O sites (model 2). As seen in Fig. 2a,b, the profile seems to be satisfactorily reproduced by the two models. However, as obvious by the enlargement of the 220 reflection-peak profiles (Fig. 2c,d), a slight misfit remained for the 220 reflection peak in model 1. The structure factors of fcc FeDx were given by the sum or difference of the scattering lengths b of the constituent Fe and D atoms: Fh+k+l=odd=4|bFe−gD(O)bD| for odd-indexed reflections and Fh+k+l=4m=4|bFe+(gD(O)+2gD(T))bD| or Fh+k+l=4m+2=4|bFe+(gD(O)−2gD(T))bD| for even-indexed reflections, where bFe=9.45 fm and bD=6.671 fm, and gD(T) and gD(O) indicate the T- and O-site occupancies, respectively. The T-site occupation provided additional intensity to the 220 reflections; therefore, the deficit of the 220 peak intensity in model 1 was attributed to the exclusion of the T-site occupancy. A best fit result was obtained with model 2. The optimized fitting parameters were as follows: lattice constant a=3.71968(5) Å, isotropic atomic displacements BFe=1.44(3) Å2 for Fe, BD=4.1(2) Å2 for D, gD(O)=0.532(9) and gD(T)= 0.056(5). Assuming the Boltzmann distribution exp(–Δε/kBT), the site occupancy ratio gD(T)/gD(O)=0.056/0.532 at 988 K yielded an energy difference between the two sites of 0.19 eV. The deuterization composition, x=gD(O)+2gD(T), was 0.64(1), which gave the chemical formula FeD0.64.
Figure 2. Experimental and calculated diffraction profiles of fcc FeDx at 988 K and 6.3 GPa.
Refined profiles calculated using the fit parameters optimized for (a) model 1 and (b) model 2. The crystal symmetry is cubic ( , Z=4). The atomic sites are Fe 4a(0,0,0), D(O) 4b(1/2,1/2,1/2) and D(T) 8c(1/4,1/4,1/4). The refined structure parameters are given in the main text. Reliable values for the parameters Rwp and χ2 are given in the panels. The enlarged 220 reflection peak profiles are displayed in c,d, in which the experimental errors, which are from counting statistics, are given as vertical bars. A best fit is obtained for model 2 with D atoms at the O sites (dark-blue sphere) and T sites (light-blue sphere), as illustrated in the inset of b, where the O sites surrounding the occupied T site are vacant to avoid the violation of the 2-Å rule (ref. 28).
Volume expansion by deuterium absorption
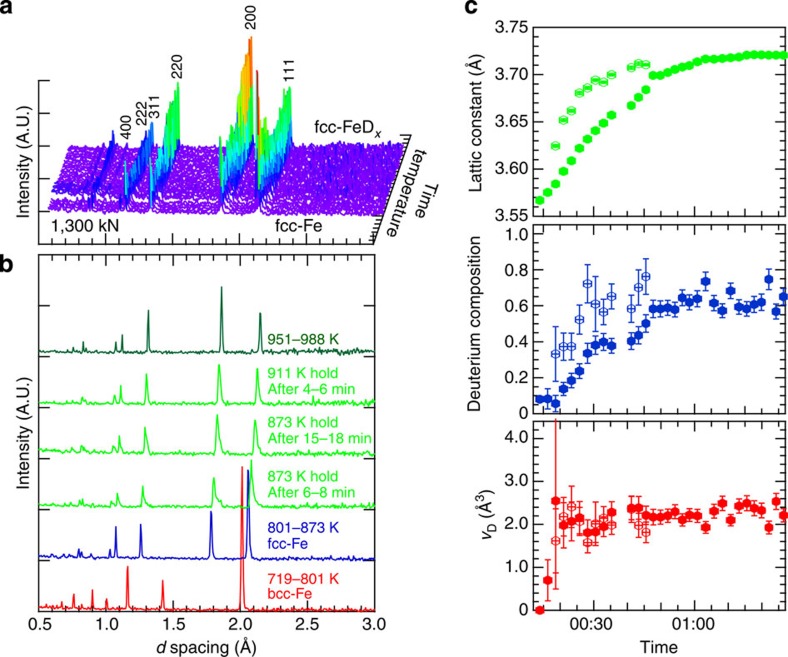
The diffraction profiles obtained during deuterization are displayed in Fig. 3a,b. Low-intensity peaks appeared at the large-d spacing sides of the original peaks at 873 K, indicating possible deuteride formation on the specimen surface at the early stage of deuterization. The original dominant peaks gradually shifted to large-d spacing with significant change in peak intensity with time and further increase in temperature. For instance, the 111 reflection peak at ~2.1 Å showed almost twice the peak height of the 200 reflection peak at ~1.8 Å, whereas the 873 K profile displayed approximately equal peak heights from 16 to 18 min after the initiation of deuterization. Upon further heating, the dominant peaks merged with the shoulder peaks and formed single peaks, and the 111 peak height reverted approximately to two-third of the height of the 200 peak. These profile changes arose from the successive volume expansion caused by D-atom occupation at the specific interstitial site of the metal lattice as described above.
Figure 3. Neutron diffraction profiles and obtained parameters.
(a) Neutron diffraction profiles measured with a 2-min accumulation for the deuterization process of fcc Fe at an initial pressure of 7.4 GPa. The profiles of bcc Fe are omitted to clearly display the profile change due to deuterization. (b) Selected profiles showing bcc–fcc transition of Fe and successive deuterization of fcc-Fe. (c) Lattice constant a (top), D composition x (middle) and volume expansion rate vD (bottom) plotted with time after the start of deuterization. Solid and open circles represent the parameters derived with the refinement analysis using the dominant and shoulder peaks, respectively. Errors are estimated based on the s.d. of Rietveld analysis.
The volume expansion rate vD was derived from the D composition and the volume expansion because of deuterium absorption. After correction of the thermal expansion of the Fe lattice17, we obtained a value of 2.21(4) Å3 per D at 988 K and 6.3 GPa, which was significantly larger than the value of 1.9 Å3 per H conventionally used for fcc FeHx, but rather close to 2.4 Å3 per H4 reported for dhcp-FeD recovered at 90 K and ambient pressure18. According to Fukai10, vH of other 3-d transition metals such as Cr, Mn, Co, Ni and Mo, with O-site occupancy of H atom ranges from 1.85 to 2.3 Å3 per H. Especially, fcc-NiH, (Ni,Mn)H and MoH give values of 2.2–2.3 Å3 per H, which are close to 2.21(4) Å3 per D obtained in the present study.
The volume expansion rate vD can be considered constant over a wide range of deuterium compositions. The lattice constant of the fcc metal lattice and the site occupancies of D atoms have been obtained for each profile measured during the deuterization process by Rietveld analysis, where the occupancy ratio of gD(T)/gD(O) was assumed to vary with temperature, according to the Boltzmann distribution exp(–Δε/kBT) with Δε=0.19 eV. The obtained structure parameters a, x and vD are plotted against the deuterization reaction time in Fig. 3c. The lattice constant and D composition increase approximately linearly with time and, consequently, the volume expansion rate remains constant. In other words, the lattice expansion on D-atom absorption, Δv, is proportional to x and can be described by Δv=2.21x, where x ranges between 0 and 0.64, which is the highest D composition achieved in the present study.
Intersite movement of dissolved deuterium atoms
To investigate the origin of the T-site occupation, we calculated quantum mechanically the wave functions of the O-site D atom and its extension to the T site. The potential curves along various paths in the fcc metal lattice are constructed using the Krimmel’s pair-potential II19,20. Displacements of the nearest-neighbour Fe atoms because of self-trapped D atoms are taken into account: 0.01 and 0.02 in u/a unit for the T-site and O-site trapping, respectively, where u is the displacement, and a is the lattice constant19. Vibrational energies and wave functions are calculated for the D atom at the O and T sites using a numerical analysis previously reported21. The potentials along three paths and the projections of the wave functions on them are drawn in Fig. 4a,b. Ground-state wave functions show a Gaussian-like shape with maximum amplitudes at the centres of sites O and T. The wave functions of the first-excited states display a sine-function-like shape with nodes at the origin, and their maxima are located slightly apart from the O-site centre. The wave functions extend very slightly to the T sites even for the first-excited state, thus, giving negligible probability of T-site occupation.
Figure 4. Potential curves and wave functions along the ‹100›, ‹110› and ‹111› directions in an fcc metal lattice.
D atom is located at the (a) O site and (b) T site. Wave functions are shown for the ground state (broken lines), first-excited states (solid lines) of the vibrational states of D atom at the O site, and ground state (broken line) at the T site. The distance from the original point of the O-site centre is scaled by the fcc lattice constant a (that is, 3.720 Å), which was obtained from the neutron diffraction profile observed at 988 K and 6.3 GPa.
Another possible origin of the T-site occupation is the intersite movement of the D atom by thermal activation. The potential barrier between the O and T sites along the ‹111› direction is ~0.3-eV high, allowing some migration of the D atom by thermal activation. Adding a deformation energy of 0.031 and 0.136 eV to the O-site ground-state energy (that is, 0.0025, eV) and T-site ground-state energy (that is, 0.117 eV), respectively19, yields an energy difference of 0.22 eV between the two sites, which agrees with the experimental value of 0.19 eV; the accuracy of the calculated energies is within 0.0001, eV. Similar calculation for the H atom provides the ground-state energies of 0.0378 (O site) and 0.1849, eV (T site), and the energy difference corrected for the deformation energies becomes 0.25 eV (data not shown). The energy difference of the H atom is close to that of the D atom, in spite of the significant difference in the wave function and, hence, in the site ground-state energies between H and D atoms.
Discussion
We have investigated the deuterization process of fcc-Fe and the occupation state of D atoms in fcc-FeDx at high temperatures and hydrogen pressures by in situ neutron diffraction measurements. Rietveld refinements of diffraction profiles reveal that D atoms predominantly occupy the octahedral interstitial sites (gD(O)=0.532), with slight occupancy of the tetrahedral interstitial site (gD(T)=0.056) in the equilibrium state of fcc FeDx achieved at 988 K and 6.3 GPa. Quantum-mechanical calculations show that the ground-state energy level of the D atoms at the T site is located 0.22 eV higher than that at the O site, and D atoms can move from the O site to the T site by thermal activation along the ‹111› direction of the fcc metal lattice, at high temperatures of ~1,000 K. The calculated energy difference of 0.22 eV is in agreement with an experimental value of 0.19 eV, which is derived from the site occupancy ratio of gD(T)/gD(O) using the Boltzmann distribution exp(–Δε/kBT). The occupation state of D atoms, including the intersite movement, in Fe metal provides an insight into the various properties of metal–hydrogen/deuterium systems such as H/D atom diffusion and phase stability of hydrides/deuterides.
Methods
Neutron diffraction measurements
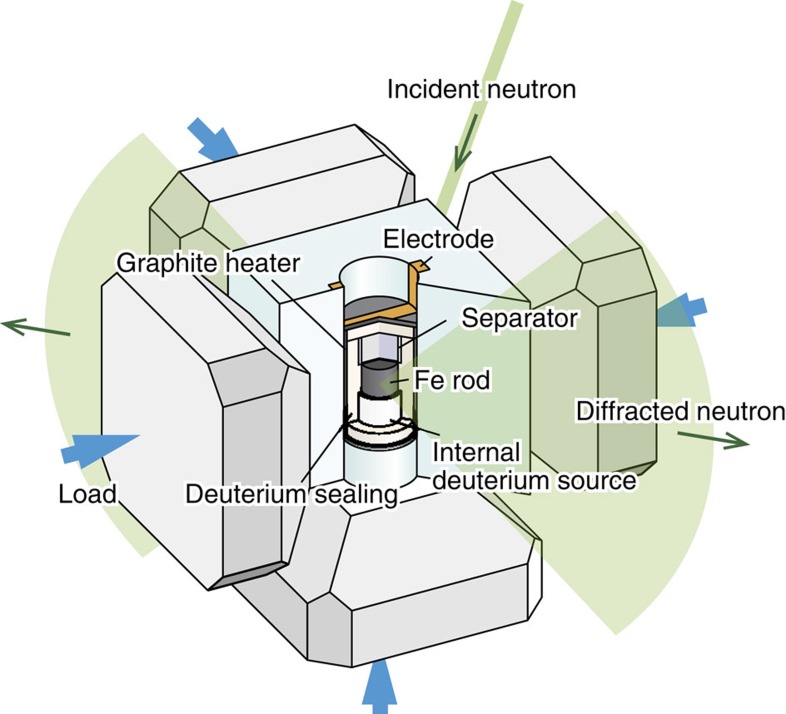
The experimental set-up for high-pressure neutron diffraction measurement is illustrated in Fig. 5. A high-pressure cell was designed based on the conventional design used for in situ X-ray diffraction22,23. An Fe rod specimen (3 mm in diameter and 2.5 mm in height) was placed at the centre of a deuterium-sealing capsule made of NaCl (5.5 mm in diameter and 8 mm in height) with internal deuterium sources of AlD3 pellets above and below. The NaCl capsule was inserted in a cylindrical graphite heater and embedded in a pressure-transmitting medium made of ZrO2 (17-mm-edge cube). The cell was compressed at ambient temperature to 7.4 GPa and then heated to 988 K at a rate of ~40 K per min in a six-axis multi-anvils press, each with a maximum load of 5,000 kN, equipped with an electric power supply system.
Figure 5. Schematic of a high-pressure cell and scattering geometry.
Schematic of a high-pressure cell containing a deuterium sealing NaCl capsule, in which an iron specimen reacts with the fluid deuterium produced by decomposition of the internal deuterium sources of AlD3 pellets. The NaCl capsule is inserted in a cylindrical graphite heater and embedded in a pressure-transmitting medium made of ZrO2. The cell was compressed with a six-axis multi-anvil press.
The AlD3 deuterium source decomposed upon heating, providing fluid deuterium to the iron specimen to initiate the deuterization reaction. The loading force of each six-axis was held at 1,300 kN during heating. However, the pressure in the NaCl capsule decreased to ~6.3 GPa on heating to 988 K. The sample pressure was estimated on the basis of the relation between the generated pressure and press load, which had been calibrated in advance by neutron diffraction measurement on a volume–pressure standard substance NaCl at pressures up to 10 GPa24. To estimate the sample pressure, besides the pressure calibration relation, we used the lattice constants of the Fe specimen and NaCl capsule derived from the observed diffraction profiles using the equations of state25,26,27. The sample temperature was estimated from the relation between the generated temperature and input electric power, calibrated with a Pt–Pt 13% Rh thermocouple.
Neutron-diffraction profiles were accumulated every 2 min during the heating process. The temporal evolution of the diffraction profile was monitored at several fixed temperatures above the deuterization-initiating temperature (~870 K). Finally, 1-h accumulated diffraction profile was taken at 988 K and 6.3 GPa for the structural refinement of fcc FeDx. The composition and site occupancy of D atom in the fcc-metal lattice of Fe was determined for the equilibrium state of fcc-FeDx at 988 K and 6.3 GPa. After reaching 988 K in the heating process at a fixed pressure, the temperature was kept constant and the temporal evolution of the diffraction profile was monitored to confirm that the solid solution of FeDx reached equilibrium with the surrounding D2 fluid (Supplementary Figs 1 and 2). The optical system and diagnostic method for neutron diffraction employed in the present study has been reported elsewhere13,14.
Quantum-mechanical calculations
We here describe the general formulation for calculating the self-trapped states of light interstitial atoms in a metal lattice. A system is supposed to consist of a light interstitial atom, here H or D, and N host metal atoms. The interstitial atom is assumed to follow the motion of the metal atoms adiabatically within the Born–Oppenheimer approximation. Therefore, the energy of the whole system can be written as
 |
where  is a set of displacements of metal atoms, EL is the interaction energy between metal atoms in the presence of the interstitial atom and Eα is the energy eigenvalue of the Schrödinger equation
 |
for the interstitial atom of mass M. The potential U in the Schrödinger equation can be given as the sum of two-body interaction potentials with surrounding metal atoms
 |
where Rm is the position of the mth atom and U0 is the potential of the O site in the unloaded lattice. It should be noted that the energy eigenvalue and the wave function depend on the displacements of the metal atoms. The equilibrium configuration for the adiabatic potential (equation (1)) is obtained taking the lowest value as a function of displacements of metal atoms
 |
This defines the self-trapped state, providing the wave function and energy eigenvalue for the interstitial atom. Here we assume the displacements of metal atoms because of self-trapped D (H) atoms to be appropriate values, and calculate the U by the equation (3). Using obtained U, we numerically solve the equation (2) and obtain the wave function and energy eigenvalue. The detailed procedure for the calculation has been published elsewhere21.
Author contributions
A.M., H.S., T.H., A.S.-F. and R.I. performed the high-pressure neutron diffraction experiment. H.S., N.E. and Y.K. developed the high-pressure cell for this experiment. A.M. analysed the neutron diffraction data. T.H. and A.S.-F. developed the high-pressure neutron diffractometer PLANET. H.Su performed the theoretical calculations. T.S., M.M. and S.O. prepared the AlD3. A.M., H.S and K.A. wrote the manuscript. K.A. directed this study.
Additional information
How to cite this article: Machida, A. et al. Site occupancy of interstitial deuterium atoms in face-centred cubic iron. Nat. Commun. 5:5063 doi: 10.1038/ncomms6063 (2014).
Supplementary Material
Supplementary Figures 1-4, Supplementary Table and Supplementary Methods
Acknowledgments
We thank T.D. Humphries, O. Yamamuro and T. Yagi for valuable discussions and comments on the manuscript. Neutron diffraction experiments were performed under proposal no. 2013I0011 in J-PARC. This work was supported by the Grants-in-aid for Scientific Research, Grant numbers 24241032 and 25220911 of Japan Society for the Promotion of Science.
References
- Fukai Y. The iron-water reaction and the evolution of the Earth. Nature 308, 174–175 (1984). [Google Scholar]
- Sakamaki K. et al. Melting phase relation of FeHx up to 20 GPa: Implication for the temperature of the Earth's core. Phys. Earth Planet In. 174, 192–201 (2009). [Google Scholar]
- Antonov V. E., Belash I. T. & Ponyatovsky E. G. T–P phase diagram of the Fe–H system at temperatures to 450°C and pressures to 6.7 GPa. Scr. Metal 16, 203–208 (1982). [Google Scholar]
- Fukai Y., Mori K. & Shinomiya H. The phase diagram and superabundant vacancy formation in Fe–H alloys under high hydrogen pressures. J. Alloy Compd. 348, 105–109 (2003). [Google Scholar]
- Sugimoto H. & Fukai Y. Solubility of hydrogen in metals under high hydrogen pressures: Thermodynamical calculations. Acta Metall. Mater. 40, 2327–2336 (1992). [Google Scholar]
- Badding J. V., Hemley R. J. & Mao H.-K. High-pressure chemistry of hydrogen in metals: in situ study of iron hydride. Science 253, 421–424 (1991). [DOI] [PubMed] [Google Scholar]
- Hiroi T., Fukai Y. & Mori K. The phase diagram and superabundant vacancy formation in Fe–H alloys revisited. J. Alloy Compd. 404–406, 252–255 (2005). [Google Scholar]
- Narygina O. et al. X-ray diffraction and Mössbauer spectroscopy study of fcc iron hydride FeH at high pressures and implications for the composition of the Earth's core. Earth Planet Sci. Lett. 307, 409–414 (2011). [Google Scholar]
- Antonov V. E. et al. High-pressure hydrides of iron and its alloys. J. Phys. Condens. Matter. 14, 6427–6445 (2002). [Google Scholar]
- Fukai Y. The Metal–Hydrogen System 2nd edn Springer-Verlag (2005). [Google Scholar]
- Pitt M. P. & Gray E. M. Tetrahedral occupancy in the Pd-D system observed by in situ neutron powder diffraction. Europhys. Lett. 64, 344–350 (2003). [Google Scholar]
- Antonov V. E., Belash I. T., Ponomarev B. K., Ponyatovskii E. G. & Thiessen V. G. Magnetic properties of hydrogen solid solutions in Fe–Ni–Mn alloys. Phys. Stat. Sol. (a) 52, 703–710 (1979). [Google Scholar]
- Hattori T. et al. BL11: Completion of high pressure neutron diffractometer PLANET. MLF Annual Report 2011 88–89 (2012). [Google Scholar]
- Hattori T. et al. BL11: performance of high pressure neutron diffractometer PLANET. MLF Annual Report 2012 96–97 (2013). [Google Scholar]
- Oishi R. et al. Rietveld analysis software for J-PARC. Nucl. Instrum. Methods Phys. Res. Sect. A 600, 94–96 (2009). [Google Scholar]
- Oishi-Tomiyasu R. et al. Application of matrix decomposition algorithms for singular matrices to the Pawley method in Z-Rietveld. J. Appl. Cryst. 45, 299–308 (2012). [Google Scholar]
- Klotz S., Le Godec Y., Strässle T. h. & Stuhr U. The α–γ–ε triple point of iron investigated by high pressure–high temperature neutron scattering. Appl. Phys. Lett. 93, 091904 (2008). [Google Scholar]
- Antonov V. E. et al. Neutron diffraction investigation of the dhcp and hcp iron hydrides and deuterides. J. Alloy Compd. 264, 214–222 (1998). [Google Scholar]
- Krimmel H., Schimmele L., Elsasser C. & Fahnle M. Self-trapped hydrogen states in metals determined from quantum mechanical calculations using potentials based on ab initio data: I. Hydrogen isotopes in Pd. J. Phys. Condens. Matter. 6, 7679–7704 (1994). [Google Scholar]
- Krimmel H., Schimmele L., Elsasser C. & Fahnle M. Self-trapped hydrogen states in metals determined from quantum mechanical calculations using potentials based on ab initio data: II. Hydrogen isotopes in Fe. J. Phys. Condens. Matter. 6, 7705–7714 (1994). [Google Scholar]
- Sugimoto H. & Fukai Y. Theory of light interstitials in bcc metals. I. Self-trapped state of hydrogen and muons in Nb. Phys. Rev. B 22, 670–679 (1980). [Google Scholar]
- Saitoh H. et al. In situ X-ray diffraction measurements of aluminum pulverization prior to the hydrogenation reaction. Mater. Trans. 52, 595–597 (2011). [Google Scholar]
- Fukai Y. & Okuma N. Evidence of copious vacancy formation in Ni and Pd under a high hydrogen pressure. Jpn J. Appl. Phys. 32, L1256–L1259 (1993). [Google Scholar]
- Decker D. L. High-pressure equation of state for NaCl, KCl, and CsCl. J. Appl. Phys. 42, 3239–3244 (1971). [Google Scholar]
- Brown J. M. The NaCl pressure standard. J. Appl. Phys. 86, 5801–5808 (1999). [Google Scholar]
- Nishihara Y. et al. Isothermal compression of face-centered cubic iron. Am. Mineral 97, 1417–1420 (2012). [Google Scholar]
- Tsujino N. et al. Equation of state of γ-Fe: Reference density for planetary cores. Earth Planet Sci. Lett. 375, 244–253 (2013). [Google Scholar]
- Westlake D. G. Site occupancies and stoichiometries in hydrides of intermetallic compounds: geometric considerations. J. Less Common Met. 90, 251–273 (1983). [Google Scholar]
Associated Data
This section collects any data citations, data availability statements, or supplementary materials included in this article.
Supplementary Materials
Supplementary Figures 1-4, Supplementary Table and Supplementary Methods


