Abstract
Introduction
Theoretical knowledge of carbon nanotube clearance in the human respiratory tract represents an essential contribution to the risk assessment of artificial airborne nanomaterials. Thus, single phases of nanotube clearance were simulated with the help of a theoretical model.
Methods
In this study, clearance of single-walled carbon nanotubes (SWCNT) and multi-walled carbon nanotubes (MWCNT) was simulated by using a validated mathematical approach that includes all clearance mechanisms known hitherto. Fast mucociliary clearance is approximated by a steady-state steady-flow mucus model, whereas slow clearance mechanisms are modeled by definition of related clearance half-times.
Results
Clearance may be subdivided into three phases, including fast bronchial clearance (mucociliary escalator), slow bronchial clearance (particle uptake by airway macrophages, transcytosis), and alveolar clearance (phagocytosis by alveolar macrophages, endocytosis by alveolar epithelium). According to the clearance model used in this study, mucociliary clearance is completed within the first 24 h after exposure, whereas slow bronchial clearance is characterized by a half-time of 5 d. Alveolar clearance is marked by half-times >100 d. As a result of their different deposition patterns, SWCNT and MWCNT show some discrepancies with regard to their clearance insofar as long SWCNT reside significantly longer in the lungs than MWCNT. This circumstance is among other expressed by higher 24-h, 10-d, and 100-d retentions computed for SWCNT compared to MWCNT.
Discussion and conclusions
Due to their partly high residence times in distal lung regions, carbon nanotubes may bear the potential to act as triggers of inflammatory reactions or fibrotic modifications of the lung structure. Further they may also induce malignant transformations of lung cells, resulting in the development of lung tumours.
Keywords: Clearance model, deposition, single-walled carbon nanotubes (SWCNT), multi-walled carbon nanotubes (MWCNT), clearance mechanisms
Introduction
As soon as inhaled particles are deposited in the respiratory tract, they undergo a sequence of site-specific clearance mechanisms. Aerosol particles accumulated in the conducting airways of the tracheobronchial tree are mainly cleared by the ‘mucociliary escalator’ within 24 h after exposure. Particles deposited in the acinar ducts and alveoli are subject to slower clearance mechanisms, including phagocytic activity of macrophages and endocytosis by epithelial cells (1-5). As demonstrated by aerosol bolus experiments resulting in a carefully directed deposition of radioactively labelled particles in proximal and distal parts of the lungs (6,7), clearance from the ciliated airways is partly characterized by slower mechanisms than particle transport on the mucus layer. Further experimental and theoretical studies yielded evidence that this so-called slow bronchial clearance has a half-time ranging from 5 to 20 days. Additionally, the fraction of particles cleared in this way correlates linearly with the mean geometric particle diameter, with smaller particles having a higher probability to undergo slow bronchial clearance than larger particles (8-11). In the meantime, main clearance processes in the lungs were decoded and appropriately estimated with regards to their efficiency and duration (Figure 1). This was, among other, achieved by the application of state-of-the-art clearance models, which have undergone numerous processes of refinement during the past three decades (10,11,13-16). Modern clearance models like that introduced by Sturm and Hofmann (10) as well as Hofmann and Sturm (14) enable the computation of individual particle clearance paths in a stochastic lung structure and also consider the behaviour of the mucus sheet at airway bifurcations or the thickness and continuity of this layer and their effects on mucus velocity and the fraction of slowly cleared particulate mass.
Figure 1.
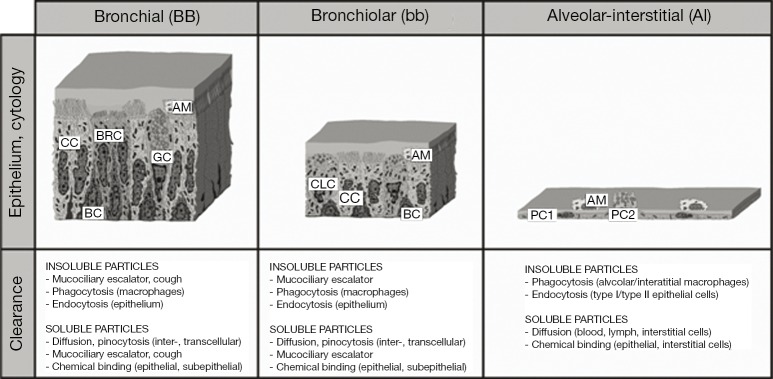
Morphology, cytology, and main clearance mechanisms in single lung compartments. Nomenclature of the lung regions was carried out according to the suggestions of the ICRP (12). AM, airway/alveolar macrophage; BC, basal cell; BRC, brush cell; CC, ciliated cell; CLC, clara cell; GC, goblet cell; PC1, pneumocyte type 1; PC2, pneumocyte type 2.
Although current clearance approaches allow highly accurate predictions regarding the removal of particulate substances from specific compartments of the respiratory tract, most of them are limited to the assumption of spherical particle geometry (10,11,13-16). According to our present knowledge, this modeling simplification is only justified for mucociliary clearance, where particles of arbitrary shape are captured on the mucus layer lining the inner wall of the bronchial epithelium and are subsequently transported towards the trachea (17-19). As outlined by Sturm and Hofmann (20) for fibrous particles of variable size, slow bronchial clearance depends not only on particle size, commonly expressed by the aerodynamic diameter (21), but also on particle shape. Particles characterized by high anisometry (e.g., one longer dimension and two shorter dimensions) show a behaviour concerning their uptake by airway macrophages, their endocytosis by epithelial cells or their temporary storage in the interciliary space, which may differ significantly from that of spheres. Similar discrepancies of particle clearance may be attested for the non-ciliated lung compartments (acinar ducts and alveoli). Based upon numerous experimental studies with laboratory animals (22-25), fibrous particles with cylindrical diameters <100 nm and aspect ratios >100 have the ability to penetrate to the alveoli, where they disappear from any clearance processes for an undefined period of time due to their partly extreme length. Biopersistent fibers may be the target of “frustrated phagocytosis” (i.e., phagocytosis by more than one macrophage) or may be stored in the parenchyma, where they unfold their unwholesome efficacy (26).
Carbon nanotubes represent a specific category of anisometric particles due to a number of reasons: first, they are of artificial origin; second, they belong to those ultrafine constituents with highly increased inhalability; and third, they are characterized by maximal biopersistence. Carbon nanotubes may be subdivided into single-walled carbon nanotubes (SWCNT) consisting of a single graphite cylinder and multi-walled carbon nanotubes (MWCNT), which are composed of several concentric carbon cylinders (27). SWCNT commonly range in diameter from 5 to 10 nm, whereas MWCNT may reach diameters between 50 and 100 nm (Figure 2). Both types of nanotubes may develop aspect ratios (i.e., the ratios of particle lengths to particle diameters) ranging from 100 to 1,000 (28). Due to all the properties noted above, nanotubes have been considered as serious health hazards in the past decade. Based on numerous comparative studies, health risk assessments for nanotubes have been discussed (29). Meanwhile, there exist several theoretical studies dealing with the deposition of SWCNT and MWCNT in the human respiratory tract (30,31). According to these modeling predictions MWCNT have a greater potential to undergo alveolar deposition than SWCNT, which are filtered in high amounts in the extrathoracic airways and main bronchi. Concerning the clearance of carbon nanotubes, experiments with rats suggest a preferred removal of this ultrafine particulate matter towards the lymph nodes (22-25). Theoretical data describing the clearance of nanotubes in the human lungs are only available in scarce amounts hitherto (20). The present contribution attempts to overcome this deficit by providing comprehensive clearance computations for SWCNT and MWCNT, which are based upon a multi-validated mathematical approach.
Figure 2.
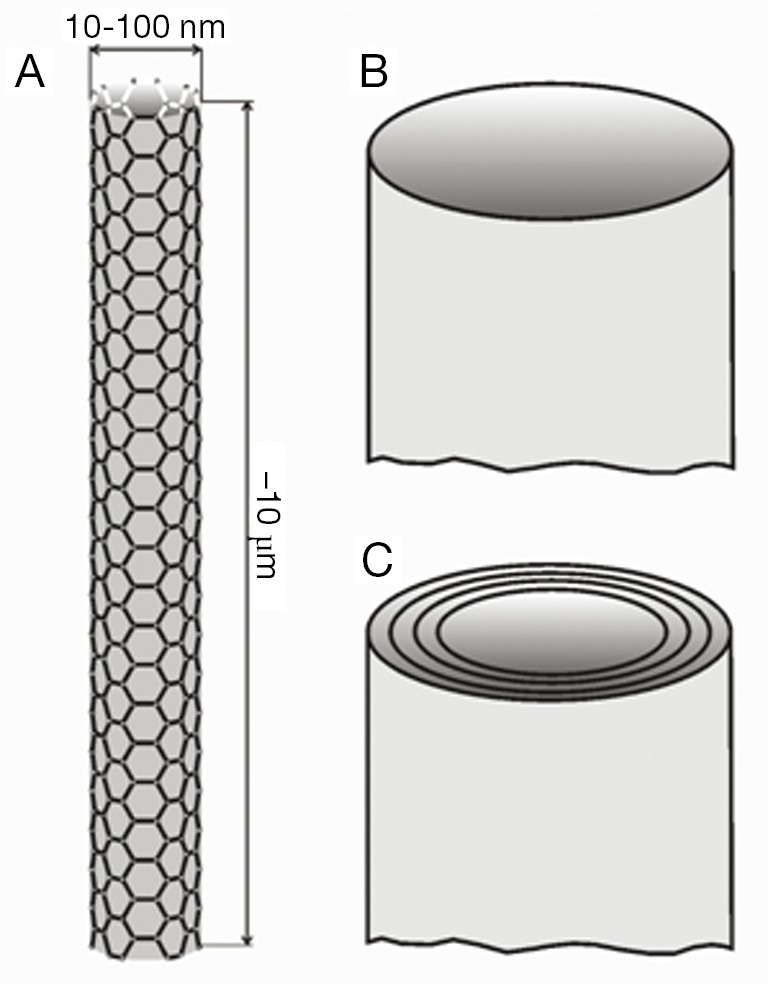
Structure of carbon nanotubes composed of single or numerous graphite sheets: (A) basic structure illustrating the length-per-diameter ratio of single particles; (B) single-wall carbon nanotube; (C) multi-wall carbon nanotube.
Materials and methods
Simulation of nanotube clearance
According to earlier scientific contributions published by the author and other people working on this field (14-16,32,33), mucociliary clearance in the tracheobronchial tree may be appropriately modelled by making the following assumptions: first, the mucus layer lining the inner wall of the ciliated airways is supposed to have constant thickness throughout the entire airway network; second, movement of the mucus layer and the particles captured therein is believed to take place with a constant velocity through a given airway tube; third, mucus production is limited to the terminal bronchioles and is carried out there with constant rates; fourth, thickness of the mucus layer is negligibly small with respect to the thickness of the airway tissue. In a given airway bifurcation, which consists of a parental and two daughter tubes, mucus flow rates may be defined as follows (32):
| QP=QD1+QD2 | [1] |
In Eq. [1], QP denotes the flow rate of mucus in the parental tube, whereas QD1 and QD2 represent the mucus flow rates in the daughter tubes. In general, the mucus flow rate is connected with mucus velocity (v), cross-sectional area of the mucus layer in an airway tube (A), and airway diameter (d) by the following mathematical expression:
| Q=V/t=v∙A=v∙(d∙mt–mt2) | [2] |
In the formula noted above, V, t and mt, respectively, denote the mucus volume in the airway tube, the time needed by this mucus volume to pass the airway, and the thickness of the mucus blanket. Based on the four assumptions stated above, Eq. [2] may be simplified by neglecting the term mt2, so that we come to the following result:
| vP∙dP=vD1∙dD1+vD2∙dD2 | [3] |
The subscripta in this formula are the same as those used in Eq. [1]. In the terminal bronchioles, mucus velocities (vT) are assumed to adopt a constant value, which by re-arrangement of Eq. [3] leads to the basic model formula,
| vT=v0∙d0/∑i=1–Ndi | [4] |
where v0 represents the experimentally derived mucus velocity in the trachea, d0 is the tracheal diameter, di the diameter of the i-th terminal airway, and N the total number of terminal bronchioles. Calculation of the mucus velocity in the terminal bronchioles according to Eq. [4] is followed by the computation of respective mucus velocities in the airway tubes preceding the terminal bronchioles, thereby using Eq. [3]. This procedure is continued, until the main bronchi (airway generation 2) are reached. At the end, mucus velocities for the entire tracheobronchial tree should be available. Once the mucus velocities are calculated for the whole airway network, residence time, tr, of particulate mass in a given airway may be obtained from the formula,
| tr=l/v | [5] |
where l is the length of the bronchial tube.
For modeling slow bronchial clearance, the fraction of deposited particles affected by this clearance process (fs) is computed for each airway generation according to the simple regression formula.
| fs=0.72–0.12∙dg | [6] |
In the equation stated above, dg originally denotes the (mean) geometric diameter of spherical particles being captured on the bronchial airway walls (8-10). For particles, whose shapes may be approximated by spheres, dg may be substituted by the aerodynamic diameter (dae). In the case of nanotubes, being characterized by an extreme deviation from spherical geometry, effective diameter used for Eq. [6] is calculated according to the formula,
| d= (dcyl+β∙dcyl)/2 | [7] |
with dcyl and β, respectively, representing the cylindrical diameter and the aspect ratio of the nanotubes. Within each bronchial airway tube, slowly cleared particle fractions are exponentially decreased, thereby following the mathematical expression,
| fs(t) = fs(0)∙e–λ∙t | [8] |
where fs(t) is the slowly cleared fraction retained in the airway at the time t, fs(0) is the slowly cleared fraction directly after particle deposition, λ is the rate constant of the slow clearance process (s–1), and t is the time in seconds. It is assumed that slow bronchial clearance has a mean half-time of 10 days (=864,000 s), so that λ adopts a mean value of 8.02∙10–7 s–1.
Computation of alveolar clearance requires the knowledge of that nanotube fraction being deposited in the alveolar structures (fa). This fraction is estimated by using a stochastic particle transport and deposition model (IDEAL v. 6) (34). Similar to slow bronchial clearance, removal of nanotubes from the alveoli is thought to take place according to an exponential function of the form,
| fa(t) =fa(0)∙e–µ∙t | [9] |
with fa(t) denoting the particle fraction retained in the alveoli at the time t, fa(0) representing the initial alveolar particle fraction, and µ being the rate constant of the alveolar clearance process (s–1). Based on previous recommendations (9,10,12), alveolar clearance of nanotubes is characterized by a (mean) half-time of 100 days (=8,640,000 s), resulting in a mean value for µ of 8.02×10⁻⁸ s–1.
Modeling parameters
Nanotube clearance modeling was conducted by assuming a mean tracheal mucus velocity of 15 mm∙min–1 (=0.25 mm∙s–1) in adults (1,12,35). Depending on the cylindrical diameter and aspect ratio assumed for modeling, aerodynamic diameter of SWCNT commonly ranges from 5 to 15 nm, whereas aerodynamic diameter of MWCNT varies between 50 and 150 nm. In this study deposition and clearance computations were limited to ultrafine particulate matter with dae not exceeding 100 nm. Theoretical predictions were carried out for adult lungs (FRC =3,300 mL) and two different breathing scenarios (12): Besides sitting breathing, being characterized by a tidal volume of 750 mL and a breath-cycle time of 4.2 s (breath-hold time: 1 s), light-work breathing with a tidal volume of 1,250 mL and a breath-cycle time of 3 s (no breath-hold) was selected.
Results
Deposition of nanotubes in the human respiratory tract
Concerning nanotube deposition in the human respiratory tract, respective modeling predictions are summarized in Figure 3. Under sitting breathing conditions, SWCNT are marked by a total deposition (i.e., inhaled particle fraction-exhaled particle fraction) ranging from 45% (dae =15 nm) to 66% (dae =5 nm), whereas total deposition of MWCNT commonly adopts values <25% (Figure 3A). With regard to SWCNT, tubular deposition (i.e., deposition in the thoracic airway structures of the respiratory system) amounts to 35-55%, and alveolar deposition takes values between 4% and 9%. The remaining particle fraction (2-8%) has to be assigned to extrathoracic deposition (i.e., deposition in the nasal or oral air passages). In the case of MWCNT, tubular deposition amounts to <15%, alveolar deposition to <8%, and extrathoracic deposition to about 2%. Increase of the inhalative flow rate due to the switch from sitting to light-work breathing has only slight consequences for the deposition of nanotubes in the human respiratory tract (Figure 3B). Independent of the assumed particle category, total deposition is generally subject to a 2%-increase. SWCNT are deposited in higher amounts in the alveoli, whereas tubular and extrathoracic depositions are reduced by several percent. MWCNT, on the other hand, exhibit an increased tubular and alveolar deposition, but a declined deposition in the extrathoracic structures.
Figure 3.
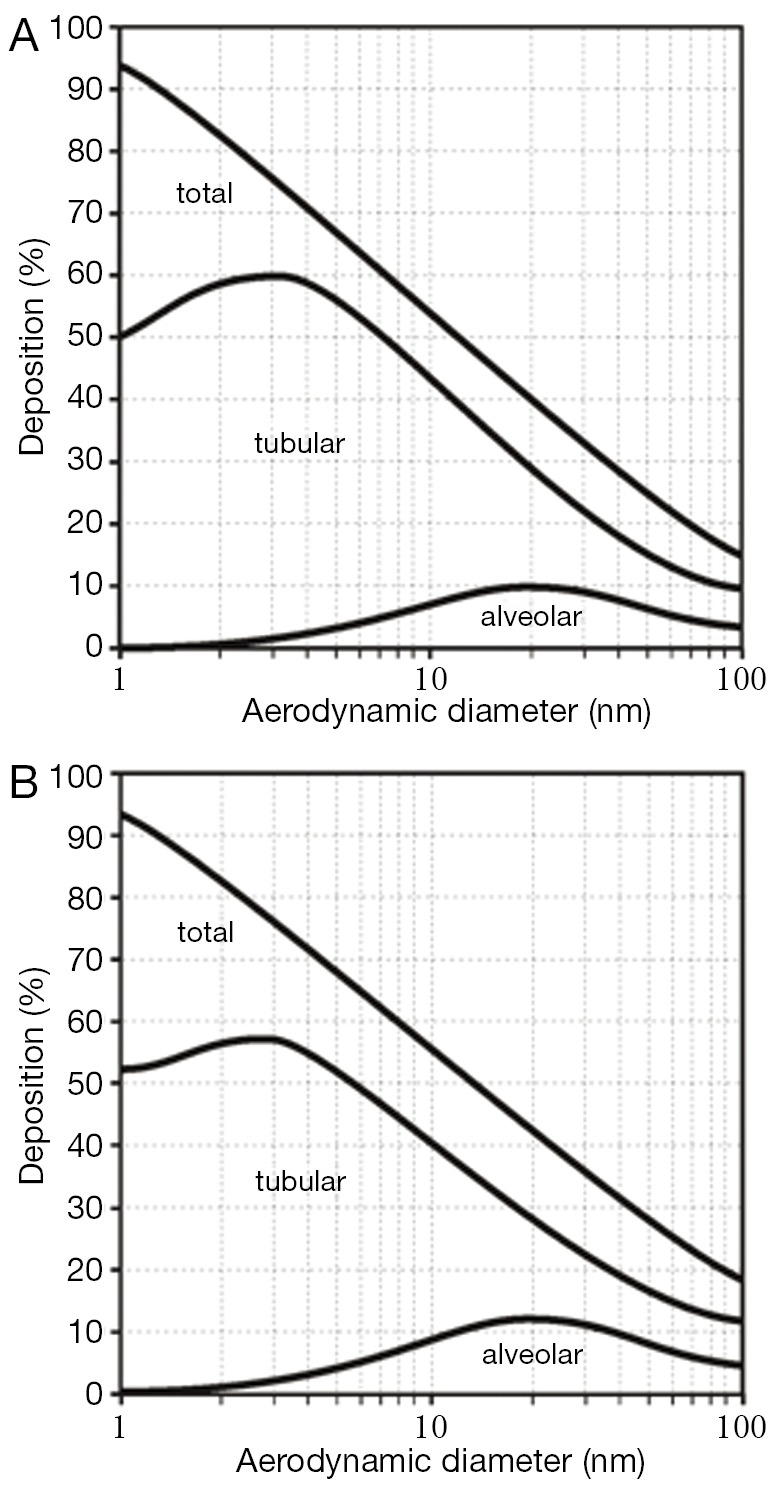
Deposition (total, tubular, alveolar) of ultrafine particles with aerodynamic diameters ranging from 1 to 100 nm in the human respiratory tract: (A) sitting breathing; (B) light-work breathing.
Clearance of nanotubes from the human respiratory tract
As a standard procedure of theoretical clearance computations (8-11), efficiency of particle removal from the respiratory system is expressed in terms of 24-h retention (fraction of particles retained in the lungs after 24 h), 10-d, and 100-d retention (retained particle fractions after 10 d and 100 d). After particle deposition resulting from sitting breathing (see above), about 75-82% of the deposited SWCNT are still captured in the respiratory tract 24 h after exposure. This value is decreased to 59-66% during the following 9 d. After 100 d, still 30-33% of the initially deposited particulate mass may be found in the lungs. For MWCNT, 24-h retention commonly adopts values <78%, whereas 10-d retention amounts to <60%. After 100 d, particulate mass stored in the lungs is reduced to <27% (Figure 4A). Change of the breathing conditions and related modification of nanotube deposition results in an increase of all retention values by at least 5% due to higher particle presence in the alveoli (Figure 4B).
Figure 4.
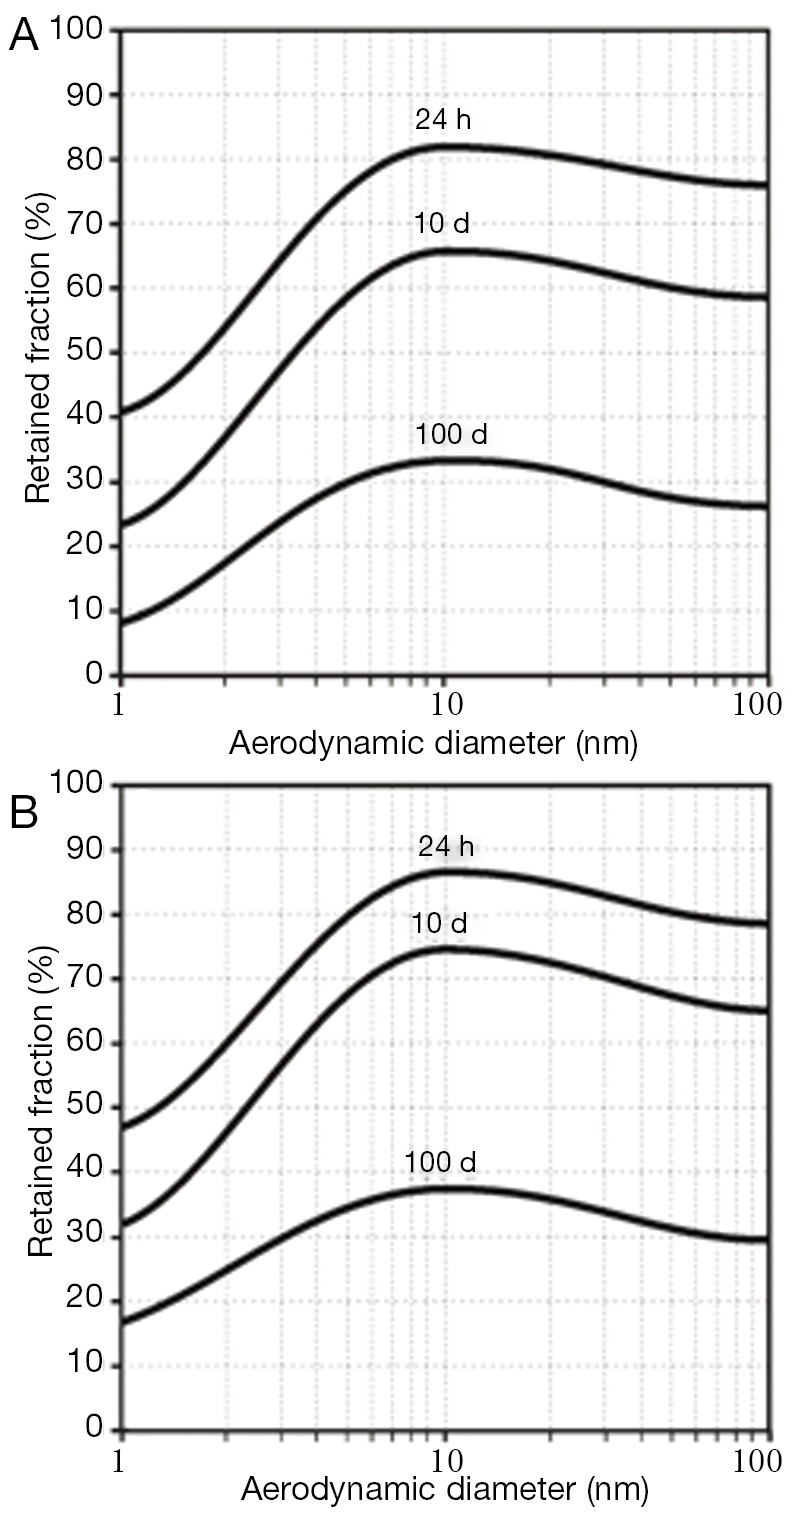
Dependence of 24-h retention (i.e., particle fraction retained in the lungs after 24 h), 10-d retention, and 100-d retention on size of the deposited particles (size range: 1-100 nm): (A) clearance following particle deposition after sitting breathing; (B) clearance following particle deposition after light-work breathing.
Individual particle retention curves for SWCNT with a mean aerodynamic diameter of 10 nm and MWCNT with a mean aerodynamic diameter of 100 nm are illustrated in Figure 5. The graphs allow a clear distinction between fast clearance processes, taking place within the first 24 h after nanotube deposition, and slow clearance processes, gaining significance in the following time period. Independent of the breathing scenario, SWCNT require a longer time span to be completely cleared from the lungs than MWCNT. Slow bronchial clearance is expressed by a mean clearance rate of 1% per day, whereas mean alveolar clearance rate adopts values of <0.1% per day.
Figure 5.
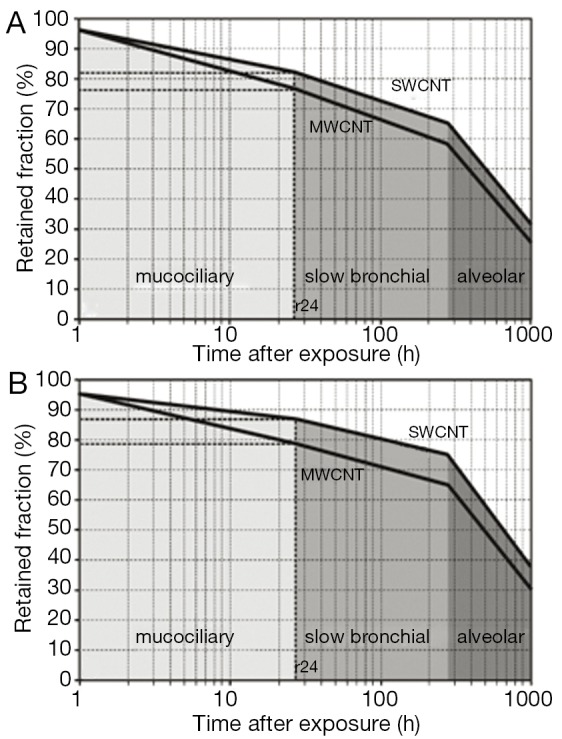
Course of clearance with its single clearance phases computed for average SWCNT (dae =10 nm) and average MWCNT (dae =100 nm): (A) clearance following particle deposition after sitting breathing; (B) clearance following particle deposition after light-work breathing. SWCNT, single-walled carbon nanotubes; MWCNT, multi-walled carbon nanotubes.
Discussion and conclusions
Future evaluation of the risk emanating from a possible inhalation of nanotubes has to consider both deposition and clearance scenarios of these particles. In the meantime, it is a well-known fact that carbon nanotubes and especially MWCNT possess the potential to be accumulated in high amounts in the pulmonary region of the respiratory tract (20,30,31). The alveolar deposition probability, however, exhibits a positive correlation with the inhalative flow rate or, in other words, the more air volume is inspired within a given time, the higher is the number of nanoparticles deposited in the outermost lung structures. Since Brownian motion represents the main drag force emerging particles of the nanoscale, deposition probability may be interpreted as the result of an interaction between axial particle transport by the air stream and radial particle diffusion (12,20,21,34). Low flow velocities of the inhaled air enable particles to cover longer radial distances of diffusion in the upper lung airways, increasing their deposition probabilities at these specific sites. High air flow velocities, on the other hand, provide a chance to the particles to cover long axial transport distances and to be, finally, deposited in the peripheral lung airways and alveoli (12).
Once deposited on the epithelial walls of the lung airways and alveoli, nanotubes are subject to various clearance processes, which commonly contribute to a minimization of the pulmonary particle burden. In the upper lung parts, clearance of deposited nanoparticles is mainly accomplished by the mucociliary escalator, whose efficiency is influenced to a certain extent by particle size (1-6,20). Any effects of particle shape on this fast clearance mechanism have been theoretically discussed by Sturm and Hofmann (20) and play a noticeable role for particles with one dimension exceeding 1 µm. Carbon nanotubes adopting a length of 10 µm show a mucociliary clearance behaviour, which is different to that of shorter fibers. Although experimental data regarding this essential question are not available hitherto, similar studies investigating asbestos fibers in rats could demonstrate that long fibers may be subject to enhanced residence times in the bronchial airways (22,23). Due to their specific geometry, fibers may be able to penetrate the mucus layer at sites of enhanced air stream and particle velocity. Penetration of the mucus sheet may result in a temporary storage of the fibrous material in the periciliary layer or in an uptake of the material by various lung cells (31).
The highest hazardous potential of nanotubes is given by their noticeable deposition in the alveolar compartment. Due to the nonexistence of a fast clearance phase in this part of the respiratory tract, nanoparticles are subject to prolonged residence times. These times are additionally influenced by the aspect ratio of the deposited nanotubes, whereby highest resistance to any alveolar clearance processes may be attested for particles exceeding a length of 10 µm (23-25). This phenomenon is mainly due to the fact that alveolar macrophages may be only able to engulf particles, whose dimensions are smaller than the dimensions of the clearance cells themselves (1,3,19,26). Extremely long particles are partly occupied by several macrophages, which may result in a fracture of the particulate material and its subsequent phagocytosis or, in the case of enhanced particle biopersistence, in a transport towards the ciliated lung airways or into the subepithelial tissue (12,19).
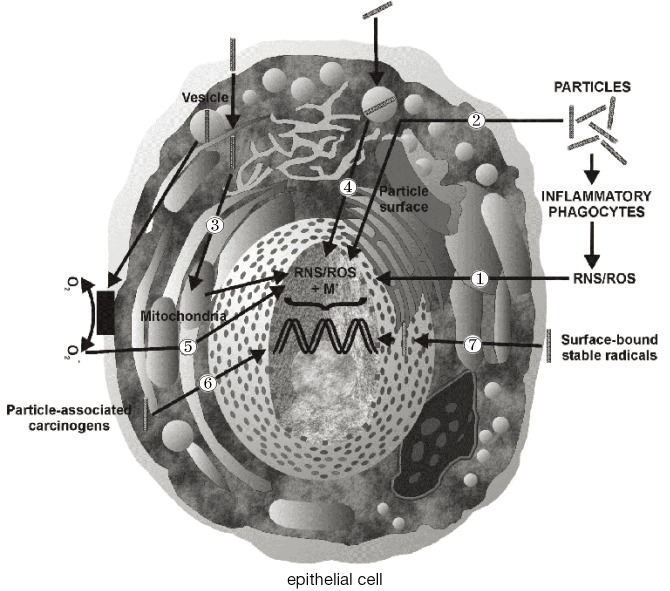
Currently, essential biological mechanisms standing behind the carcinogenicity of inhaled particles have been determined by comprehensive experimental work. In the studies, particle types such as asbestos fibers have been adopted as model substances for investigating mechanisms of carcinogenesis in vivo and in vitro (12,23). As outlined by the laboratory studies, particles such as those introduced above are supposed to impact on both genotoxicity and cell proliferation due to their ability to generate oxidants like reactive oxygen species (ROS) and reactive nitrogen species (RNS) (36-39). Production of these cell-modifying oxidants may be induced by specific properties of the deposited particles themselves (e.g., physicochemical characteristics of the particle surface; Figure 6, No. 2), thus representing an acellular process. On the other hand, a deposited particulate mass may possess the ability to stimulate intracellular oxidant generation via various signal cascades (Figure 6, No. 3-5). Another essential pathway of ROS and RNS production, which is of considerable interest with regards to the genotoxicity of fibrous materials, includes inflammatory processes, which are induced by cell injuries in connection with particle impaction (Figure 6, No. 1). As another possible mechanism of particle carcinogenesis, the ability of inhaled particulate matter to carry surface-adsorbed cancer-inducing substances (e.g., radionuclides) or radicals into the HRT has to be mentioned (Figure 6, No. 6/7).
Figure 6.
Effects of carbon nanotubes on epithelial cells of the bronchial/bronchiolar airways and alveoli: ① extracellular ROS/RNS production by inflammatory processes; ② ROS/RNS production induced by particle properties (e.g., particle surface); ③ ROS/RNS production resulting from the interaction between particles and cell compartments; ④ particle-induced release of soluble metals into the cell; ⑤ ROS/RNS production by particle-induce oxidation and subsequent signal cascades; ⑥ transport of carcinogens associated with the inhaled particles; ⑦ transport of surface-bound stable radicals into the cell (36-39). ROS, reactive oxygen species; RNS, reactive nitrogen species.
From the results of this study it may be concluded that inhalation of nanotubes bears certain health risks, which positively correlate with the particle dose accumulated in the alveolar lung region. According to the theoretical computations presented here, long SWCNT have a higher probability of alveolar deposition than MWCNT.
Acknowledgements
Disclosure: The author declares no conflict of interest.
References
- 1.Wolff RK. Mucociliary Function. In: Parent RA. eds. Comparative Biology of the Normal Lung. Boca Raton, FL: CRC Press, 1992:659-80. [Google Scholar]
- 2.Yeates DB, Gerrity TR, Garrard CS. Characteristics of tracheobronchial deposition and clearance in man. Ann Occup Hyg 1982;26:245-57. [PubMed] [Google Scholar]
- 3.Oberdörster G.Lung clearance of inhaled insoluble and soluble particles. J Aerosol Med 1988;1:289-330 [Google Scholar]
- 4.Albert RE, Arnett LC. Clearance of radioactive dust from the human lung. AMA Arch Ind Health 1955;12:99-106. [PubMed] [Google Scholar]
- 5.Brain JD, Gehr P, Kavet RI. Airway macrophages. The importance of the fixation method. Am Rev Respir Dis 1984;129:823-6. [DOI] [PubMed] [Google Scholar]
- 6.Scheuch G, Stahlhofen W, Heyder J.An approach to deposition and clearance measurements in human airways. J Aerosol Med 1996;9:35-41. [DOI] [PubMed] [Google Scholar]
- 7.Stahlhofen W, Gebhart J, Rudolf G, et al. Measurement of lung clearance with pulses of radioactivity-labelled aerosols. J Aerosol Sci 1986;17:333-6 [Google Scholar]
- 8.Stahlhofen W, Koebrich R, Rudolf G, et al. Short-term and long-term clearance of particles from the upper human respiratory tract as function of particle size. J Aerosol Sci 1990;21:S407-10 [Google Scholar]
- 9.Sturm R, Hofmann W, Scheuch G, et al. Particle clearance in human bronchial airways: Comparison of stochastic model predictions with experimental data. Ann Occ Hyg 2002;46:329-33 [Google Scholar]
- 10.Sturm R, Hofmann W.Mechanistic interpretation of the slow bronchial clearance phase. Radiat Prot Dosimetry 2003;105:101-4. [DOI] [PubMed] [Google Scholar]
- 11.Lee PS, Gerrity TR, Hass FJ, et al. A model for tracheobronchial clearance of inhaled particles in man and a comparison with data. IEEE Trans Biomed Eng 1979;26:624-30. [DOI] [PubMed] [Google Scholar]
- 12.International Commission on Radiological Protection (ICRP). Human respiratory tract model for radiological protection. Publication 66. Ann. ICRP 24. Québec: Pergamon Press, 1994. [PubMed] [Google Scholar]
- 13.Yu CP, Hu JP, Yen BM, et al. Models for mucociliary particle clearance in lung airways. In: Lee SD, Schneider T, Grant LD, et al. eds. Aerosols: Research, risk assessment and control strategies. Chelsea: MI, Lewis, 1986:569-78. [Google Scholar]
- 14.Hofmann W, Sturm R.Stochastic model of particle clearance in human bronchial airways. J Aerosol Med 2004;17:73-89. [DOI] [PubMed] [Google Scholar]
- 15.Sturm R, Hofmann W.A multi-compartment model for slow bronchial clearance of insoluble particles--extension of the ICRP human respiratory tract models. Radiat Prot Dosimetry 2006;118:384-94. [DOI] [PubMed] [Google Scholar]
- 16.Sturm R.A computer model for the clearance of insoluble particles from the tracheobronchial tree of the human lung. Comput Biol Med 2007;37:680-90. [DOI] [PubMed] [Google Scholar]
- 17.Gehr P, Geiser M, Im Hof V, et al. Surfactant and inhaled particles in the conducting airways: structural, stereological, and biophysical aspects. Microsc Res Tech 1993;26:423-36. [DOI] [PubMed] [Google Scholar]
- 18.Geiser M, Cruz-Orive LM, Im Hof V, et al. Assessment of particle retention and clearance in the intrapulmonary conducting airways of hamster lungs with the fractionator. J Microsc 1990;160:75-88. [DOI] [PubMed] [Google Scholar]
- 19.Gradoń L, Podgórski A.Kinetics of particle retention in the human respiratory tract. Ann Occup Hyg 1991;35:249-59. [DOI] [PubMed] [Google Scholar]
- 20.Sturm R, Hofmann W.A theoretical approach to the deposition and clearance of fibers with variable size in the human respiratory tract. J Hazard Mater 2009;170:210-8. [DOI] [PubMed] [Google Scholar]
- 21.Hinds WC. eds. Aerosol technology: properties, behavior, and measurement of airborne particles. John Wiley: New York, 1999. [Google Scholar]
- 22.Lippmann M.Effects of fiber characteristics on lung deposition, retention, and disease. Environ Health Perspect 1990;88:311-7. [DOI] [PMC free article] [PubMed] [Google Scholar]
- 23.Hesterberg TW, Hart GA. Synthetic vitreous fibers: a review of toxicology research and its impact on hazard classification. Crit Rev Toxicol 2001;31:1-53. [DOI] [PubMed] [Google Scholar]
- 24.Warheit DB, Laurence BR, Reed KL, et al. Comparative pulmonary toxicity assessment of single-wall carbon nanotubes in rats. Toxicol Sci 2004;77:117-25. [DOI] [PubMed] [Google Scholar]
- 25.Aiso S, Kubota H, Umeda Y, et al. Translocation of intratracheally instilled multiwall carbon nanotubes to lung-associated lymph nodes in rats. Ind Health 2011;49:215-20. [DOI] [PubMed] [Google Scholar]
- 26.Sturm R.A computer model for the simulation of fiber-cell interaction in the alveolar region of the respiratory tract. Comput Biol Med 2011;41:565-73. [DOI] [PubMed] [Google Scholar]
- 27.Hoegberg SM. eds. Modeling Nanofiber Transport and Deposition in Human Airways. Universitetstryckeriet: Luleå, 2010. [Google Scholar]
- 28.Donaldson K, Aitken R, Tran L, et al. Carbon nanotubes: a review of their properties in relation to pulmonary toxicology and workplace safety. Toxicol Sci 2006;92:5-22. [DOI] [PubMed] [Google Scholar]
- 29.Poland CA, Duffin R, Kinloch I, et al. Carbon nanotubes introduced into the abdominal cavity of mice show asbestos-like pathogenicity in a pilot study. Nat Nanotechnol 2008;3:423-8. [DOI] [PubMed] [Google Scholar]
- 30.Sturm R.A theoretical approach to the deposition of cancer-inducing asbestos fibers in the human respiratory tract. TOLCJ 2009;2:1-11 [Google Scholar]
- 31.Sturm R.Deposition and cellular interaction of cancer-inducing particles in the human respiratory tract: Theoretical approaches and experimental data. Thorac Cancer 2010;1:141-52 [DOI] [PubMed] [Google Scholar]
- 32.Asgharian B, Hofmann W, Miller FJ. Mucociliary clearance of insoluble particles from the tracheobronchial airways of the human lung. J Aerosol Sci 2001;32:817-32 [Google Scholar]
- 33.Sturm R, Hofmann W.Stochastic modeling predictions for the clearance of insoluble particles from the tracheobronchial tree of the human lung. Bull Math Biol 2007;69:395-415. [DOI] [PubMed] [Google Scholar]
- 34.Koblinger L, Hofmann W.Monte Carlo modeling of aerosol deposition in human lungs. Part I: Simulation of particle transport in a stochastic lung structure. J Aerosol Sci 1990;21:661-74 [Google Scholar]
- 35.Mauderly JL, Hahn FF. Advances in Veterinary Science and Comparative Medicine: The Respiratory System. Vol. 26. New York: Academic Press, 1982. [PubMed] [Google Scholar]
- 36.Fubini B, Hubbard A.Reactive oxygen species (ROS) and reactive nitrogen species (RNS) generation by silica in inflammation and fibrosis. Free Radic Biol Med 2003;34:1507-16. [DOI] [PubMed] [Google Scholar]
- 37.Deshpande A, Narayanan PK, Lehnert BE. Silica-induced generation of extracellular factor(s) increases reactive oxygen species in human bronchial epithelial cells. Toxicol Sci 2002;67:275-83. [DOI] [PubMed] [Google Scholar]
- 38.Dellinger B, Pryor WA, Cueto R, et al. Role of free radicals in the toxicity of airborne fine particulate matter. Chem Res Toxicol 2001;14:1371-7. [DOI] [PubMed] [Google Scholar]
- 39.Voelkel K, Krug HF, Diabaté S. Formation of reactive oxygen species in rat epithelial cells upon stimulation with fly ash. J Biosci 2003;28:51-5. [DOI] [PubMed] [Google Scholar]


