Abstract
The orientation of cardiac fibers affects the anatomical, mechanical, and electrophysiological properties of the heart. Although echocardiography is the most common imaging modality in clinical cardiac examination, it can only provide the cardiac geometry or motion information without cardiac fiber orientations. If the patient’s cardiac fiber orientations can be mapped to his/her echocardiography images in clinical examinations, it may provide quantitative measures for diagnosis, personalized modeling, and image-guided cardiac therapies. Therefore, this project addresses the feasibility of mapping personalized cardiac fiber orientations to three-dimensional (3D) ultrasound image volumes. First, the geometry of the heart extracted from the MRI is translated to 3D ultrasound by rigid and deformable registration. Deformation fields between both geometries from MRI and ultrasound are obtained after registration. Three different deformable registration methods were utilized for the MRI-ultrasound registration. Finally, the cardiac fiber orientations imaged by DTI are mapped to ultrasound volumes based on the extracted deformation fields. Moreover, this study also demonstrated the ability to simulate electricity activations during the cardiac resynchronization therapy (CRT) process. The proposed method has been validated in two rat hearts and three canine hearts. After MRI/ultrasound image registration, the Dice similarity scores were more than 90% and the corresponding target errors were less than 0.25 mm. This proposed approach can provide cardiac fiber orientations to ultrasound images and can have a variety of potential applications in cardiac imaging.
Keywords: Cardiac fiber orientations, 3D ultrasound, Deformable image registration, Magnetic resonance imaging (MRI), diffusion tensor imaging (DTI), heart imaging
1. INTRODUCTION
Echocardiography is the most common and important imaging modality in cardiac clinical examinations because it is dynamic, noninvasive, fast, and inexpensive [1–3]. Unfortunately, the spatial resolution of ultrasound imaging is not as high as that of MRI or CT. Ultrasound imaging can only provide the geometry or motion information of the heart at the organ level and cannot supply the cardiac fiber orientations at the tissue level. However, these fiber orientations in the heart are important and affect the cardiac anatomy, mechanical properties, and the electrophysiology [4]. These properties then determine the heart pumping functions. Therefore, during the echocardiography imaging in routine clinical examinations, if the patient’s personalized fiber orientations can be mapped to his/her echocardiographic images, it may provide useful and comprehensive parameters such as the geometric shape deformation, stress distributions during a beating period, and the electric action spreading in the heart [4–6]. These parameters can improve or even change cardiac diagnosis or quantitative modeling [7]. Thus, it will be much more useful for long-term examinations of those patients who suffer from chronic cardiac diseases such as hypertrophy or even heart failure. Another important possible application is that these mapped cardiac fibers can help ultrasound-guided cardiac therapies such as the prediction of pacing acute effects during cardiac resynchronization therapy, surgical plans and guidance of cardiac ablation in vivo, as well as the evaluations after these therapies [5, 8]. Recently, significant progress has been made in fast diffusion tensor imaging (DTI) that can measure cardiac fiber orientations in vivo [9]. This progress makes it possible to map personalized cardiac fiber orientations in routine echocardiography examinations. Although cardiac fiber orientations are important for both clinical diagnosis and therapies, mapping cardiac fiber orientation to ultrasound images has not yet been investigated.
In this project, we address the feasibility of mapping the personalized cardiac fiber orientations to 3D ultrasound volumes. First, we apply high-frequency ultrasound imaging with a 30 MHz transducer to scan rat hearts ex vivo. Second, we utilized a 7.0 T MRI scanner to acquire both high-resolution T1 and DTI images from the same heart. Third, after MR imaging, the geometries of the rat hearts are manually segmented from both ultrasound and MR images. We next register the MRI volumes to the 3D ultrasound volumes using both rigid and deformable registration methods. Among these steps, the accuracy of the registration is a key factor [10–17]. Thus, three deformable registration methods [18–21], i.e. Demons, b-spline free form deformation (b-spline), and large deformable diffeomorphic metric mapping (LDDMM), were compared in this study. Finally, according to the cardiac geometry and fiber orientation relationships [5, 6, 22–24], the cardiac fiber orientations obtained by DTI are registered and mapped to the ultrasound volumes based on the extracted deformation fields between MRI and ultrasound.
2. METHODS
2.1 Experiment procedures
The hearts of male Sprague Dawley rates were excised and then quickly perfused by 1 × PBS to clean the residual blood in heart pools and vessels. The hearts were then fixed by 4% phosphate buffered paraformaldehyde (PFA) solution for 14 hours and then were embedded in 2% agar phantoms for the following imaging procedures. First, the phantoms were settled on the imaging plat and imaged by the Vevo 2100 ultrasound system (FUJIFILM VisualSonics, Inc., Toronto, Canada) with a 30 MHz transducer. B-mode ultrasound images of the hearts in the short-axis view were acquired slice by slice from base to apex at a 0.2 mm thickness. The length of each pixel in the B-mode image was 0.03 mm. Second, the phantoms were placed in a Biospec 7 T MRI system (Bruker Corporation, Massachusetts, USA). A RF coil with an inner diameter of 30 mm was used to transmit/receive the signals. Before DTI imaging, T1 anatomical images were acquired at a voxel resolution of 0.078 × 0.078 × 0.156 mm3. Then, the cardiac fiber orientations were imaged in 60 directions by the spin echo sequence at the 0.234 mm isotropic resolution. The total MRI time was 25 hours for each heart. After the data acquisition, cardiac fiber orientations from DTI were mapped to ultrasound volumes based on the following procedures, as shown in Figure 1.
Figure 1.
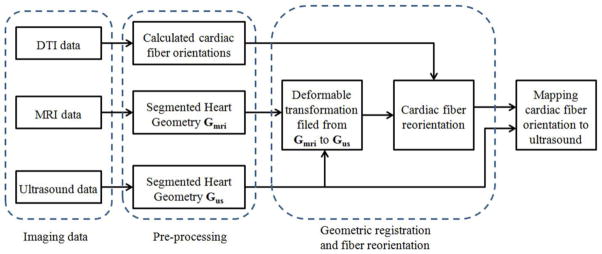
Flowchart of mapping cardiac fiber orientation from DTI to ultrasound
2.2 Mapping cardiac fiber orientation from DTI to ultrasound
Geometry and fiber orientation reconstruction
Both ultrasound images and T1weighted MR images were manually segmented using the Analyze software (AnalyzeDirect Inc., Overland Park, KS). Then the binary geometric volumes of the hearts were reconstructed. Based on the segmented heart mask from T1 images, the cardiac fiber orientations were reconstructed from the DTI data.
Geometric registrations from MRI to ultrasound
Although both MRI and ultrasound geometries were for the same heart, their resolutions and imaging angles were different. Thus, the MRI volumes were registered to their corresponding ultrasound ones using a rigid registration method. During the ultrasound imaging procedure, the ultrasound probe pressed the heart and caused deformation. The fiber orientations also affected the ultrasound images and generated imaging artifacts [25, 26]. In order to correct the deformation, three deformable registration methods, i.e. Demons, b-spline, and LDDMM, were implemented to register the MRI and ultrasound images.
2.3 Cardiac fiber orientation mapping
After the geometric registration, the transformation field from MRI to ultrasound was extracted. The reconstructed cardiac fiber orientations were mapped to the ultrasound volumes. During this process, besides the rigid transformation, the cardiac fibers were also reoriented by the strategy of preservation of principle directions (PPD), which was previously used for DTI fiber reorientations [27, 28].
2.4 Evaluations
Quantitative evaluation of the method is conducted by comparing the processed image with the corresponding reference image [29–32]. Two evaluation methods Dice similarity score and target errors are utilized here. The Dice score is used as the performance assessment of the registration, as shown in Figure 2(a). It is computed as follows:
| (3) |
where R and S represent the voxel set in the volumes of both registered and corresponding reference volumes, respectively.
Figure 2.
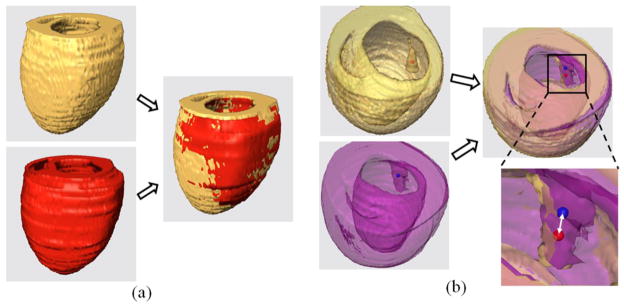
Illustrations of both Dice and target error evaluations. (a) Dice similarity between the registered volumes (yellow and red volumes). (b) Target registration error, the distance (white double arrow) between the mass points (red and blue dots) of two registered targets.
The other evaluation method is the target registration error, which calculates the distance between corresponding markers in both images, shown as Figure 2(b). We used the papillary muscles in the hearts as the anatomic markers for the calculation of the target errors. The distance between the mass centers in the corresponding markers was calculated for registration evaluation.
3. RESULTS
3.1 Registrations on canine MRI volumes
We first used the canine cardiac dataset, which was shared by the Center of Cardiovascular Bioinformatics and Modeling (CCBM) at Johns Hopkins University [33], to test the three deformable registration methods, i.e. b-spline, Demons, and LDDMM. Three canine cardiac MRI volumes, which were segmented as binary volumes, were applied to this registration evaluation purpose. Before the deformable registrations, the volumes were registered using rigid-body registration. The corresponding volume Dice similarity scores are listed in Table 1. The results demonstrated that deformable registration improve the match between the two cardiac MRI geometries of the canine heart as compared to rigid registration.
Table 1.
Registrations of canine cardiac MRI volumes
| Registration methods | Volume Dice similarity score (%)
|
||
|---|---|---|---|
| Volume 1 → 2 | Volume 2 → 3 | Volume 3 → 1 | |
| Rigid | 57.5 | 55.7 | 72.2 |
| B-spline | 89.1 | 88.9 | 91.2 |
| Demons | 96.6 | 94.9 | 97.2 |
| LDDMM | 96.2 | 95.3 | 96.8 |
3.2 Registration of ultrasound and MRI volumes of rat hearts
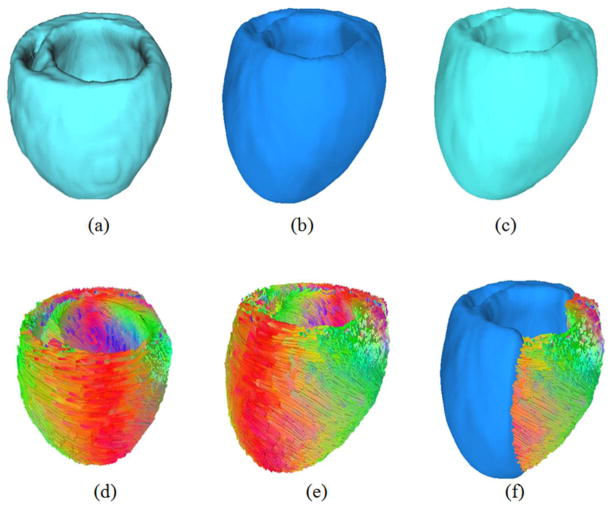
To test the feasibility, two rat hearts were imaged and analyzed in this experiment. First, both ultrasound and T1-weighted MR images were manual segmented as binary volumes using Analyze. Then the cardiac fiber orientations were reconstructed by using the segmented T1 binary volume as the myocardium mask. The processed results are shown in Figure 2.
Registration between ultrasound and MRI volumes
As shown in Figure 4(a–c), the segmented MRI volume and its corresponding segmented ultrasound volume of each rat heart were registered using a rigid-body registration followed by the deformable registration: b-spline, Demons, and LDDMM.
Figure 4.
Mapping cardiac fiber orientations to the ultrasound volume based on the deformation field of both ultrasound and MRI volumes. (a) The reconstructed ultrasound volume. (b) The reconstructed MRI volume. (c) Deformed MRI volume after rigid and deformable registration. (d) The cardiac fiber orientations from DTI. (e) The relocated and reoriented fiber orientations based on the deformation fields from MRI to ultrasound. (d) The mapping results of both fiber orientations and the ultrasound volume.
After three different registration approaches, their corresponding volume Dice similarity score are listed in Table 2. We also used the papillary muscles connected to the endocardium of the hearts as the anatomic markers for the registration evaluation. Their corresponding target registration errors are listed in Table 3. It can be seen that t the Dice and target errors of rigid registration results are around 85% (Dice) and 0.5 mm (target error). After deformable registration, all Dice scores are higher than 90% and all target errors are less than 0.25 mm. This demonstrates that these deformable registration approaches improved the accuracy of the registration between MRI and ultrasound geometries.
Table 2.
Volume Dice similarity Scores for the registration between MRI to ultrasound of the same heart
| Data sets | Volume Dice similarity Score (%)
|
|||
|---|---|---|---|---|
| Rigid | B-spline | Demons | LDDMM | |
| Rat 1 | 86.5 | 93.7 | 97.6 | 98.4 |
| Rat 2 | 84.1 | 95.0 | 97.8 | 97.3 |
Table 3.
Target registration errors of the registration between MRI to ultrasound of the same rat heart
| Data sets | Target Errors (mm)
|
|||
|---|---|---|---|---|
| Rigid | B-spline | Demons | LDDMM | |
| Rat 1 | 0.53 | 0.19 | 0.19 | 0.08 |
| Rat 2 | 0.42 | 0.16 | 0.17 | 0.22 |
Mapping cardiac fiber orientations to the ultrasound volume
After the geometric registration, based on the transformation field of the deformable registrations, the cardiac fiber orientations were mapped to the ultrasound volumes, as shown in Figure 4(d-f). This mapping procedure was conducted using two steps: (1) relocation of the DTI point positions and (2) reorientation of the cardiac fibers based on PPD [27].
3.3 Predicting cardiac electricity interventions based on the mapped ultrasound geometry and fiber orientations
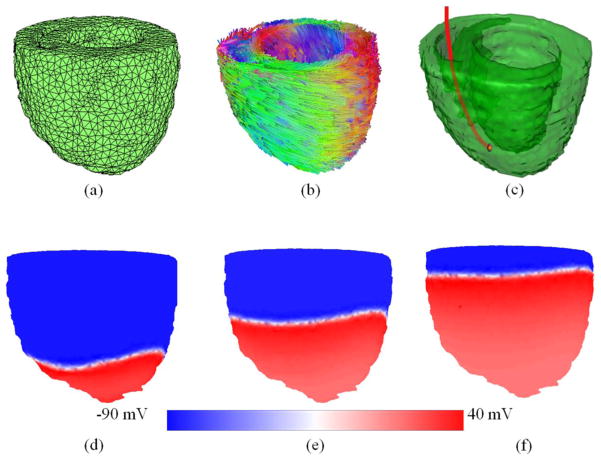
Finally, we applied this cardiac fiber orientation mapping method to predict the 3D electrophysiological properties, as shown in Figure 5. Biomechanical simulations and predictions based on images is an important issue in clinical diagnosis and therapies [34]. In order to predict the cardiac electricity interventions, both reconstructed 3D ultrasound mesh geometry (Figure 5(a)) and the mapped cardiac fiber orientations (Figure 5(b)) were utilized for this purpose. Figure 5(c) illustrated the cardiac resynchronization therapy (CRT) conducted by a pacemaker, where the blue pipe was the internally placed electrode. One end of the electrode was connected to the pacemaker and the other one was attached to the myocardium of the heart apex.
Figure 5.
Predicting cardiac electricity distributions during cardiac resynchronization therapy based on the mapped ultrasound geometry and fiber orientations. (a) The reconstructed mesh volume of ultrasound. (b) The mapped cardiac fiber orientations. (c) The cardiac resynchronization therapy (CRT) conducted by an internal electrode (red line) from a pacemaker. (d–f) The simulation results of the action potentials at three different time points (15 ms, 30 ms and 45 ms) after the impulse of the pacemaker. The colors indicate the action potentials from −90 mV to 40 mV.
Then, the cardiac electricity distributions around the 3D geometry were simulated. The action potentials at three different time points (15 ms, 30 ms and 45 ms) after the impulse of the pacemaker are shown in Figure 5(d–f). The geometric mesh was generated by iso2mesh [35] and the cardiac electricity simulations were simulated by Chaste [36].
4. CONCLUSIONS
In this project, we proposed a cardiac fiber imaging method and test the feasibility of mapping personalized cardiac fiber orientations from MR DTI data to 3D ultrasound volumes, which included data reconstruction, rigid and deformable registration, and fiber reorientation. We also compared the registration results based on different deformable registration methods. Furthermore, we utilized these results to simulate the electrophysiological properties around the heart during CRT process. By providing fiber orientation information on ultrasound images, this technique has the potential to provide measurable information for the examination of the chronic cardiac diseases and for image-guided cardiac therapies.
Figure 3.
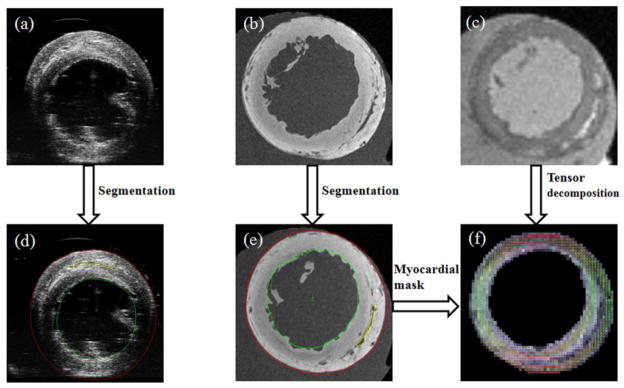
Processed results of the rat hearts. (a) Ultrasound image. (b) T1-weighted MR image. (c) DTI image. (d) The segmented ultrasound image. (e) The segmented MR image. (f) The reconstructed cardiac fiber orientations by tensor decomposition from DTI data.
Acknowledgments
This research is supported in part by NIH grants (R01CA156775 and R21CA176684), Georgia Research Alliance Distinguished Scientists Award, and the Emory Molecular and Translational Imaging Center (NIH P50CA128301).
References
- 1.Qin X, Cong Z, Halig LV, et al. Automatic segmentation for right ventricle on ultrasound images using sparse matrix transform and level set. SPIE Medical Imaging 2013: Image Processing; 2013. p. 8669. [DOI] [PMC free article] [PubMed] [Google Scholar]
- 2.Qin X, Wu L, Jiang H, et al. Measuring body-cover vibration of vocal folds based on high frame rate ultrasonic imaging and high-speed video. IEEE Trans Biomed Eng. 2011;58(8) doi: 10.1109/TBME.2011.2157156. [DOI] [PubMed] [Google Scholar]
- 3.Qin X, Cong Z, Fei BW. Automatic segmentation of right ventricular ultrasound images using sparse matrix transform and level set. Physics in Medicine and Biology. 2013;58(21):7609–24. doi: 10.1088/0031-9155/58/21/7609. [DOI] [PMC free article] [PubMed] [Google Scholar]
- 4.Lombaert H, Peyrat JM, Croisille P, et al. Human atlas of the cardiac fiber architecture: study on a healthy population. IEEE Trans Med Imaging. 2012;31(7):1436–47. doi: 10.1109/TMI.2012.2192743. [DOI] [PubMed] [Google Scholar]
- 5.Sermesant M, Chabiniok R, Chinchapatnam P, et al. Patient-specific electromechanical models of the heart for the prediction of pacing acute effects in CRT: a preliminary clinical validation. Med Image Anal. 2012;16(1):201–15. doi: 10.1016/j.media.2011.07.003. [DOI] [PubMed] [Google Scholar]
- 6.Vadakkumpadan F, Arevalo H, Ceritoglu C, et al. Image-based estimation of ventricular fiber orientations for personalized modeling of cardiac electrophysiology. IEEE Trans Med Imaging. 2012;31(5):1051–60. doi: 10.1109/TMI.2012.2184799. [DOI] [PMC free article] [PubMed] [Google Scholar]
- 7.Savadjiev P, Strijkers GJ, Bakermans AJ, et al. Heart wall myofibers are arranged in minimal surfaces to optimize organ function. Proc Natl Acad Sci U S A. 2012;109(24):9248–53. doi: 10.1073/pnas.1120785109. [DOI] [PMC free article] [PubMed] [Google Scholar]
- 8.Okumura Y, Henz BD, Johnson SB, et al. Three-Dimensional Ultrasound for Image-Guided Mapping and Intervention Methods, Quantitative Validation, and Clinical Feasibility of a Novel Multimodality Image Mapping System. Circulation-Arrhythmia and Electrophysiology. 2008;1(2):110–119. doi: 10.1161/CIRCEP.108.769935. [DOI] [PubMed] [Google Scholar]
- 9.Nicolas Toussaint CTS, Sermesant Maxime, Schaeffter Tobias, Kozerke Sebastian, Batchelor Philip G. In vivo human cardiac fibre architecture estimation using shape-based DT processing. Medical Image Analysis. 2013 doi: 10.1016/j.media.2013.02.008. [DOI] [PubMed] [Google Scholar]
- 10.Fei BW, Duerk JL, Wilson DL. Automatic 3D registration for interventional MRI-guided treatment of prostate cancer. Comput Aided Surg. 2002;7(5):257–67. doi: 10.1002/igs.10052. [DOI] [PubMed] [Google Scholar]
- 11.Fei BW, Wheaton A, Lee Z, et al. Automatic MR volume registration and its evaluation for the pelvis and prostate. Phys Med Biol. 2002;47(5):823–38. doi: 10.1088/0031-9155/47/5/309. [DOI] [PubMed] [Google Scholar]
- 12.Fei BW, Duerk JL, Boll DT, et al. Slice-to-volume registration and its potential application to interventional MRI-guided radio-frequency thermal ablation of prostate cancer. IEEE Trans Med Imaging. 2003;22(4):515–25. doi: 10.1109/TMI.2003.809078. [DOI] [PubMed] [Google Scholar]
- 13.Fei BW, Kemper C, Wilson DL. A comparative study of warping and rigid body registration for the prostate and pelvic MR volumes. Comput Med Imaging Graph. 2003;27(4):267–81. doi: 10.1016/s0895-6111(02)00093-9. [DOI] [PubMed] [Google Scholar]
- 14.Fei BW, Duerk JL, Sodee DB, et al. Semiautomatic nonrigid registration for the prostate and pelvic MR volumes. Acad Radiol. 2005;12(7):815–24. doi: 10.1016/j.acra.2005.03.063. [DOI] [PubMed] [Google Scholar]
- 15.Fei BW, Wang H, Muzic RF, Jr, et al. Deformable and rigid registration of MRI and microPET images for photodynamic therapy of cancer in mice. Med Phys. 2006;33(3):753–60. doi: 10.1118/1.2163831. [DOI] [PubMed] [Google Scholar]
- 16.Fei BW, Yang X, Nye JA, et al. MRPET quantification tools: Registration, segmentation, classification, and MR-based attenuation correction. Med Phys. 2012;39(10):6443–54. doi: 10.1118/1.4754796. [DOI] [PMC free article] [PubMed] [Google Scholar]
- 17.Wang HS, Fei BW. Nonrigid point registration for 2D curves and 3D surfaces and its various applications. Physics in Medicine and Biology. 2013;58(12):4315–4330. doi: 10.1088/0031-9155/58/12/4315. [DOI] [PMC free article] [PubMed] [Google Scholar]
- 18.Little JA, Hill DLG, Hawkes DJ. Deformations incorporating rigid structures. Computer Vision and Image Understanding. 1997;66(2):223–232. [Google Scholar]
- 19.Beg MF, Miller MI, Trouve A, et al. Computing large deformation metric mappings via geodesic flows of diffeomorphisms. International Journal of Computer Vision. 2005;61(2):139–157. [Google Scholar]
- 20.Zhang Y, Liang X, Ma J, et al. An atlas-based geometry pipeline for cardiac Hermite model construction and diffusion tensor reorientation. Med Image Anal. 2012;16(6):1130–41. doi: 10.1016/j.media.2012.06.005. [DOI] [PMC free article] [PubMed] [Google Scholar]
- 21.Lu G, Halig LV, Wang D, et al. Hyperspectral imaging for surgical margin delineation of head and neck cancer: registration of hyperspectral and histological images. SPIE Medical Imaging 2014. 2014:9036. doi: 10.1117/12.2043805. [DOI] [PMC free article] [PubMed] [Google Scholar]
- 22.Helm P, Beg MF, Miller MI, et al. Measuring and mapping cardiac fiber and laminar architecture using diffusion tensor MR imaging. Communicative Cardiac Cell. 2005;1047:296–307. doi: 10.1196/annals.1341.026. [DOI] [PubMed] [Google Scholar]
- 23.Sundar H, Shen DG, Biros G, et al. Estimating myocardial fiber orientations by template warping. 2006; 3rd Ieee International Symposium on Biomedical Imaging: Macro to Nano; 2006. pp. 73–76. [Google Scholar]
- 24.Bishop MJ, Hales P, Plank G, et al. Comparison of Rule-Based and DTMRI-Derived Fibre Architecture in a Whole Rat Ventricular Computational Model. Functional Imaging and Modeling of the Heart. 2009;5528:87–96. [Google Scholar]
- 25.Crosby J, Hergum T, Remme EW, et al. The effect of including myocardial anisotropy in simulated ultrasound images of the heart. IEEE Trans Ultrason Ferroelectr Freq Control. 2009;56(2):326–33. doi: 10.1109/TUFFC.2009.1041. [DOI] [PubMed] [Google Scholar]
- 26.Qin X, Cong Z, Jiang R, et al. Extracting cardiac myofiber orientations from high frequency ultrasound images. SPIE Medical Imaging 2013: Image Processing. 8675:867507–8. doi: 10.1117/12.2006494. [DOI] [PMC free article] [PubMed] [Google Scholar]
- 27.Alexander DC, Pierpaoli C, Basser PJ, et al. Spatial transformations of diffusion tensor magnetic resonance images. IEEE Transactions on Medical Imaging. 2001;20(11):1131–1139. doi: 10.1109/42.963816. [DOI] [PubMed] [Google Scholar]
- 28.Peyrat JM, Sermesant M, Pennec X, et al. A computational framework for the statistical analysis of cardiac diffusion tensors: application to a small database of canine hearts. IEEE Trans Med Imaging. 2007;26(11):1500–14. doi: 10.1109/TMI.2007.907286. [DOI] [PubMed] [Google Scholar]
- 29.Fei BW, Schuster D, Master V, et al. Incorporating PET/CT Images Into 3D Ultrasound-Guided Biopsy of the Prostate. Medical Physics. 2012;39(6):3888–3888. [Google Scholar]
- 30.Fei BW, Schuster DM, Master V, et al. A Molecular Image-directed, 3D Ultrasound-guided Biopsy System for the Prostate. 2012 doi: 10.1117/12.912182. [DOI] [PMC free article] [PubMed] [Google Scholar]
- 31.Sechopoulos I, Bliznakova K, Qin XL, et al. Characterization of the homogeneous tissue mixture approximation in breast imaging dosimetry. Medical Physics. 2012;39(8):5050–5059. doi: 10.1118/1.4737025. [DOI] [PMC free article] [PubMed] [Google Scholar]
- 32.Akbari H, Fei BW. 3D ultrasound image segmentation using wavelet support vector machines. Medical Physics. 2012;39(6):2972–2984. doi: 10.1118/1.4709607. [DOI] [PMC free article] [PubMed] [Google Scholar]
- 33.Helm PA, Tseng HJ, Younes L, et al. Ex vivo 3D diffusion tensor imaging and quantification of cardiac laminar structure. Magnetic Resonance in Medicine. 2005;54(4):850–859. doi: 10.1002/mrm.20622. [DOI] [PMC free article] [PubMed] [Google Scholar]
- 34.Qin X, Wang S, Wan M. Improving reliability and accuracy of vibration parameters of vocal folds based on high-speed video and electroglottography. IEEE Trans Biomed Eng. 2009;56(6):1744–54. doi: 10.1109/TBME.2009.2015772. [DOI] [PubMed] [Google Scholar]
- 35.Fang QQ, Boas DA. Tetrahedral Mesh Generation from Volumetric Binary and Gray-Scale Images. 2009 IEEE International Symposium on Biomedical Imaging: From Nano to Macro; 2009. pp. 1142–1145. [Google Scholar]
- 36.Mirams GR, Arthurs CJ, Bernabeu MO, et al. Chaste: An Open Source C plus plus Library for Computational Physiology and Biology. Plos Computational Biology. 2013;9(3) doi: 10.1371/journal.pcbi.1002970. [DOI] [PMC free article] [PubMed] [Google Scholar]


