

Abstract
Background
Increasing evidence has indicated that microRNAs (miRNAs) are strongly implicated in the initiation and progression of glioblastoma multiforme (GBM). Here, we identified a novel tumor suppressive miRNA, miR-377, and investigated its role and therapeutic effect for GBM.
Methods
MiRNA global screening was performed on GBM patient samples and adjacent nontumor brain tissues. The expression of miR-377 was detected by real-time reverse-transcription PCR. The effects of miR-377 on GBM cell proliferation, cell cycle progression, invasion, and orthotopic tumorigenicity were investigated The therapeutic effect of miR-377 mimic was explored in a subcutaneous GBM model. Western blot and luciferase reporter assay were used to identify the direct and functional target of miR-377.
Results
MiR-377 was markedly downregulated in human GBM tissues and cell lines. Overexpression of miR-377 dramatically inhibited cell growth both in culture and in orthotopic xenograft tumor models, blocked G1/S transition, and suppressed cell invasion in GBM cells. Importantly, introduction of miR-377 could strongly inhibit tumor growth in a subcutaneous GBM model. Subsequent investigation revealed that specificity protein 1 (Sp1) was a direct and functional target of miR-377 in GBM cells. Silencing of Sp1 recapitulated the antiproliferative and anti-invasive effects of miR-377, whereas restoring the Sp1 expression antagonized the tumor-suppressive function of miR-377. Finally, analysis of miR-377 and Sp1 levels in human GBM tissues revealed that miR-377 is inversely correlated with Sp1 expression.
Conclusion
These findings reveal that miR-377/Sp1 signaling that may be required for GBM development and may consequently serve as a therapeutic target for the treatment of GBM.
Keywords: glioblastoma multiforme, invasion, miR-377, proliferation, Sp1
Glioblastoma multiforme (GBM) is the most common and lethal primary brain tumor in adults. Despite advances in standard therapy, including surgical resection followed by radiation and chemotherapy, the prognosis for patients with GBM remains dismal, with a median survival time of <1 year after diagnosis.1 Thus, there is an urgent need to develop new molecular targets and treatment strategies for this disease.
MicroRNAs (miRNAs) belong to a class of conserved endogenous noncoding small RNAs comprising 18–23 nucleotides that negatively regulate gene expression at the posttranscriptional level by annealing with the 3′-untranslated region.2 miRNAs have pivotal roles in regulating important cellular functions such as proliferation, invasion, apoptosis, death, stress response, differentiation, and development. Dysregulation of miRNA has been suggested to be associated with a variety of disorders, particularly cancers.3,4 Moreover, miRNAs have been shown to be useful as diagnostic and prognostic indicators of disease type and severity.5–8 Accumulating evidence has indicated that a subset of miRNAs is deregulated in gliomas.9–17 However, there is still incomplete understanding of how glioma-associated miRNAs affect disease development, progression, and response to therapy.
Specificity protein 1 (Sp1), one of the first eukaryotic transactivators to be identified, is known to be a member of the large multigene family of Sp/Kruppel-like factor (KLF) transcription factors.18 Sp1 is expressed ubiquitously in various mammalian cells and plays an important role in regulation of chromatin remodeling and gene expression. Aberrant expression of Sp1 is observed in various types of human cancers including breast carcinomas,19 thyroid cancer,20 hepatocellular carcinomas,21 pancreatic cancer,22 gastric cancer,23 and lung cancer.24 Moreover, overexpression of Sp1 plays a causal role in the malignant transformation of normal human cells and is closely correlated with upregulation of multiple important oncoproteins such as VEGF, uPA, and its receptor and EGFR.25 A recent study has shown that Sp1 is highly expressed in gliomas and may mediate an invasive phenotype of glioma cells through controlling MMP-2 expression.26
In this study, we identified a novel tumor-suppressive miRNA, miR-377, and investigated its functional role and therapeutic effect in GBM. Moreover, we identified Sp1 as a direct target for miR-377. Our results not only revealed that overexpressed Sp1 in GBM could be the result of downregulation of miR-377 but also suggested an important role for the loss of miR-377 in the pathogenesis and invasion of GBM and its potential for a future therapeutic application.
Materials and Methods
Human Tissue Samples
Tissue microarrays containing 107 GBM samples were obtained from the Department of Neurosurgery of the Second and Fourth Affiliated Hospitals of Harbin Medical University from 2002 to 2007. The histological features of all specimens were confirmed by pathologists according to the WHO criteria. None of the patients had received radiotherapy (RT) or chemotherapy before tumor resection.
Normal brain tissue (NBT) samples were taken from 10 patients who underwent decompressive craniectomy for severe traumatic brain injury, and 6 sterile and freshly paired resected GBM tissues and peripheral nontumor glial brain tissue from a same patient (obtained from the Department of Neurosurgery at the First Affiliated Hospital of Nanjing Medical University). This study was approved by the institutional review board and the ethics committee of Nanjing Medical University and Harbin Medical University, and written informed consent was obtained from all participants.
Cell Culture
Human GBM cell lines U87, U251, LN229, A172, and U118 were obtained from the American Type Culture Collection and grown in Dulbecco's modified Eagle's medium (DMEM) supplemented with 10% fetal bovine serum (FBS). Normal human astrocytes (NHAs) were obtained from Lonza and cultured in the provided astrocyte growth media supplemented with rhEGF, insulin, ascorbic acid, GA-1000, L-glutamine and, 5% FBS. NHA-E6/E7/hTERT cells were generated as described previously27 and cultured in DMEM supplemented with 10% FBS. The GBM primary cell lines were established from 2 primary GBM surgical specimens.
Microarray Data Processing
Total miRNA from cultured cells was extracted using the mirVana miRNA Isolation Kit (Ambion) according to the manufacturer's instructions and was 3′-end-labeled using T4 RNA ligase to couple Cy3-labeled RNA linkers. Labeled RNA was hybridized to microarrays overnight at 65°C in a hybridization mixture containing 4× sodium chloride sodium citrate (SSC) (1× SSC: 150 mM sodium chloride and 15 mM sodium citrate), 0.1% sodium dodecyl sulfate (SDS), 1 μg/μL herring sperm DNA, and 38% formamide. Slides were washed in SSC at increasing stringency (from 2× to 0.4×). Each RNA sample was independently hybridized twice. Microarrays were scanned using G2505C Microarray Scanner (Agilent Technologies), and data generation and normalization were performed by Shanghai Biotechnology Corporation following standard Agilent protocols. Differentially expressed miRNAs were identified by using the fold change > 1.5.
Lentivirus Production, Plasmid Construction, and Transduction
MiRNA mimic or anti-oligonucleotides of miR-377 were purchased from GenePharma (miR-377 mimic sequence: sense ‘AUCACACAAAGGCAACUUUUGU’: antisense: ‘AAAAGUUGCCUUUGUGUGAUUU’. Stable transfectants overexpressing miR-377 were generated by lentiviral transduction using the pMIRNA1 plasmid containing miR-377 (System Biosciences). Premade lentiviral Sp1 short hairpin RNA (shRNA) constructs and a shNC construct were purchased from Open Biosystems. Lentiviral helper plasmids (pCMV-dR8.2 dvpr and pCMV-VSV-G) were obtained from Addgene. Lentivirus stocks were prepared following the manufacturer's protocol. The entire coding sequences of Sp1 were obtained from HUVEC mRNA by reverse transcription (RT)- PCR. Sp1 cDNAs were purified by GenePharma and cloned into a pEGFP-C1 vector to generate pEGFP-Sp1 recombinant plasmids. The recombinant vectors were sequenced and verified by GenePharma. All oligonucleotides and plasmids were transfected into cells using Lipofectamine 2000 Transfection Reagent (Invitrogen Corporation) according to the manufacturer's instructions.
RNA Extraction and Quantitative Real-time RT-PCR
Sterile and freshly paired resected GBM tissues and peripheral nontumor glial brain tissue from the same participant were immediately placed in ice-cold sterile phosphate buffered saline (PBS). The tissue was minced and trypsinized in 3–5 mL of prewarmed 0.05% trypsin-EDTA for 10–15 minutes in a 37°C water bath. Then, the suspension was pelleted down by centrifuging at 800 rpm (110 g) for 5 minutes. The supernatant was discarded, and the tissue pieces were resuspended in 1 mL of sterile DMEM/Ham's F12 cell culture medium supplemented with 10% FBS, 2 mM L-glutamine, and 1% penicillin-streptomycin and passed through a cell strainer (100 µm; Becton-Dickinson-Falcon) to obtain a single cell suspension. Cells were washed with PBS and seeded into 6-well plates coated with collagen. Outgrowing cells were detached with trypsin and transferred to T25 cell culture flasks. Cells passaged 2–3 times in this manner were transferred to T175 culture flasks and expanded for subsequent analyses. These cells were also characterized via immunofluorescence staining using an antibody against glial fibrillary acidic protein (GFAP). Total RNA was extracted using TRIzol reagent (Invitrogen). The quantitative RT-(qRT)-PCR primers for Sp1 and miR-377 were purchased from GenePharma. The PCR primers for Sp1 were 5′-GTGGAGGCAACATCATTGCTG-3′ and 5′-GCCACTGGTACATTGGTCACAT-3′. GAPDH mRNA was also amplified in the same PCR reactions as an internal control using the primers 5′-GAAGGTGAAGGTCGGAGTC-3′ and 5′-GAAGATGGTGATGGGATTTC-3′. The mRNA expression levels were normalized to GAPDH using the standard ΔΔCT method. Quantification of miR-377 and U6 was performed with a stem-loop real-time PCR miRNA kit. The primers for miR-200a and U6 detection assays were purchased from Ribobio. Real-time PCR was performed using an Applied Biosystems 7900 Sequence Detection system as described previously.28,29 All reactions were performed in triplicate and repeated 3 times.
Cell Viability Assay
At 72 hours after transfection, cells were seeded at 2000 per well in 96-well plates and cultured. Cell proliferation was detected at the indicated time points using a CCK8 kit (Dojindo Laboratories) following the manufacturer's instructions. All assays were performed in octuplicate and repeated at least 3 times.
Colony Formation Assay
The colony formation assay was performed as described in a previous work.28 Briefly, 5 × 10² cells were independently plated onto 60 mm tissue culture plates. After 10–14 days, visible colonies were fixed with 100% methanol and stained with 0.1% crystal violet in 20% methanol for 15 minutes. Colony-forming efficiency was calculated as the number of colonies/plated cells ×100%.
Cell Cycle Analysis
Cell cycle analysis was performed as described previously.28 Cells were harvested, washed with PBS, and fixed with 70% ice-cold ethanol. Fixed cells were resuspended in PBS containing 25 mg/mL propidium iodide, 0.1% Triton, and 10 mg/mL RNase and incubated for 30 minutes in the dark before being analyzed by flow cytometry.
Matrigel Invasion Assay
Cellular invasiveness was evaluated in 24-well Matrigel invasion chambers (BD Biosciences). The upper and lower culture compartments were separated by polycarbonate filters with 8 mm pore size. Before the assays, the polycarbonate membranes were coated with 40 mL Matrigel at 37°C for 2 hours to form a reconstituted basement membrane. After 2 hours, 5 × 10⁴ cells resuspended in the serum-free medium were added to the upper inserts. The lower chamber well contained DMEM supplemented with 20% FBS to stimulate invasion. Noninvading cells on the top of the membrane were removed by scraping. Migrating cells on the bottom of the insert were fixed with 100% methanol and stained with 0.1% crystal violet. The total number of cells adhering to the lower surface of the membrane was acquired in 6 representative fields. Experiments were performed in triplicate.
Dual Luciferase Reporter Assay
The wild-type (WT) and mutated putative miR-377 target on Sp1 3′UTR were cloned into the pGL3 Dual-Luciferase miRNA Target Expression Vector (Invitrogen Corporation). Luciferase activity was measured with the dual luciferase reporter assay system (Promega).
Western Blot Analysis
Western blot analysis was performed as described previously.28,29 Briefly, cells were lysed in radio-immunoprecipitation assay buffer, and equal amounts of protein were separated by 10% SDS-PAGE followed by electrotransfer onto a polyvinylidene difluoride membrane (Thermo Scientific). The membranes were blocked for 1 hour with 5% nonfat milk and then incubated at room temperature with primary antibodies. The membranes were developed using an enhanced chemiluminescence detection system (GE Healthcare). Antibodies against Sp1, Cylin D1, CDK4, CDK6, Cyclin E, MMP-2, and MMP-9 were purchased from Cell Signaling. β-actin antibody was obtained from Bethyl Laboratories.
Orthotopic Xenograft Studies
Male nonobese diabetic-severe combined immunodeficient (NOD-SCID) mice (4–5 weeks old) were purchased from Shanghai Experimental Animal Center of the Chinese Academy of Sciences. Viable miR-377 and miNC-infected cells (2.5 × 10⁵) were injected intracranially into individual nude mice (n = 10/group). The kinetics of tumor formation was estimated by T2-weighted MRI. Upon development of neurological signs (hunching, weight loss, rough coat), mice were anesthetized and perfused with 4% PFA, after which their brains were harvested, followed by flash freezing or paraffin embedding. All animal experiments were conducted with the approval of the Nanjing Medical University Institutional Committee for Animal Research and in conformity with national guidelines for the care and use of laboratory animals.
Magnetic Resonance Imaging of Orthotopic Mouse Tumors
Intracranial tumor growth was monitored under in vivo conditions in isoflurane-anesthetized mice by MRI at days 3, 7, and 14 after inoculation using a Bruker 7.0T scanner (Bruker BioSpin GmbH) with a 16 cm bore. T2-weighted images were acquired by a rapid acquisition relaxation-enhanced sequence with the following parameters: relaxation time 4000 milliseconds, echo time 15 milliseconds, field of view 25.6 × 25.6 mm, matrix 256 × 256, slice thickness 0.8 mm, scan time 3 minutes 20 seconds. Tumor volume at days 7 and 14 was assessed by use of the free-hand region-of-interest analysis of Image J software (National Institutes of Health).
Subcutanous Xenograft Models and Therapeutic Regimen
U87 cells (1 × 10⁶) were injected subcutaneously into individual nude mice (n = 6). For the miR-377 mimic treatment experiments, mice were injected with either miR-377 mimic (20 µg) or a scrambled miRNA mimic every other day for 25 days.
Immunohistochemistry
The immunohistochemical assays were conducted on human GBM tissue microarrays and nude mouse xenograft tumor tissues to detect and score Sp1 expression using methods described previously.29
Statistical Analysis
All experiments were performed in triplicate with means and standard error of the mean or standard deviation subjected to the Student' t test for pairwise comparison or ANOVA for multivariate analysis. Analysis of patient survival was performed using Kaplan-Meier analysis in Graphpad Prism 5 software. Differences with P < .05 were considered significant.
Results
Reduced miR-377 Expression in GBM Tissues and Cell Lines
To identify miRNA expression changes in human GBM, we conducted a comprehensive microarray analysis to compare miRNA expression profiles in primary cells obtained from matched pairs of GBM and adjacent nontumor brain tissues from 6 participants. Microarray analysis of primary cells identified 36 downregulated and 30 upregulated miRNAs among 1887 analyzed miRNAs (Fig. 1A). We consistently identified previously discovered deregulated miRNAs including upregulated miR-21,12,30 miR-10b,11,31 and miR-1819 as well as downregulated miR-12812,14,32 and miR-135a,33 which validated our miRNA-profiling approach. We next measured the expression of several deregulated miRNAs in a cohort of 107 GBM samples and 10 NBTs (data not shown) and focused on miR-377 because it was a significantly downregulated miRNA in GBM cells and its biological function in GBM has remained undefined.
Fig. 1.

Expression of miR-377 in GBM samples and cell lines. (A) miRNA profiling of GFAP+ cells isolated from GBM patients and adjacent nontumor glial brain tissues. The pseudocolor represents the intensity scale of tumor versus adjacent nontumor brain tissue. (B) qRT-PCR analysis of miR-377 expression in 107 GBM specimens and 10 normal brain tissues (NBTs). Transcript levels were normalized by U6 expression. Alteration of expression is shown as box plot presentations. ***P < .001. (C) Expression levels of miR-377 in normal human astrocytes (NHAs), 5 glioma cells (U87, U251, LN229, A172 and U118). Transcript levels were normalized by U6 expression. **P < .01. (D) The expression level was categorized as low expression (final score < 0.3) and high expression (final score > 0.3. Correlation between miR-377 levels and median overall survival by Kaplan-Meier analysis of GBM patients with high (n = 47) or low (n = 60) miR-377 expression (P < .001).
As shown in Fig. 1B, the level of miR-377 was significantly downregulated in these GBM specimens compared with the level in NBTs (P < .001). Analysis of the correlation between the expression levels of miR-377 and clinical parameters is displayed in Supplementary Table S1. We found no significant relationship in miR-377 expression levels with other clinical covariates. The expression levels of endogenous miR-377 were further assessed by qRT-PCR in 5 GBM cell lines (U87, U251, LN229, A172, and U118) and NHAs. The results showed that all 5 tested GBM cell lines had significantly lower miR-377 levels than those in the NHAs (P < .01, Fig. 1C). We also assessed the prognostic value of miR-377 using the tissue microarrays containing 107 GBM samples. Kaplan-Meier survival analysis indicated that participants with high-level expression of miR-377 (n = 47) had longer median overall survival (OS) than those with low-level expression of miR-377 (n = 60) (OS, 14.3 months vs 9 months; P < .001) (Fig. 1D). Moreover, we determined the expression of miR-377 among GBM molecular subtypes (classical, n = 54; mesenchymal, n = 58; neural, n = 33; proneural, n = 57) using the the Tumor Genome Atlas (TCGA) database. All subtypes of GBM consistently displayed a significant downregulation of miR-377 as compared with NBTs (Supplementary Fig. S1A). Together, these results suggest that miR-377 is significantly reduced in GBM and may serve as a prognostic marker for patients with GBM.
miR-377 Inhibits GBM Cell Proliferation and Induces G0/G1 Phase Arrest
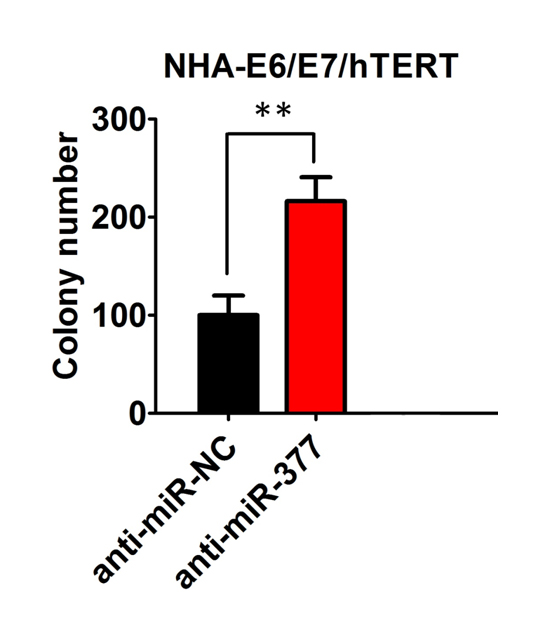
Because miR-377 was significantly downregulated in GBM tissues and cell lines, we investigated whether miR-377 plays a tumor suppressive role in GBM development. We first evaluated the effect of miR-377 on cellular proliferation using CCK-8 and clonogenic assays in U87 and U251 cells. CCK-8 assay showed that miR-377-transduced U87 and U251 cells exhibited significantly lower growth rates than control cells at day 3 after plating (P < .01, Fig. 2A). Colony formation assays consistently showed that enforced expression of miR-377 dramatically reduced the number of colonies of 2 GBM cell lines after 14 days of culture compared with the controls (P < .01, Fig. 2B). In contrast, the colony numbers of NHA/E6/E7hTERT cells transfected with anti-miR-377 were significantly higher than those transfected with control anti-miR (Supplementary Fig. S2).
Fig. 2.

miR-377 inhibits U87 glioma cell proliferation and induces G0/G1 phase arrest. (A) CCK-8 assay performed in U87 or U251 cells transfected with miR-NC or miR-377. **P < .01. (B) Colony formation assay performed in U87 and U251 cells after miR-377 or miR-NC transduction. The experiments were performed 3 times using triplicate samples, and average scores are indicated with error bars on the histogram. **P < .01. Scale bar = 100 µm. (C) The cell cycle distribution of U87 and U251 cells transfected with miR-377 or miR-NC. (D) The effects of miR-377 on cell cycle proteins (Cylin D1, CDK4, CDK6 and Cyclin E) in the G1/S transition were determined by Western blot analysis. β-actin was used as the loading control.
To elucidate the mechanism by which overexpression of miR-377 blocks GBM cell growth, we determined whether growth inhibition was associated with specific cell cycle changes. The effects of miR-377 on the cell cycle progression of U87 cells were characterized by flow cytometric analysis. Compared with the mock and miR-NC groups, U87 and U251 cells with miR-377 overexpression showed marked increase in the number of G0/G1 phases (Fig. 2C). To explore the molecules involved in the cell cycle distribution, we measured the expression of Cylin D1, CDK4, CDK6, and Cyclin E in miR-377-overexpressing U87 and U251 cells. All of these molecules have been previously reported to be important regulators for G1 phase.34–36 As shown in Fig. 2D, we observed that the ectopic expression of miR-377 significantly suppressed Cylin D1 expression in U87 and U251 cells. However, the expression levels of CDK4, CDK6, and Cyclin E had no significant changes after miR-377 overexpression. Collectively, these results suggested that miR-377 induces cell proliferation inhibition and G0/G1 cell cycle arrest in GBM cells.
Overexpression of miR-377 Blocks Tumor Growth in Orthotopic GBM Xenografts
To further investigate the potential role of miR-377 in vivo, we constructed a lentivirus vector to mediate the expression of miR-377 and established 2 stable cell lines, which were named miR-377-U87 and miR-NC-U87. These 2 cell lines (2.5 × 10⁵) were injected intracranially into the nude mice. Tumor progression was studied by T2-weighted MRI imaging. As shown in Fig. 3A and B, MRI-based quantification of tumor volume revealed significantly decelerated tumor growth of miR-377-U87 cells compared with miR-NC cells (P < .01). At 3 weeks post implantation, the mice were euthanized, and the tumors were removed. Representative H&E stainings for tumor cytostructure are shown in Fig. 3D. Immunohistochemical staining for Ki67 showed decreased expression in miR-377-U87 tumors compared with miR-NC-U87 tumors (Fig. 3D). Moreover, the inhibitory growth effect of miR-377 was further confirmed by the survival curves. Mice injected with miR-377-U87 cells survived significantly longer than those injected with miR-NC-U87 cells (Fig. 3C).
Fig. 3.

Overexpression of miR-377 blocks tumor growth in orthotopic GBM xenografts. (A) T2-weighted MRI imaging of intracranial tumor growth (arrows) at days 7 and 14 in miR-NC- and miR-377-bearing nude mice. (B) MRI-based quantification of tumor volume development in miR-NC- and miR-377-bearing nude mice. **P < .01. Scale bar = 1 mm (C) Survival curve of mice injected intracranially with 2.5 × 10⁵ of miR-NC-infected U87 cells (n = 10) or miR-377-infected U87 cells (n = 10). (D) Representative H&E staining for tumor cytostructure and histological analysis to detect Sp1 and Ki-67 expression in tumors originated from miR-NC and miR-377-infected U87 cells. Scale bar = 1 mm (first panels), 100 µm (second panels), and 400 µm (third and forth panels) (E) qRT-PCR analysis of miR-377 in 2 primary cell lines after ectopic expression of miR-377 or miR-NC. U6 RNA served as the loading control. **P < .01. (F) Representative H&E staining for tumor cytostructure in tumors originated from miR-NC and miR-377-infected primary cell lines. Scale bar = 1 mm (left panels) and 400 µm (right panels).
To control for cell line heterogeneity and determine the role of miR-377 in vivo, we established 2 primary cultured cell lines from the 2 primary GBM samples, which displayed significantly downregulated miR-377. We determined the effects of miR-377 in intracranial mice bearing 2 primary cell lines. Ectopic expression of miR-377 in primary GBM cell lines consistently led to decreased tumor growth compared with the control cells (Fig. 3E and F). Together, these results suggested that miR-377 overexpression might significantly inhibit the proliferation of GBM cells in vivo.
Treatment With miR-377 Mimic Inhibits Tumor Growth in a Subcutaneous GBM Model
Accumulating evidence has shown that miRNA mimic has emerged as a promising approach for cancer treatment.37 To date, several key tumor suppressive miRNAs, including let-7, miR-16, miR-21, miR-34, and miR-26a, have been identified that inhibit tumor growth in tumor mouse models.38–41 We next tested whether miR-377 could have potential therapeutic value. To achieve this goal, we treated nude mice bearing subcutaneous U87 GBM xenografts with miR-377 mimic. Following a regimen of administrating the miR-377 mimic every other day for 25 days, the mice were euthanized, and tumors were removed for analysis. As shown in Fig. 4A–C, compared with the control groups, treatment with the miR-377 mimic resulted in significant decreases in the growth rates and weights of tumors (P < .01). Together, these results suggested that miR-377 mimic might have therapeutic potential for the treatment of GBM.
Fig. 4.

Treatment with miR-377 mimic inhibits tumor growth in a subcutaneous U87 human GBM xenograft model. (A) U87 cells were implanted subcutaneously into nude mice. Treatment was started 10 days after implantation of U87 cells. miR-377 mimic (20 µg) was injected intratumorly into each subcutaneous tumor every other day. Tumor volumes were measured by a Vernier caliper in the indicated days. **P < .01. (B) Subcutaneous tumors derived from U87 cells in the miR-NC- or miR-377 mimic-treated group were weighed after tumors were harvested. **P < .01. (C) Representative images of subcutaneous tumors were displayed. Scale bar = 0.2 mm (D) Western blot analysis of Sp1 in tumors derived from U87 cells after treatment with miR-377 mimic or vector control. β-actin served as the loading control.
Sp1 is a Direct Target of miR-377
It is generally accepted that miRNAs exert their functions by regulating the expression of their downstream target genes. Using 4 different computational methods, including TargetScan, miRanda, Starbase (CLIP-Seq), and miRDB, we performed bioinformatic analysis to search for the potential regulatory targets of miR-377. Hundreds of different targets were predicted from this analysis (Supplementary Table S2). According to the prediction analysis, Sp1, which is a known core regulator governing tumor cell proliferation, progression, and invasion, is of particular interest. As illustrated in Fig. 5A, the miRNA: mRNA alignment analysis showed that the 3′UTR of Sp1 contains one putative binding site for miR-377, located at 3472–3479 nt.
Fig. 5.

Sp1 is the direct target of miR-377 and is involved in miR-377-induced tumor-suppression. (A) Predicted miR-377 target sequence in the 3′-UTR of Sp1 (Sp1–3′-UTR-WT) and mutant containing 7 altered nucleotides in the 3′-UTR of Sp1 (Sp1-3′-UTR-mut). (B) qRT-PCR analysis of miR-377 in U87 and U251 cells after ectopic expression of miR-377 or miR-NC. U6 RNA served as the loading control. **P < .01. (C) Western blot analysis of lysates from miR-NC-transfected or miR-377-transfected U87 and U251 cells probed with Sp1 antibody. β-actin served as the loading control. (D) Luciferase assay of the indicated cells transfected with pGL3-Vector, pGL3-Sp1-3′-UTR-WT, or pGL3-Sp1-3′-UTR-mut reporter with miR-377 mimic. **P < .01.
To determine whether miR-377 affects Sp1 expression in gliomas, we analyzed the changes of Sp1 expression in U87 and U251 cells after miR-377 overexpression. Increased expression of miR-377 upon infection in 2 GBM cell lines was confirmed by qRT-PCR (Fig. 5B). Meanwhile, Western blot analysis showed that ectopic expression of miR-377 markedly suppressed Sp1 protein expression in the 2 GBM cell lines (Fig. 5C). However, the half-life of Sp1 protein in miR-377-transduced cells was comparable to that in control cells (data not shown), which indicates that miR-377 did not induce Sp1 protein degradation. To validate the effect of miR-377 on the inhibition of Sp1 expression, we examined whether Sp1 is regulated by miR-377 through direct binding to its 3′UTR. We constructed vectors containing WT or mutant 3′UTR of human Sp1 fused downstream of the firefly luciferase gene. The WT or mutant vector was cotransfected into U87 and U251 cells with miR-377 mimic or miR-NC. As shown in Fig. 5D and Supplementary Fig. S3, a significant reduction of luciferase activity upon miR-377 transfection was observed (P < .01). Mutations in the tentative miR-377-binding seed region in the Sp1 3′-UTR abrogated this suppressive effect of miR-377. These results, taken together, suggested that Sp1 serves as a bona fide target of miR-377.
Sp1 Is Involved in miR-377-induced Tumor Suppression and Reduced Invasive Capability
Previous studies have suggested that Sp1 plays a critical role in the development and progression of various types of human cancers, including GBM.18–26 Analysis of Sp1 expression using the TCGA database revealed significant upregulation of Sp1 in all subtypes of GBM as compared with NBTs (Supplementary Fig. S1B). Moreover, we found that Sp1 overexpression promoted the colony formation of U87 human glioma cells in vitro and tumor growth in vivo (Fig. 6A–C). We next used short hairpin RNA targeting Sp1 to specifically suppress the expression of Sp1 in U87 and U251 cells. The knockdown effect of shRNA was tested by Western blotting analysis (Fig. 6D). Knockdown of Sp1 expression can dramatically inhibit the colony formation of GBM cells (Fig. 6E). This result was consistent with the effect of miR-377 overexpression. Moreover, concomitant overexpression of miR-377 and Sp1 abrogated the inhibitory effect of miR-377 on the colony formation ability and reversed miR-377-induced G1 arrest of U87 cells compared with cells transfected with miR-377 and the miR-NC groups (Figs. 2B and 6F). Furthermore, the reduced Cylin D1 expression was rescued by overexpression of Sp1 in miR-377-overexpressing cells (Fig. 6G) or by suppression of miR-377 in Sp1 knockdown cells (Fig. 6H).
Fig. 6.

Sp1 is involved in miR-377-induced tumor-suppressive effects. (A) Western blot analysis of Sp1 expression in U87 cells after Sp1 overexpression. β-actin served as the loading control. (B) Colony formation assay performed in U87 cells after Sp1 overexpression. **P < .01. (C) Representative H&E staining for tumor cytostructure in tumors originated from Sp1 or control vector-transfected U87 cells. Scale bar = 1 mm (D) Western blot analysis of Sp1 expression in U87 and U251 cells after knockdown of Sp1. β-actin served as the loading control. (E) Colonies grown from U87 and U251 cells transfected with sh-NC or sh-Sp1 were counted. The experiments were performed 3 times using triplicate samples, and average scores are indicated with error bars on the histogram. **P < .01. Scale bar = 100 µm (F) The cell cycle distribution of miR-NC or miR-377-transduced U87 and U251 cells by introducing pEGFP-Sp1 or empty vector pEGFP. (G) The rescue experiment was performed by introducing pEGFP-Sp1 or pEGFP in the presence or absence of ectopic miR-377 or miR-NC expression in U87 cells. Western blot analysis of Sp1, Cyclin D1, MMP-2, and MMP-9 in the indicated cells. β-actin was used as the loading control. (H) Western blot analysis of Sp1, Cyclin D1, MMP-2, and MMP-9 in shNC or shSp1 cells after transfection of anti-NC or anti-miR-377. β-actin was used as the loading control.
It is known that an invasive nature is one of the cardinal features of GBM. It has been recently reported that Sp1 is involved in the modulation of GBM invasion.26 Since Sp1 is a direct and functional target of miR-377, we investigated whether miR-377 was involved in GBM invasion. Transwell assay was performed to examine the effect of miR-377 on cell invasion. To eliminate the potential cofounding effect of cell proliferation on cell invasion, the transwell experiments were also carried out in the presence of mitomycin C to arrest cell proliferation afterwards. We found that miR-377-overexpressing U87 cells showed significantly lower invasive efficiencies compared with miR-NC cells in the absence of mitomycin C (P < .01, Fig. 7A and C). Next, miR-NC and miR-377-overexpressing U87 cells pretreated with mitomycin C were applied in the transwell assays. Although mitomycin C eliminated the contribution of cell proliferation, we found that the number of miR-377-overexpressing U87 cells penetrating through the transwell was still significantly reduced relative to the miR-NC cells (P < .01, Fig. 7A and C). Parallel experiments were performed in U251 cells transfected with miR-377 or miR-NC, and similar results were observed (P < .01, Fig. 7B and D).
Fig. 7.

SP1 is involved in miR-377-induced reduced invasive capability. (A and B) Transwell invasion assay with miR-NC- or miR-377-transduced U87 and U251 cells without transfection or transfected with pEGFP-Sp1 in the presence or absence of mitomycin C. Scale bar = 100 µm (C and D) Invasion of the above cells was quantitatively analyzed. Columns are the average of 3 independent experiments. **P < .01. (E) Western blot analysis of MMP-2 and MMP-9 in the U87 and U251 cells without transfection or transfected with miR-377 or miR-NC. β-actin was used as the loading control. (F) Histological features of brain tumors derived from miR-NC and miR-377-transduced primary invasive cell lines. Scale bar = 200 µm.
We next determined whether Sp1 was a critical mediator of miR-377 in GBM cell invasion. Knockdown of Sp1 resulted in significantly reduced invasive potential of U87 and U251 cells to an extent comparable to that seen with miR-377 overexpression (data not shown), whereas re-expression of Sp1 in miR-377-overexpressing cells reversed the attenuation of invasive capability induced by miR-377 (Fig. 7A–D). Moreover, miR-377 overexpression led to reduced levels of MMP-2 and MMP-9, which play an important role in tumor invasion and metastasis (Fig. 7E). These reduced MMP-2 and MMP-9 expressions were rescued by overexpression of Sp1 in miR-377-overexpressing cells (Fig. 6G) or by suppression of miR-377 in Sp1 knockdown cells (Fig. 6H). Furthermore, using highly invasive primary GBM cell lines, we found that overexpression of miR-377 in those cells displayed significantly decreased invasive activity compared with controls in vitro (P < .01, Supplementary Fig. S4A and B). In addition, we established intracranial xenografts in nude mice using highly invasive primary GBM cell lines transfected with miR-377 or miR-NC. Consistent with the in vitro data, tumors derived from miR-377-transduced primary GBM cells displayed significantly decreased invasive activity compared with miR-NC-transduced cells (Fig. 7F). Taken together, these results indicated that Sp1 is critical for miR-377-induced tumor suppressive effect in GBM.
MiR-377 and Sp1 Are Inversely Expressed in GBM Specimens
To address the clinical significance of the miR-377-Sp1 interaction in GBM, we performed immunohistochemistry to detect the expression of Sp1 in 107 GBM and 10 NBTs. We showed that Sp1 protein was mainly located in the nucleus of tumor cells. All tumors showed positive immunostaining of Sp1 protein: 45 of 107 GBM cases (42.06%) showed weakly positive staining, and the remaining 62 cases (57.94%) showed strongly positive staining (Fig. 8A). In contrast, all NBTs showed negative or weakly positive immunostaining of Sp1 protein (data not shown). We also found that the stronger immunoreactivity of Sp1 was significantly associated with lower miR-377 expression (P < .001, Fig. 8B and Supplementary Table S3). Taken together, these observations suggested that Sp1 expression is elevated in GBM tissues and that its enhancement is correlated with reduced miR-377.
Fig. 8.

Histological analysis of Sp1 protein expression in primary GBM tissues. (A) Representative images of weakly positive or strongly positive Sp1 expression in GBM tissue samples. (B) The immunoreactivity of Sp1 protein in GBM tissues displayed a significant inverse correlation with the relative level of miR-377 expression. **P < .001. Scale bar = 100 µm (upper panels) and 400 µm (lower panels).
Discussion
It is worth noting that a single miRNA can influence the expression of various transcripts having important roles in human diseases. Recently, miR-377 has been found to play a critical role in the pathogenesis of diabetic nephropathy in both human cell lines and mouse models by downmodulating PAK1, SOD1, and SOD2 protein expression, leading to increased fibronectin production.42 Beckman et al. demonstrated that miR-377 was involved in the regulation of HO-1 expression during hemolysis.43 Noticeably, miR-377 was also found to be significantly deregulated in some malignancies, including late-stage and high-grade ovarian cancer,44 breast cancer,45 metastatic prostate cancer,46 and splenic marginal zone lymphoma.47 However, the role of miR-377 in cancer development and progression remains unclear. Our current study showed that miR-377 was frequently downregulated in both GBM tissues and cell lines. Based on our results from 107 GBM samples, we demonstrated that low-level miR-377 expression was correlated with decreased survival in participants with GBM. Moreover, restoration of miR-377 can reduce GBM cell proliferation in vitro and in the orthotopic xenograft tumor models, block the G1/S transition and suppress cell invasion. Importantly, in vivo subcutaneous xenograft tumor growth analysis revealed a significant decrease in tumor growth following treatment with the miR-377 mimic, indicating its therapeutic potential for patients with GBM. Although effective delivery of miRNA mimic into the brain, crossing the blood-brain barrier, remains challenging, the striking inhibitory effect of miR-377 on subcutaneous tumor growth strongly suggests that further efforts toward development of miR-377-based therapeutics are fully warranted.
Previous studies have shown that Sp1 is a key transcriptional regulator that exerts a variety of biological functions. A variety of cancers have recently been shown to overexpress Sp1 proteins. Sp1 proteins are also known to play an important role in the regulation of multiple oncogenes and tumor suppressor genes. More recently, elevated expression of SP1 has been observed in gliomas.31 However, the molecular mechanism underlying the observed Sp1 upregulation in glioma is unknown. In the present study, we showed for the first time that miR-377 exerts its function by specifically targeting Sp1 in GBM. We demonstrated that downregulation of miR-377 frequently enhances Sp1 expression, whereas overexpression of miR-377 inhibites the expression of Sp1 at posttranscriptional levels. Moreover, we provided evidence from the luciferase activity assay that Sp1 is a direct and functional target of miR-377. Furthermore, we found that the expression levels of Sp1 protein are inversely correlated with the expression levels of miR-377 in GBM tissues. Thus, it was concluded that overexpression of the Sp1 in GBM cells could be the result of decreased levels of miR-377.
The invasion of GBM cells into regions of the normal brain is a critical factor that limits current therapeutic efficacy for this disease. Great effort has been put into clarifying the mechanisms underlying the aggressive nature of GBM. Recent studies have linked the upregulation of Sp1 protein to enhanced invasion of GBM, possibly through upregulating MMP-2 expression.26 In this study, we identified miR-377 as a major mediator of GBM invasiveness via directly targeting Sp1. Indeed, introduction of miR-377 may reduce the expression of Sp1, which subsequently downregulates the downstream targets of Sp1, MMP-2, and MMP-9 and results in decreased GBM cell invasion. Our findings highlighted the importance of miR-377/Sp1 axis in acquiring invasive phenotype of GBM cells.
Moreover, we observed that knockdown of Sp1 by RNAi has an effect on in vitro proliferation and invasion that is similar to that of the restoration of miR-377, whereas overexpression of Sp1 abrogates the effect of inhibition of cell proliferation and invasion by miR-377. Our findings provide the first evidence that Sp1 is a predominant mediator of miR-377-induced tumor-suppressive function. We propose that elevated Sp1, induced by decreased miR-377, may drive cell proliferation and invasion and consequently facilitate the development and progression of GBM. Nevertheless, further studies are needed to determine the exact mechanism of decreased miR-377 expression during the progression of GBM and to further explore possible targets of miR-377. An additional large expansion cohort, incorporating the expression of Sp1 and miR-377, should also be further investigated.
In summary, we found that miR-377 is significantly downregulated in GBM, and that reduced miR-377 expression is associated with poor survival. Moreover, we demonstrated, for the first time, the role of miR-377/Sp1 axis in regulating GBM proliferation and invasion. This newly identified miR-377/Sp1 link provides new insight into the mechanisms underlying GBM development, and targeting miR-377/Sp1 axis may represent a promising therapeutic strategy for GBM treatment.
Supplementary material
Funding
This work was supported by the National Natural Science Foundation of China (81201978, No. 81172389, No. 81072078, No. 81200362, No. 81170786, No. 81102078), the Jiangsu Province Natural Science Foundation (BK2012483, BK2010580), the Program for Advanced Talents Within Six Industries of Jiangsu Province (2012-WSN-019), the National High Technology Research and Development Program of China (863) (2012AA02A508), International Cooperation Program (2012DFA30470), the Jiangsu Province Key Provincial Talents Program (RC2011051), the Jiangsu Province Key Discipline of Medicine (XK201117), the Jiangsu Provincial Special Program of Medical Science (BL2012028), the Program for Development of Innovative Research Team in the First Affiliated Hospital of Nanjing Medical University, the Provincial Initiative Program for Excellency Disciplines, Jiangsu Province, and the Priority Academic Program Development of Jiangsu Higher Education Institutions (PAPD).
Conflict of interest of statement: None declared.
Supplementary Material
References
- 1.Stupp R, Mason WP, van den Bent MJ, et al. Radiotherapy plus concomitant and adjuvant temozolomide for glioblastoma. N Engl J Med. 2005;352(10):987–996. doi: 10.1056/NEJMoa043330. [DOI] [PubMed] [Google Scholar]
- 2.He L, Hannon GJ. MicroRNAs: small RNAs with a big role in gene regulation. Nat Rev Genet. 2004;5(7):522–531. doi: 10.1038/nrg1379. [DOI] [PubMed] [Google Scholar]
- 3.Calin GA, Croce CM. MicroRNA signatures in human cancers. Nat Rev Cancer. 2006;6(11):857–866. doi: 10.1038/nrc1997. [DOI] [PubMed] [Google Scholar]
- 4.Lu J, Getz G, Miska EA, et al. MicroRNA expression profiles classify human cancers. Nature. 2005;435(7043):834–838. doi: 10.1038/nature03702. [DOI] [PubMed] [Google Scholar]
- 5.Shenouda SK, Alahari SK. MicroRNA function in cancer: oncogene or a tumor suppressor? Cancer Metastasis Rev. 2009;28(3–4):369–378. doi: 10.1007/s10555-009-9188-5. [DOI] [PubMed] [Google Scholar]
- 6.Munker R, Calin GA. MicroRNA profiling in cancer. Clin Sci (Lond) 2011;121(4):141–158. doi: 10.1042/CS20110005. [DOI] [PubMed] [Google Scholar]
- 7.Garzon R, Fabbri M, Cimmino A, et al. MicroRNA expression and function in cancer. Trends Mol Med. 2006;12(12):580–587. doi: 10.1016/j.molmed.2006.10.006. [DOI] [PubMed] [Google Scholar]
- 8.Babashah S, Soleimani M. The oncogenic and tumour suppressive roles of microRNAs in cancer and apoptosis. Eur J Cancer. 2011;47(8):1127–1137. doi: 10.1016/j.ejca.2011.02.008. [DOI] [PubMed] [Google Scholar]
- 9.Shi L, Cheng Z, Zhang J, et al. hsa-mir-181a and hsa-mir-181b function as tumor suppressors in human glioma cells. Brain Res. 2008;1236:185–193. doi: 10.1016/j.brainres.2008.07.085. [DOI] [PubMed] [Google Scholar]
- 10.Shi L, Zhang J, Pan T, et al. MiR-125b is critical for the suppression of human U251 glioma stem cell proliferation. Brain Res. 2010;1312:120–126. doi: 10.1016/j.brainres.2009.11.056. [DOI] [PubMed] [Google Scholar]
- 11.Sun L, Yan W, Wang Y, et al. MicroRNA-10b induces glioma cell invasion by modulating MMP-14 and uPAR expression via HOXD10. Brain Res. 2011;1389:9–18. doi: 10.1016/j.brainres.2011.03.013. [DOI] [PubMed] [Google Scholar]
- 12.Shi ZM, Wang J, Yan Z, et al. MiR-128 inhibits tumor growth and angiogenesis by targeting p70S6K1. PLoS One. 2012;7(3):e32709. doi: 10.1371/journal.pone.0032709. [DOI] [PMC free article] [PubMed] [Google Scholar]
- 13.Wang YY, Sun G, Luo H, et al. MiR-21 modulates hTERT through a STAT3-dependent manner on glioblastoma cell growth. CNS Neurosci Ther. 2012;18(9):722–728. doi: 10.1111/j.1755-5949.2012.00349.x. [DOI] [PMC free article] [PubMed] [Google Scholar]
- 14.Shi ZM, Wang XF, Qian X, et al. MiRNA-181b suppresses IGF-1R and functions as a tumor suppressor gene in gliomas. RNA. 2013;19(4):552–560. doi: 10.1261/rna.035972.112. [DOI] [PMC free article] [PubMed] [Google Scholar]
- 15.Tao T, Wang Y, Luo H, et al. Involvement of FOS-mediated miR-181b/miR-21 signalling in the progression of malignant gliomas. Eur J Cancer. 2013;49(14):3055–3063. doi: 10.1016/j.ejca.2013.05.010. [DOI] [PubMed] [Google Scholar]
- 16.Sana J, Hajduch M, Michalek J, et al. MicroRNAs and glioblastoma: roles in core signalling pathways and potential clinical implications. J Cell Mol Med. 2011;15(8):1636–1644. doi: 10.1111/j.1582-4934.2011.01317.x. [DOI] [PMC free article] [PubMed] [Google Scholar]
- 17.Hummel R, Maurer J, Haier J. MicroRNAs in brain tumors: a new diagnostic and therapeutic perspective? Mol Neurobiol. 2011;44(3):223–234. doi: 10.1007/s12035-011-8197-x. [DOI] [PubMed] [Google Scholar]
- 18.Dynan WS, Tjian R. The promoter-specific transcription factor Sp1 binds to upstream sequences in the SV40 early promoter. Cell. 1983;35(1):79–87. doi: 10.1016/0092-8674(83)90210-6. [DOI] [PubMed] [Google Scholar]
- 19.Zannetti A, Del Vecchio S, Carriero MV, et al. Coordinate up-regulation of Sp1 DNA-binding activity and urokinase receptor expression in breast carcinoma. Cancer Res. 2000;60(6):1546–1551. [PubMed] [Google Scholar]
- 20.Chiefari E, Brunetti A, Arturi F, et al. Increased expression of AP2 and Sp1 transcription factors in human thyroid tumors: a role in NIS expression regulation? BMC Cancer. 2002;2:35. doi: 10.1186/1471-2407-2-35. [DOI] [PMC free article] [PubMed] [Google Scholar]
- 21.Yin P, Zhao C, Li Z, et al. Sp1 is involved in regulation of cystathionine γ-lyase gene expression and biological function by PI3 K/Akt pathway in human hepatocellular carcinoma cell lines. Cell Signal. 2012;24(6):1229–1240. doi: 10.1016/j.cellsig.2012.02.003. [DOI] [PubMed] [Google Scholar]
- 22.Shi Q, Le X, Abbruzzese JL, et al. Constitutive Sp1 activity is essential for differential constitutive expression of vascular endothelial growth factor in human pancreatic adenocarcinoma. Cancer Res. 2001;61(10):4143–4154. [PubMed] [Google Scholar]
- 23.Yao JC, Wang L, Wei D, et al. Association between expression of transcription factor Sp1 and increased vascular endothelial growth factor expression, advanced stage, and poor survival in patients with resected gastric cancer. Clin Cancer Res. 2004;10(12 Pt 1):4109–4117. doi: 10.1158/1078-0432.CCR-03-0628. [DOI] [PubMed] [Google Scholar]
- 24.Kong LM, Liao CG, Fei F, et al. Transcription factor Sp1 regulates expression of cancer-associated molecule CD147 in human lung cancer. Cancer Sci. 2010;101(6):1463–1470. doi: 10.1111/j.1349-7006.2010.01554.x. [DOI] [PMC free article] [PubMed] [Google Scholar]
- 25.Lou Z, O'Reilly S, Liang H, et al. Down-regulation of overexpressed Sp1 protein in human fibrosarcoma cell lines inhibits tumor formation. Cancer Res. 2005;65(3):1007–1017. [PubMed] [Google Scholar]
- 26.Guan H, Cai J, Zhang N, et al. Sp1 is upregulated in human glioma, promotes MMP-2-mediated cell invasion and predicts poor clinical outcome. Int J Cancer. 2012;130(3):593–601. doi: 10.1002/ijc.26049. [DOI] [PubMed] [Google Scholar]
- 27.Sonoda Y, Ozawa T, Hirose Y, et al. Formation of intracranial tumors by genetically modified human astrocytes defines four pathways critical in the development of human anaplastic astrocytoma. Cancer Res. 2001;61(13):4956–4960. [PubMed] [Google Scholar]
- 28.Wang H, Zhang SY, Wang S, et al. REV3L confers chemoresistance to cisplatin in human gliomas: the potential of its RNAi for synergistic therapy. Neuro Oncol. 2009;11(6):790–802. doi: 10.1215/15228517-2009-015. [DOI] [PMC free article] [PubMed] [Google Scholar]
- 29.Wang H, Wu W, Wang HW, et al. Analysis of specialized DNA polymerases expression in human gliomas: association with prognostic significance. Neuro Oncol. 2010;12(7):679–686. doi: 10.1093/neuonc/nop074. [DOI] [PMC free article] [PubMed] [Google Scholar]
- 30.Chan JA, Krichevsky AM, Kosik KS. MicroRNA-21 is an antiapoptotic factor in human glioblastoma cells. Cancer Res. 2005;65(14):6029–6033. doi: 10.1158/0008-5472.CAN-05-0137. [DOI] [PubMed] [Google Scholar]
- 31.Gabriely G, Yi M, Narayan RS, et al. Human glioma growth is controlled by microRNA-10b. Cancer Res. 2011;71(10):3563–3572. doi: 10.1158/0008-5472.CAN-10-3568. [DOI] [PMC free article] [PubMed] [Google Scholar]
- 32.Godlewski J, Nowicki MO, Bronisz A, et al. Targeting of the Bmi-1 oncogene/stem cell renewal factor by microRNA-128 inhibits glioma proliferation and self-renewal. Cancer Res. 2008;68(22):9125–9130. doi: 10.1158/0008-5472.CAN-08-2629. [DOI] [PubMed] [Google Scholar]
- 33.Wu S, Lin Y, Xu D, et al. MiR-135a functions as a selective killer of malignant glioma. Oncogene. 2012;31(34):3866–3874. doi: 10.1038/onc.2011.551. [DOI] [PubMed] [Google Scholar]
- 34.Kato J, Matsushime H, Hiebert SW, et al. Direct binding of cyclin D to the retinoblastoma gene product (pRb) and pRb phosphorylation by the cyclin D-dependent kinase CDK4. Genes Dev. 1993;7(3):331–342. doi: 10.1101/gad.7.3.331. [DOI] [PubMed] [Google Scholar]
- 35.Lundberg AS, Weinberg RA. Functional inactivation of the retinoblastoma protein requires sequential modification by at least two distinct cyclin-cdk complexes. Mol Cell Biol. 1998;18(2):753–761. doi: 10.1128/mcb.18.2.753. [DOI] [PMC free article] [PubMed] [Google Scholar]
- 36.Weinberg RA. The retinoblastoma protein and cell cycle control. Cell. 1995;81(3):323–330. doi: 10.1016/0092-8674(95)90385-2. [DOI] [PubMed] [Google Scholar]
- 37.Bader AG, Brown D, Winkler M. The promise of microRNA replacement therapy. Cancer Res. 2010;70(18):7027–7030. doi: 10.1158/0008-5472.CAN-10-2010. [DOI] [PMC free article] [PubMed] [Google Scholar]
- 38.Kota J, Chivukula RR, O'Donnell KA, et al. Therapeutic microRNA delivery suppresses tumorigenesis in a murine liver cancer model. Cell. 2009;137(6):1005–1017. doi: 10.1016/j.cell.2009.04.021. [DOI] [PMC free article] [PubMed] [Google Scholar]
- 39.Takeshita F, Patrawala L, Osaki M, et al. Systemic delivery of synthetic microRNA-16 inhibits the growth of metastatic prostate tumors via downregulation of multiple cell-cycle genes. Mol Ther. 2010;18(1):181–187. doi: 10.1038/mt.2009.207. [DOI] [PMC free article] [PubMed] [Google Scholar]
- 40.Trang P, Medina PP, Wiggins JF, et al. Regression of murine lung tumors by the let-7 microRNA. Oncogene. 2010;29(11):1580–1587. doi: 10.1038/onc.2009.445. [DOI] [PMC free article] [PubMed] [Google Scholar]
- 41.Wiggins JF, Ruffino L, Kelnar K, et al. Development of a lung cancer therapeutic based on the tumor suppressor microRNA-34. Cancer Res. 2010;70(14):5923–5930. doi: 10.1158/0008-5472.CAN-10-0655. [DOI] [PMC free article] [PubMed] [Google Scholar]
- 42.Wang Q, Wang Y, Minto AW, et al. MicroRNA-377 is up-regulated and can lead to increased fibronectin production in diabetic nephropathy. FASEB J. 2008;22(12):4126–4135. doi: 10.1096/fj.08-112326. [DOI] [PMC free article] [PubMed] [Google Scholar]
- 43.Beckman JD, Chen C, Nguyen J, et al. Regulation of heme oxygenase-1 protein expression by miR-377 in combination with miR-217. J Biol Chem. 2011;286(5):3194–3202. doi: 10.1074/jbc.M110.148726. [DOI] [PMC free article] [PubMed] [Google Scholar]
- 44.Zhang L, Volinia S, Bonome T, et al. Genomic and epigenetic alterations deregulate microRNA expression in human epithelial ovarian cancer. Proc Natl Acad Sci USA. 2008;105(19):7004–7009. doi: 10.1073/pnas.0801615105. [DOI] [PMC free article] [PubMed] [Google Scholar]
- 45.Lowery AJ, Miller N, Devaney A, et al. MicroRNA signatures predict oestrogen receptor, progesterone receptor and HER2/neu receptor status in breast cancer. Breast Cancer Res. 2009;11(3):R27. doi: 10.1186/bcr2257. [DOI] [PMC free article] [PubMed] [Google Scholar]
- 46.Formosa A, Markert EK, Lena AM, et al. MicroRNAs, miR-154, miR-299–5p, miR-376a, miR-376c, miR-377, miR-381, miR-487b, miR-485–3p, miR-495 and miR-654–3p, mapped to the 14q32.31 locus, regulate proliferation, apoptosis, migration and invasion in metastatic prostate cancer cells. Oncogene. 2013 doi: 10.1038/onc.2013.451. doi:10.1038/onc.2013.451. [DOI] [PubMed] [Google Scholar]
- 47.Arribas AJ, Gómez-Abad C, Sánchez-Beato M, et al. Splenic marginal zone lymphoma: comprehensive analysis of gene expression and miRNA profiling. Mod Pathol. 2013;26(7):889–901. doi: 10.1038/modpathol.2012.220. [DOI] [PubMed] [Google Scholar]
Associated Data
This section collects any data citations, data availability statements, or supplementary materials included in this article.