

Abstract
T-cell activation requires increased ATP and biosynthesis to support proliferation and effector function. Most models of T-cell activation are based on in vitro culture systems and posit that aerobic glycolysis is employed to meet increased energetic and biosynthetic demands. By contrast, T cells activated in vivo by alloantigens in graft-versus-host disease (GVHD) increase mitochondrial oxygen consumption, fatty acid uptake, and oxidation, with small increases of glucose uptake and aerobic glycolysis. Here we show that these differences are not a consequence of alloactivation, because T cells activated in vitro either in a mixed lymphocyte reaction to the same alloantigens used in vivo or with agonistic anti-CD3/anti-CD28 antibodies increased aerobic glycolysis. Using targeted metabolic 13C tracer fate associations, we elucidated the metabolic pathway(s) employed by alloreactive T cells in vivo that support this phenotype. We find that glutamine (Gln)-dependent tricarboxylic acid cycle anaplerosis is increased in alloreactive T cells and that Gln carbon contributes to ribose biosynthesis. Pharmacological modulation of oxidative phosphorylation rapidly reduces anaplerosis in alloreactive T cells and improves GVHD. On the basis of these data, we propose a model of T-cell metabolism that is relevant to activated lymphocytes in vivo, with implications for the discovery of new drugs for immune disorders.
Introduction
T cells activated in vitro increase glucose uptake and flux through glycolysis (Frauwirth et al., 2002). In this metabolic state termed “aerobic glycolysis,” only a small fraction of glucose is oxidized in mitochondria (MacIver et al., 2013; Pearce et al., 2013). Glycolysis supplies the majority of ATP, and glucose-derived intermediates enter the pentose phosphate pathway and other biosynthetic routes to provide substrates for the synthesis of nucleic acids, amino acids, and lipids (Wang et al., 2011). On the basis of these observations, it has been proposed that blocking glucose uptake and metabolism could have therapeutic potential for treating immune disease (Palsson-McDermott and O'Neill, 2013).
In contrast to T cells activated in vitro, T cells activated in vivo by major histocompatibility (MHC) alloantigens during graft-versus-host disease (GVHD) take on a different metabolic profile: compared with resting T cells these cells modestly increase glucose uptake and glycolytic flux that results in lactate production (Gatza et al., 2011). Instead, mitochondrial oxidative activity coupled to ATP synthesis supports energy production (Gatza et al., 2011; Byersdorfer et al., 2013; Saha et al., 2013). Without a large change in glucose uptake and consumption, other metabolic adaptations must occur in alloreactive T cells in vivo to support biosynthesis. Similar to alloantigen-activated cells, T cells from patients with certain autoimmune diseases have an oxidative phenotype (Wahl et al., 2012). Thus, metabolic adaptations in GVHD T cells may be representative of pathogenic T-cell responses in other diseases associated with chronic self-antigen exposure.
In addition to producing energy, the mitochondrial tricarboxylic acid (TCA) cycle can supply intermediates to biosynthetic pathways that produce sugars, nucleic acids, amino acids, and lipids (Bauer et al., 2005; Berg et al., 2012). When TCA cycle intermediates are used in this way (referred to as branching metabolism), they must be replaced to allow continued function of the cycle (Owen et al., 2002). Anaplerosis is the term used to describe the biochemical flux that generates TCA cycle intermediates to replace carboxylic acids withdrawn for other synthetic routes. The most important anaplerotic pathways are oxaloacetate formation from carboxylation of pyruvate derived from glucose-, alanine-, or serine and conversion of glutamine to ketoglutarate (Owen et al., 2002).
Given their relatively limited glucose uptake and metabolism in vivo, we hypothesized that alloreactive T cells may employ other carbon sources to biosynthesize intermediates classically dependent on glucose. To test this hypothesis, we administered 13C-labeled glucose, glutamine, or palmitate tracers to mice after allogeneic bone marrow transplantation (BMT), isolated T cells, and analyzed the redistribution of 13C from tracers into isotopomers of ribose, fatty acids, and glutamate by mass spectrometry (MS). We found that alloreactive T cells increase TCA cycle- and glutamine-dependent anaplerosis and contribute glutamine-derived carbon to the biosynthesis of ribose, consistent with gluconeogenesis. This finding provides the first evidence that metabolic paths that convert glutamine into ribose are functional in T cells. A novel immunomodulator with activity against murine GVHD reduces the redirection of glutamine-derived carbon into ribose biosynthesis in alloreactive T cells, and based on these findings we propose a model to explain how this reduction may contribute to disease improvement. On the basis of these data, we propose a model of T-cell metabolism that is relevant to activated lymphocytes in vivo, with implications for the discovery of new drugs for immune disorders.
Materials and Methods
Mice.
Female B6.Ly-5a (B6-Ly5.2:H-2b, CD45.1+Thy1.2+) and B6D2F1 (H-2bxd, CD45.2+Thy1.2+) were purchased from Charles River Laboratories (Portage, MI). Female B6.PL-Thy1a (B6-Thy1.1: H-2b, CD45.2+Thy1.1+) and C3H.SW (H-2b, CD45.2+) were purchased from The Jackson Laboratory (Bar Harbor, ME). All mice were at least 8 weeks of age before use and were cared for according to the Guidelines for Laboratory Animal Medicine at the University of Michigan.
Transplantation, 13C-Tracer Administration, and ATPase Inhibitor Treatment.
To induce GVHD in nonirradiated recipients, allogeneic (B6D2F1) recipient mice were infused with 50.0 × 10⁶ bulk splenocytes from B6-Thy1.1 donor mice. To induce GVHD in irradiated recipients, B6-Ly5.2 mice were conditioned with a single dose of 900-cGy TBI (137Cs source), followed by intravenous infusion of 5.0 × 10⁶ BM cells plus 5.0 × 10⁶ positively selected CD90+ T cells from allogeneic (C3H.SW) or syngeneic (B6) donor mice on day 0. In some experiments, donor splenocytes or T cells were labeled with carboxyfluorescein diacetate succinimidyl ester (CFSE) (Vybrant CFDA SE Cell Tracer Kit; Invitrogen, Carlsbad, CA) per the manufacturer’s protocol before their infusion.
[U-13C5]Glutamine and [U-13C6]glucose (Sigma-Aldrich, St. Louis, MO) was dissolved in sterile phosphate-buffered saline and administered to animals by intraperitoneal injection at 10 mg/kg. Animals were euthanized 1 hour after administration of the tracers, and tissues were collected for analysis. [U-13C16]Palmitate (Sigma-Aldrich) was prepared as a suspension in a phosphate-buffered saline with glucose (25 mM) and administered by oral gavage at 0.5 mg/kg. Animals were euthanized 3 hours after administration of palmitate tracer to allow for absorption. LYC-31138 [(Z)-N-((tert-butylamino)((5-(4-fluorophenyl)-1H-pyrazol-3-yl)amino)methylene)-4-(trifluoromethyl)benzamide] was synthesized as described and administered orally in vehicle (30% labrifil/solutol with 0.1% carboxymethylcellulose) at a dosage of 30 mg/kg (Glick et al., 2012). Transplanted mice were housed in sterile microisolator cages and given autoclaved hyperchlorinated (pH 3.0) drinking water for 3 weeks after transplant.
Isolation of T Cells.
Unstimulated T cells were purified by positive selection with anti-CD90/Thy1.2 microbeads (Miltenyi Biotec, San Diego, CA) from spleens of B6 animals on the day of analysis. Donor (Thy1.1) T cells were isolated from spleens of B6D2F1 animals 8 days after infusion of 50 × 106 B6-Thy1.1 splenocytes with a combination of phycoerythrin–anti-Thy1.1 (BD Biosciences, San Jose, CA) and anti-phycoerythrin microbeads (Miltenyi Biotec) and were typically >80% pure. For isotopomer analyses, T-cell pellets were sonicated in water and snap-frozen in liquid nitrogen before analysis.
In Vitro T-Cell Activation.
T cells from B6 mice isolated by positive selection with anti-CD90 were mixed at a ratio of 2:1 with red blood cell lysed spleen cells from either B6 animals (syngeneic control) or B6D2F1 animals (alloactivation conditions) in Dulbecco’s modified Eagle’s medium culture media containing glucose (25 mM) and glutamine (4 mM; Gibco/Life Technologies, Grand Island, NY) supplemented with 10% fetal bovine serum. Before analysis, dead cells and debris were removed by centrifugation and activated cells (CD62L−) were purified by negative selection. For activation through CD3 and CD28, T cells from B6 mice were incubated in the same culture media with anti-CD3 (clone 145-2C11; eBioscience, San Diego, CA) and anti-CD28 antibodies (clone 37.51; eBioscience) at a concentration of 0.5 μg/ml.
Flow Cytometry.
Cells in single-cell suspension were isolated from the spleens of transplanted mice. Cell surface staining was performed after Fc receptor blockade. To measure total cellular glucose transporter 1 (GLUT1), cells were surface-stained and fixed, and, after 1 to 2 days, permeabilized and incubated for 20 minutes with 10% normal mouse serum at 4°C. The cells were then incubated with rabbit anti-GLUT1 (Abcam, Cambridge, MA) or isotype control antibodies for 45 minutes at 4°C, washed twice, incubated with allophycocyanin-labeled anti-rabbit Fab (Jackson ImmunoResearch, West Grove, PA) for 45 minutes at 4°C and washed twice more. All samples were analyzed with a BD Canto cytometer and CellQuest software.
Lactate Production Measurements.
To measure lactate production, cells were washed and resuspended at 5 × 10⁶ to 15 × 106 cells/ml in Dulbecco’s modified Eagle’s medium, and aliquots were quenched at four time points over 2 to 3 hours with perchloric acid (0.6 M). After removal of cellular debris and neutralization with NaOH, lactate concentrations at three or more time points were determined by incubating samples (10–20 μl) with lactate dehydrogenase (1 μl) and glutamate-pyruvate transaminase (0.375 μl) in buffer (240 μl) containing glutamate (116 mM) and NAD (0.96 mM) at pH 8.9. Lactate concentrations were determined by monitoring absorption at 340 nM, and the rate of lactate production was calculated as a function of time and cell concentration.
Isotopomer Analysis.
Fatty acids were extracted by saponification of Trizol (500 μl; Invitrogen) cell extract, after removal of the upper glycogen-containing and RNA-containing supernatant, using 30% KOH and 70% ethanol (300 μl each) for 2 hours. Fatty acids were extracted by further acidification using hydrochloric acid (6 N) to a pH <2.0 and repeated vortexing with petroleum ether (5 ml). Fatty acids (palmitate) were monitored at m/z 270, using canola oil as positive control. Glutamate was converted into its n-trifluoroacteyl-n-butyl derivative and monitored at ion clusters at m/z 152 and m/z 198.
Isolation of RNA ribose was performed as previously reported (Boros et al., 2003). Briefly, RNA ribose was first isolated by acid hydrolysis of cellular RNA after Trizol purification from cell pellets. Total RNA abundance was then quantified by spectrophotometric determination in quadruplicate. Cellular ribose was derivatized to its aldonitrile acetate form using hydroxylamine and resuspended in pyridine with acetic anhydride (Supelco, Bellefonte, PA) before mass spectral analyses. The ion cluster was measured around m/z 256 [carbons 1 to 5 of ribose; chemical ionization (total ribose)] and m/z 242 (carbons 1 to 4 of ribose; electron impact ionization) to determine molar enrichment of specific isotopomers of [13C]ribose.
An Agilent Technologies (Palo Alto, CA) 5975 Inert XL Mass Selective Detector connected to HP6890N network gas chromatograph was used to detect mass spectral data under the following settings: GC inlet 230°C, MS source 230°C, MS quad 150°C. For ribose and glutamate analyses, an HP-5 column (30 m length × 250 μm diameter × 0.25 μm thickness) was used, whereas a DB-23 column (60 m length × 250 μm diameter × 0.15 μm thickness) was used for fatty acid measurement (Agilent Technologies).
Statistics for mass spectral analyses were obtained by consecutive and independent injections of (1 μl) sample using an autosampler with optimal split ratios for column loading (106 > abundance > 104 abundance). Data were accepted if the standard sample deviation was below 10% of the normalized peak intensity (integrated peak area of ion currents; 100%) among repeated injections. Data download was performed in triplicate manual peak integrations using modified (background subtracted) spectra under the overlapping isotopomer peaks of the total ion chromatogram window displayed by the Chemstation (Agilent Technologies) software. A two-tailed independent sample t test was used to test for significance between control and treated groups.
The isotope labeled fractions, after subtracting natural 13C enrichment, of all metabolic products from the 13C tracer were found in total ion currents obtained by chromatography separation in the selected ion monitoring mode. These selected ion monitorings included all isotope labeled products with the range that covers all possible single and multiple substitutions, based on the number of carbons making up the reported biomolecules and their fragment. The sum of all labeled isoforms was then generated by the number of 13C substitutions, expressed as labeled fraction, of which positional 13C isoforms were normalized to 100% and expressed as fractions (Σμ) of the 13C-labeled portion of the molecule. The sum of all labeled isoforms was also weighed by the number of 13C position, expressed as 13C content (Σμν).
Analysis of GVHD.
Survival after BMT was monitored daily, and clinical GVHD was assessed weekly with a scoring system that generates a composite GVHD score composed of individual ratings for weight loss, posture, mobility, skin integrity, and fur texture as previously described (Hill et al., 1997).
Statistical Analysis.
Student’s t test was used to test for statistical significance. P values <0.05 were considered statistically significant.
Results
In Vivo and In Vitro Alloactivated T Cells Are Metabolically Distinct.
Alloreactive T cells in vivo modestly increase glycolysis above resting cells, and their glucose usage is lower than in lymphocytes undergoing homeostatic proliferation (Gatza et al., 2011). These data do not fit current models of T-cell activation that describe a large increase in aerobic glycolysis to generate ATP and substrates needed for biosynthesis (Frauwirth et al., 2002; MacIver et al., 2013). To exclude the possibility that this discordance results from the nature of the antigenic stimulation between models, we compared GLUT1 glucose transporter expression, a marker of cellular capacity for glucose uptake, and lactate production in T cells in vivo and in T cells stimulated in vitro by the same alloantigens.
CD4+ and CD8+ T cells alloactivated in vivo proliferate as early as 48 hours after transplant and continue up to 7 days based on dilution of CFSE through cell division. At 2, 4, and 7 days after transplant, the fractions of activated CD4+ cells were 74, 94, and 95%, respectively, and for CD8+ cells the respective fractions were 45, 74, and 89%. In these dividing, alloactivated cells, GLUT1 expression increased over the 7 days by approximately 50% above resting CD8+ cells, whereas there was no significant increase in CD4+ T cells (Fig. 1A). In contrast, proliferating T cells in vitro in a mixed lymphocyte reaction to the same alloantigens used in vivo in which 44% of the CD4+ and 87% of CD8+ cells were divided after 4 day had increased GLUT1 expression >10-fold over naive resting cells with a larger increase observed in CD8+ compared with CD4+ T cells (Fig. 1B). Similar increases were observed in response to a combination of agonistic anti-CD3/anti-CD28 antibodies (Fig. 1B). Lactate production rate in unstimulated naive CD90+ donor T cells was 0.12 nmol/min × 106 cells (S.D. = 0.072) and rose approximately 30-fold to 3.41 nmol/min × 106 cells (S.D. = 1.93, P < 0.01) 48 hours after activation in vitro with anti-CD3/anti-CD28 antibodies (Supplemental Table 1). By contrast, lactate production rate in alloreactive CD90+ donor (Ly5.2+) T cells isolated from mice with GVHD (which was maximal 7 days after transplant) was <5-fold above control cells: 0.53 nmol/min × 106 cells (S.D. = 0.15, P < 0.01). These results support the hypothesis that alloreactive T cells in vivo are metabolically distinct from highly glycolytic in vitro–activated cells and use alternative pathways to meet energetic and biosynthetic requirements.
Fig. 1.

GLUT1 expression of activated T cells. (A) Donor splenocytes (B6-Ly5.2, 50 × 106) were labeled with CFSE and injected into allogeneic F1 B6D2 host mice. At the indicated times, splenocytes were surface stained to identify donor CD4+ or CD8+ T cells and total cellular GLUT1 by flow cytometry. Ten thousand cells were analyzed for each condition. Numbers indicate the GLUT1 median fluorescence intensity of cells gated according to proliferative response determined by CFSE fluorescence. Plots are representative of 3 animals analyzed per time point. (B) For the mixed lymphocyte reaction, purified donor T cells (B6-Ly5.2) were labeled with CFSE and cultured with syngeneic (Syn, B6) or allogeneic (Allo, F1 B6D2) splenocytes for 4 days and stained as above. Alternatively, CFSE-labeled T cells were stained and fixed before culture (Unstim) or after 48-hour culture with anti-CD3/28 antibodies.
Metabolism of In Vivo–Activated T Cells Using 13C-Labeled Tracers.
Without a large increase in glucose consumption, other metabolic adaptations must occur in alloactivated T cells to support biosynthesis. In addition to producing energy, the mitochondrial TCA cycle provides biosynthetic intermediates derived from partial oxidation of anaplerotic substrates that enter the cycle and then branch out for biosynthesis before complete oxidation to CO2. To define TCA cycle activity of alloreactive T cells in vivo, 13C-labeled glutamine, glucose, and palmitate tracers were independently administered to allotransplanted mice (day 8 after transplant) and also to naive mice from the donor and host strains, B6.SJL (H-2b, CD45.1+) and B6D2F1/J (H-2b/d, CD45.1-), respectively. [U-13C5]l-Glutamine and [U-13C6]glucose were given by intraperitoneal injection, whereas [U-13C16]palmitate was given orally because of its lack of solubility. After glutamine and glucose tracer injections (1 hour) or after palmitate tracer was given orally (3 hours to allow tracer absorption), animals were euthanized and then alloreactive and control T-cell populations were isolated from spleens based on congenic markers. Separation of populations was such that the purity of donor and host cells was >80% in all experiments. Metabolites were extracted from cells to analyze 13C incorporation into selected metabolites within alloreactive or control T-cell populations. 13C incorporation was determined by calculating the isotope labeled fraction (% of molecules of a particular metabolite that contain 13C) and the 13C content (% of carbons in a metabolite pool substituted with isotope expressed as average 13C per molecule of targeted metabolite). The relative abundance of a specific position labeled isoform of a targeted metabolite (e.g., m2-glutamate) was determined by normalization to the total 13C-labeled fraction of the metabolite.
Findings with Glutamine Tracer.
When glutamine is metabolized in the mitochondria, less glucose enters the TCA cycle and there is a decreased contribution of glucose to mitochondria-dependent anabolic processes including lipid synthesis (Wise et al., 2008). Because their glucose metabolism is restricted, we reasoned that alloreactive T cells use glutamine for TCA cycle anaplerosis to provide intermediates for biosynthesis. To test this hypothesis, splenic T-cell populations from mice given [U-13C5]l-glutamine tracer were analyzed for 13C incorporation into ribose and palmitate, two critical components of biomass that activated T cells require for growth and division (Vander Heiden et al., 2011).
Briefly, after conversion to α-ketoglutarate, glutamine carbons become an anaplerotic substrate for the TCA cycle (Newsholme et al., 1985a; Owen et al., 2002; Wang et al., 2011). After oxidation in the TCA cycle, glutamine-derived carbon can be exported from the mitochondria (e.g., as citrate, aspartate, or malate), where it can be converted into oxaloacetate in the cytoplasm. Oxaloacetate is a substrate for phosphoenolpyruvate carboxykinase, the entry point that controls gluconeogenesis (Newsholme and Gevers, 1967). Both the product (glucose-6-phosphate) and intermediates of gluconeogenesis can enter the pentose phosphate pathway for ribose synthesis (Berg et al., 2012). As shown in Fig. 2A, the isotope-labeled fraction of RNA ribose derived from [U-13C5]l-glutamine is significantly increased in alloreactive donor T cells, nearly doubling the amount in control cells. Along with an increase in the labeled fraction, the 13C content of RNA ribose is increased to a similar extent (Supplemental Fig. 1). Collectively, these results are consistent with anaplerotic use of glutamine to provide substrates for ribose synthesis.
Fig. 2.

Redistribution of 13C from [U-13C5]glutamine into RNA-ribose and palmitate. (A) Indicated populations of T cells were obtained from transplanted (B6→B6D2 F1) mice 7 days after transplant (n = 4) and control mice (n = 4). Spleen T cells were obtained 1 hour after [U-13C5]glutamine tracer was administered by intraperitoneal injection at 10 mg/kg to the mice. 13C isotope–labeled fraction of RNA-ribose isolated from T cells is shown as mean ± S.D. (B) The percentage of total 13C-labeled palmitate represented by the labeled m6 palmitate isotopomer was determined in the indicated T-cell populations isolated as above. Allo, allogeneic.
There are two pathways for fatty acid and lipid synthesis from glutamine. After conversion to α-ketoglutarate, the forward oxidative function of the TCA cycle generates citrate after the addition of acetate, which enters the cycle as acetyl-CoA. Citrate can be exported from mitochondria to generate oxaloacetate and acetyl-CoA in the cytosol where acetyl-CoA is used to synthesize fatty acids, including palmitate (Spencer et al., 1964). Alternatively, isoforms of isocitrate dehydrogenase (IDH) in both the mitochondria (IDH2/3) and cytosol (IDH1) can convert glutamine-derived α-ketoglutarate to isocitrate by reductive carboxylation (Wise et al., 2011; Metallo et al., 2012; Mullen et al., 2012). Isocitrate isomerizes to citrate, which is then used for fatty acid synthesis. Although less dramatic than the increase in ribose labeling, the percentage of 13C-labeled palmitate derived from [13C]glutamine is trending higher in alloreactive T cells compared with control naive donor T cells (5.2 versus 4.2%, P = 0.08).
[13C]Glutamine labels palmitate more efficiently at high isotopomer positions when reductive carboxylation is active, because it yields citrate and acetyl-CoA with higher labeled fractions. As such, the molar enrichment of highly labeled m6 isotopomers of palmitate is consistent with active reductive carboxylation (Yoo et al., 2008). Because the m6 palmitate fraction is lower in alloreactive T cells relative to control naive donor cells (Fig. 2B), the limited use of glutamine for fatty acid synthesis in alloreactive T cells is unlikely to result from an increase in reductive carboxylation. Together with recent data showing that alloreactive T cells actively import fatty acids from extracellular sources, our results suggest fatty acid uptake is used in preference to de novo synthesis (Byersdorfer et al., 2013).
Glucose and Palmitate Tracers.
With limited aerobic glycolysis (see Fig. 1), the compensatory change in glutamine-dependent anaplerosis for biosynthesis and the observation that glutamine-derived carbon is used for ribose biosynthesis in GVHD T cells, we expected that the use of glucose carbon for ribose and fatty acid biosynthesis would be decreased. To test this hypothesis, [U-13C6]glucose was administered to GVHD and control mice. As predicted, there was no increase in glucose-derived 13C-labeling of RNA-ribose or palmitate in alloreactive donor T cells versus levels in naive donor T cells (Fig. 3). In fact, the 13C-labeled fraction of ribose was lower in alloactivated T cells compared with naive donor cells, consistent with increased reliance on glutamine for ribose synthesis in alloreactive cells. Moreover, the absence of an increase in the labeled fraction of palmitate indicates that alloactivation of T cells in vivo does not drive glucose toward fatty acid synthesis.
Fig. 3.

Redistribution of 13C from [U-13C6]glucose into RNA-ribose and palmitate. (A) Indicated populations of T cells were isolated from B6→B6D2 F1 7 days after transplant (n = 4) and control mice (n = 4 per group) 1 hour after [U-13C6]glucose tracer was administered by intraperitoneal injection. 13C isotope–labeled fraction of RNA-ribose detected in T-cell populations is shown as mean ± S.D. (B) The 13C isotope–labeled fraction of palmitate was measured in T-cell populations isolated from mice treated as described above. Allo, allogeneic; PPP, pentose phosphate pathway.
Although palmitate is not a net anaplerotic substrate, [13C]palmitate-derived carbon that enters the TCA cycle as acetyl-CoA after β-oxidation can exit the cycle through carbon exchange and label biosynthetic products, including ribose. When mice receive [U-13C16]palmitate, the 13C content of ribose in alloreactive T cells is lower than in naive donor cells (Supplemental Fig. 2A). This finding is consistent with increased glutamine-dependent anaplerosis, because we previously showed that total fatty acid uptake and oxidation increase in alloreactive T cells, excluding decreased uptake /utilization as an alternative explanation (Byersdorfer et al., 2013). In addition, among the 13C-containing isotopomers of ribose, the molar enrichment of m2 species is significantly enhanced (Supplemental Fig. 2B). Because m2 ribose is derived from the noncycling, branching mode of the TCA cycle, these results with a second tracer provide further evidence that gluconeogenesis is occurring in T cells in vivo.
Regulation of Anaplerosis in Alloreactive T Cells.
Bz-423 [7-chloro-5-(4-hydroxyphenyl)-1-methyl-3-(naphthalen-2-ylmethyl)-1,3-dihydro-2H-benzo[e][1,4]diazepin-2-one] is a small molecule allosteric modulator of the mitochondrial F1F0-ATPase possessing potent therapeutic activity in murine models of GVHD, lupus, and other immune diseases (Blatt et al., 2002; Bednarski et al., 2003; Johnson et al., 2005, 2006; Gatza et al., 2011). Mice treated with Bz-423 have fewer pathogenic lymphocytes in the periphery and in target organs. Several lines of evidence indicate that in part, this reduction results from redox-regulated apoptosis (Blatt et al., 2002; Gatza et al., 2011). Because inhibition of anaplerosis blocks cell growth and division, we hypothesized that along with increasing apoptosis, modulators of the F1F0-ATPase decrease anaplerosis in GVHD T cells, which could also contribute to the observed reduction in pathogenic lymphocytes (Cantor and Sabatini, 2012).
To test the hypothesis, irradiated C57BL/6 mice were transplanted with bone marrow and CD90+ T cells from allogeneic donor C3H.SW mice (GVHD) or from syngeneic C57BL/6 donor mice (no GVHD control). Beginning 5 days after transplant, mice were treated with LYC-31138 (Supplemental Fig. 3), an ATPase modulator with similar potency against the ATPase as Bz-423 (IC50 for LYC-31338 = 2.72 µM versus 3.2 µM for Bz-423) but with superior oral bioavailability (Supplemental Table 2). Transplanted mice received either LYC-31138 or vehicle by oral gavage every other day for 9 total doses. Treatment with LYC-31338 improved clinical scores of GVHD severity (Fig. 4A) and overall survival (68% for LYC-31138 treated mice at 8 weeks post-transplant versus 34% in vehicle-treated mice; P = 0.009). Analysis of spleens in mice with GVHD revealed that treatment significantly reduced the number pathogenic T cells based on specific depletion of cells from the population of proliferating (CFSElo) alloreactive T cells (Fig. 4B).
Fig. 4.

LYC-31138 reduces GVHD in allotransplanted mice. (A) Irradiated C57BL/6-Ly5.2 mice were injected with bone marrow and CFSE-labeled T cells from C3H.SW mice (allogeneic transplant) or from C57BL/6-Ly5.2 mice (syngeneic transplant). Beginning 5 days after transplant, allogeneic transplanted mice received either LYC-31138 (n = 17; 30 mg/kg) or only the vehicle used to deliver the compound (30% labrifil/solutol with 0.1% carboxymethylcellulose, n =18) by oral gavage every other day. Clinical score shown was monitored after 9 doses. (B) Splenic T cells were isolated from transplanted mice after 4 doses of vehicle or LYC-31138. Cells were analyzed to enumerate donor T-cell number according to subsets indicated by expression of CD4, CD8, and dilution of CFSE to indicate proliferative response in vivo.
To determine if LYC-31138 inhibits anaplerosis in GVHD T cells, 8 days after allogeneic BMT in the B6.SJL→B6D2F1/J model, mice were given [U-13C16]palmitate followed 1 hour later by a dose of drug or vehicle control. After tracer administration when LYC-31138 reaches near maximal plasma levels (2–3 hours), T-cell populations were isolated from the spleens of transplanted and naive donor mice. Glutamate isotopomers were analyzed because after labeling with [13C]palmitate, the molar, fractional enrichment of m2 glutamate is directly proportional to anaplerosis, and conversely m4 glutamate is proportional to repetitive cycling TCA activity (Fig. 5A). As shown in Fig. 5B, alloreactive donor T cells from mice treated with vehicle had higher m2 glutamate and lower levels of m4 glutamate then control cells, consistent with high levels of anaplerosis. Treatment with LYC-31138 significantly decreased m2 glutamate and increased m4 glutamate, indicating that within 2 hours of dosing, the anaplerotic phenotype in pathogenic T cells is reduced.
Fig. 5.
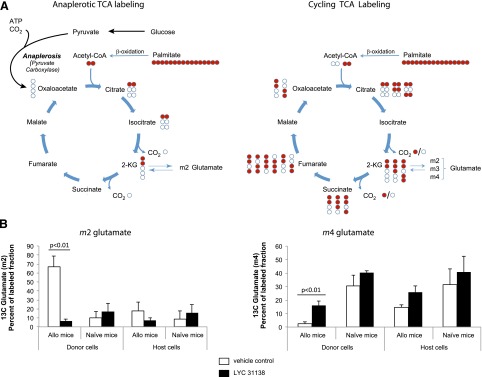
Palmitate carbon redistribution into glutamate isotopomers depends on anaplerosis. (A) Relative redistribution of 13C from palmitate (red circles) into m2 versus m4 glutamate isotopomers reflects anaplerotic versus cycling TCA activity. 2-KG, 2-ketoglutarate. (B) m2 and m4 glutamate isotopomers as percent of 13C-labeled glutamate fraction (mean and standard deviation) detected in the indicated populations of T cells from B6→B6D2 F1 7 days after transplant and in naive mice. Cells were isolated 3 hours after [U-13C16]palmitate tracer and 2 hours after either vehicle (white bars, n = 4 mice per group) or 30 mg/kg LYC-31138 (black bars, n = 4 mice per group) was administered. Allo, allogeneic.
Discussion
A large body of work using in vitro models forms much of our understanding to explain how activated T cells meet their energy and carbon substrate demands (MacIver et al., 2013). Early studies using lectins to activate thymocytes and T cells in culture showed that activation stimulated glycolysis and glutamine oxidation (Newsholme et al., 1985b). More recently, the signaling events after costimulation of T-cell and CD28 receptors in vitro have been elucidated. These studies show that costimulation activates phosphatidylinositol 3′-kinase and, in turn, Akt, generating a Warburg phenotype characterized by large increases in glucose transporter expression, glucose uptake, and conversion of glucose to lactate (Frauwirth et al., 2002; Wieman et al., 2007). A systems biology approach applied to T cells activated in vitro also found increased glycolysis and glutamine consumption along with downregulation of fatty acid and TCA oxidative functions (Wang et al., 2011).
Our results from experiments in which T cells are activated in vitro in response to alloantigens are consistent with the Warburg phenotype. The high levels of glucose transporter expression and increased lactate production observed are nearly identical to the response to CD3/CD28 receptor costimulation. In contrast, there is a much smaller increase in glucose transporter expression by T cells activated by alloantigens in vivo, and lactate production by these cells is <20% that of in vitro–activated T cells. Despite the low rate of lactate production after in vivo alloactivation, it is still 5 times higher than naive T cells, demonstrating the capacity of these cells to upregulate metabolic channeling of pyruvate to lactate synthesis. Because glucose transporter expression, a surrogate marker of glucose uptake, increases <50% in CD8+ cells with no change in CD4+ T cells, we conclude that the absence of a Warburg phenotype in GVHD T cells results from restricted glucose uptake or rate-limiting steps in glycolysis rather than enzymes that balance lactate production versus other metabolic fates for glycolytic intermediates (e.g., pyruvate kinase, lactate dehydrogenase, and pyruvate dehydrogenase kinase). To our knowledge, these experiments represent the first direct in vitro/in vivo comparison of T-cell activation using the same stimulus. Although in vitro/in vivo differences are established in other systems (e.g., some neoplasms), these findings are the first to demonstrate that in vitro T-cell activation does not reproduce critical factors present in vivo that modulate T-cell metabolism.
In studies designed to examine the role of metabolism in T-cell proliferation and growth in vivo, Wang and colleagues (2011) gave mice staphylococcal enterotoxin B and studied its effects on activated CD4+ Vβ8 T cells. After 2 days, glycolysis rose 10-fold compared with naive cells. Coadministering staphylococcal enterotoxin B with either 2-deoxyglucose to block glycolysis or 6-diazo-5-oxo-l-norleucine to inhibit glutaminase and canonical glutaminolysis reduced T-cell proliferation, confirming the functional importance of both pathways. Because lactate production as we measured in alloreactive T cells is not equivalent to glycolytic flux measured in CD4+ Vβ8 T cells, the data do not allow direct comparison of glucose metabolism between models. Nevertheless, findings in both model systems support a critical role for glutamine in T-cell activation in vivo.
In other studies, van der Windt et al. (2012) infected mice transgenic for an MHC class I restricted T-cell receptor specific for ovalabumin peptide (OVA) with listeria monocytogenes engineered to express OVA, which selectively activates CD8+ cells. Lactate production by CD8+ T cells isolated 6–7 days after infection was estimated based on rates of extracellular acidification and increased by only ∼50% above naive cells. Similar to GVHD T cells, mitochondrial oxidative function and fatty acid oxidation increase in OVA-activated CD8+ T cells, although this shift in metabolism develops 14–40 days after infection compared with ≤3 days after allotransplant. Collectively, these studies provide evidence that the glycolytic response during T-cell activation in vivo is not constant and, at a minimum, may vary according to type of stimulus and environment.
A central conclusion from Pearce et al. (2009) and van der Windt et al. (2012) is that the delayed increase in fatty acid oxidation is necessary for the development of long-lived CD8+ memory T cells, although it is not important for the effector phase of the T-cell response. This conclusion is supported by recent data in a separate mouse model demonstrating that the antitumor capacity of T cells in vivo depends on oxidative metabolism enhancing CD8+ T-cell memory (Sukumar et al., 2013). On the basis of this work, a model was proposed in which the levels of glycolysis versus oxidative metabolism function as a metabolic rheostat determining the decision between memory and effector differentiation in CD8+ T cells.
The observation that both alloreactive T cells in GVHD and memory T cells in other models use oxidative metabolism raises the possibility that CD8+ memory cells in the population of alloreactive donor T cells account for the metabolic characteristics of T cells in GVHD. This possibility is unlikely for two reasons. First, it is well established that memory T cells are unable to induce GVHD (Chen et al., 2004, 2007). Second, in our experiments, T cells are isolated and characterized 7–8 days after transplant, which corresponds to the time post-transplant at which the donor T cell population in spleen reaches maximal size and the pool of memory cells has not yet been generated (Hakim and Shearer, 1990). Moreover, donor T cells isolated at earlier time points after transplant also have low levels of GLUT1 expression and lactate production (see Fig. 1 and Supplemental Table 1) and rely on oxidative metabolism (Gatza et al., 2011). Thus, the effector phase of the T-cell response in GVHD is associated with oxidative metabolism.
How T cells activated by alloantigen in vivo adapt their metabolism is of interest, because their phenotype challenges the existing paradigm established by in vitro studies. T cells activated in vitro by a mixed lymphocyte reaction respond to the same alloantigen mismatch that activates T cells in vivo, yet develop a highly glycolytic phenotype. Therefore, the nature of the activating stimulus (MHC mismatch) does not entirely account for the metabolic response, suggesting that factors in the in vivo milieu (e.g., nutrients, O2 levels, cytokines, signaling through costimulatory receptors) controls the metabolic phenotype (Birsoy et al., 2014). For example, signaling through the immune-inhibitory coreceptor programmed cell death protein 1 (PD-1) shifts T-cell metabolism away from glucose by limiting GLUT1 expression and glycolysis through inhibition of AKT and toward lipid oxidation by increasing expression of carnitine palmitoyltransferase I (Chatterjee et al., 2013). In fact, PD-1 was recently found to control disease activity and redox balance in murine GVHD (V. Tkachev et al., submitted manuscript).
On the basis of our findings, we present a model describing the metabolism of GVHD T cells in vivo (Fig. 6). Consistent with a reciprocal relationship between glucose and fatty acid metabolism as outlined by Randle (1998), we propose that fatty acid oxidation inhibits glucose metabolism in alloreactive T cells. High levels of fatty acid oxidation, possibly a result of PD-1 signaling, increases [NADH]/[NAD+], [ATP]/[AMP], mitochondrial [acetyl-CoA]/[CoA], and [citrate]. NADH and ATP both inhibit isocitrate dehydrogenase, which limits TCA cycling, increasing both export of citrate to the cytosol and anaplerosis (fueled by glutamine) to resupply oxaloacetate so that acetyl-CoA can continue to be consumed by citrate synthase. Increased [ATP], [acetyl-CoA], and [citrate] inhibit glucose utilization, glycolysis, and pyruvate dehydrogenase and activate gluconeogenesis (Uyeda, 1979; Randle, 1998). Low [AMP] relieves tonic inhibition of fructose-1,6-bisphosphatase increasing gluconeogenesis (Van Schaftingen and Hers, 1981). Although inhibition of glucose utilization by fatty acids has been observed in skeletal muscle, heart, liver, and adipocytes, our data are the first to implicate importance of this process in lymphoid cells (Randle et al., 1963; Berry et al., 1993; Randle, 1998).
Fig. 6.
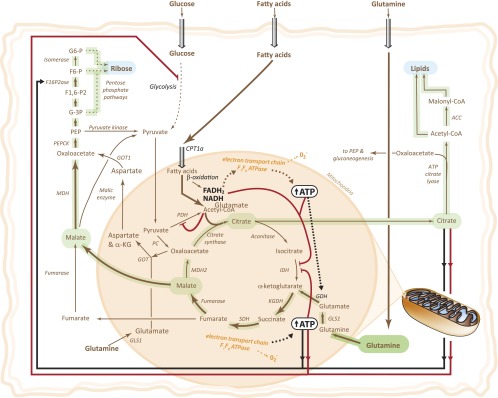
Metabolism in GVHD T cells. Metabolic pathways are shown in brown with relative activity indicated by the weight of the line. Positive regulation is shown by black lines and negative regulation by red lines. Dashed lines indicate multistep processes. Green overlay highlights anaplerotic and anabolic pathways branching from TCA reactions. ACC, acetyl-CoA carboxylase; α-KG, α-ketoglutarate; CPT, carnitine palmitoyltransferase; F1,6-P2, fructose-1,6-biphosphate; F6-P, fructose-6-phosphate; GDH, glutamate dehydrogenase; GLS, glutaminase; GOT, glutamate oxaloacetate transaminase; G-3P, glyceraldehyde-3-phosphate; G6-P, glucose-6-phosphate; KGDH, ketoglutarate dehydrogenase; MDH, malate dehydrogenase; PC, pyruvate carboxylase; PDH, pyruvate dehydrogenase; PEP, phosphoenolpyruvate; PEPCK, phosphoenolpyruvate carboxy kinase; SDH, succinate dehydrogenase.
The finding that glutamine-derived carbons are deposited in RNA-ribose suggests that gluconeogenesis is active in GVHD T cells. Gluconeogenesis is only known to occur in the liver, kidney, possibly the intestine, and in tumors derived from these tissues (Chakravarty et al., 2005). We are aware of no other reports that gluconeogenesis occurs in lymphocytes. The possibility that expression of gluconeogenic enzymes is not restricted from T cells is supported by expressed sequence tag analysis of curated data sets in the Gene Expression Omnibus (maintained by the National Center for Biotechnology: www.ncbi.nlm.nih.gov/geo/) that shows RNA encoding aldolase B, an enzyme required for gluconeogenesis, is present at similar levels in the spleen as in the kidney. Although our current data show that glutamine-derived carbons label RNA ribose in GVHD T cells, the pathway responsible remains to be defined.
The observation that alloreactive T cells rapidly reduce anaplerosis in response to LYC-31138 is consistent with 1) the direct control that [ATP] has on metabolic enzymes and 2) our findings that oxidative ATP production regulates the metabolism of activated, effector T cells (Supplemental Fig. 4). F1F0-ATPase modulators like Bz-423 and LYC-31138 are selective for pathogenic lymphocytes in several murine models of immune disease and do not alter normal immune function (Blatt et al., 2002; Bednarski et al., 2003; Gatza et al., 2011). Although physiologic T-cell activation in vivo increases oxidative metabolism as memory cells emerge, factors must exist that make them resistant to F1F0-ATPase modulation (Pearce et al., 2009; van der Windt et al., 2012). Lymphocyte metabolism is now of considerable interest from both basic and translational perspectives (Pearce et al., 2013). Our data underscore the importance environmental factors/context have in regulating metabolism and, unlike predictions based on existing models, point toward the TCA cycle and anaplerosis as therapeutic targets for immune-mediated disorders.
Supplementary Material
Acknowledgments
The authors thank Luigi Franchi and Laura Carter for reviewing the manuscript.
Abbreviations
- BMT
bone marrow transplantation
- Bz-423
7-chloro-5-(4-hydroxyphenyl)-1-methyl-3-(naphthalen-2-ylmethyl)-1,3-dihydro-2H-benzo[e][1,4]diazepin-2-one
- CFSE
carboxyfluorescein diacetate succinimidyl ester
- GLUT1
glucose transporter 1
- GVHD
graft-versus-host disease
- IDH
isocitrate dehydrogenase
- LYC-31138
(Z)-N-((tert-butylamino)((5-(4-fluorophenyl)-1H-pyrazol-3-yl)amino)methylene)-4-(trifluoromethyl)benzamide
- MHC
major histocompatibility
- MS
mass spectrometry
- OVA
ovalabumin peptide
- PD-1
programmed cell death protein 1
- TCA
tricarboxylic acid
Authorship Contributions
Participated in research design: Glick, Wahl, Ferrara, Tkachev, Byersdorfer, Boros, Opipari.
Conducted experiments: Wahl, Lesch, Sanchez, Liu, Hao, Tkachev, Byersdorfer, Boros, Opipari.
Contributed new reagents or analytic tools: Taylor, Hurd, Boros.
Performed data analysis: Glick, Rossignol, Lyssiotis, Wahl, Tkachev, Ferrara, Byersdorfer, Boros.
Wrote or contributed to the writing of the manuscript: Glick, Rossignol, Lyssiotis, Wahl, Ferrara, Byersdorfer, Boros, Opipari.
Footnotes
This work was supported by Lycera Corporation; the National Institutes of Health National Cancer Institute [Grant P01-CA39542]; the National Institutes of Health National Institute of Allergy and Infectious Diseases [Grant R01-AI047450]; and the Damon Runyon Cancer Research Foundation.
 This article has supplemental material available at jpet.aspetjournals.org.
References
- Bauer DE, Hatzivassiliou G, Zhao F, Andreadis C, Thompson CB. (2005) ATP citrate lyase is an important component of cell growth and transformation. Oncogene 24:6314–6322 [DOI] [PubMed] [Google Scholar]
- Bednarski JJ, Warner RE, Rao T, Leonetti F, Yung R, Richardson BC, Johnson KJ, Ellman JA, Opipari AW, Jr, Glick GD. (2003) Attenuation of autoimmune disease in Fas-deficient mice by treatment with a cytotoxic benzodiazepine. Arthritis Rheum 48:757–766 [DOI] [PubMed] [Google Scholar]
- Berg JM, Tymoczko JL, Stryer L. (2012) Biochemistry, W.H. Freeman, New York [Google Scholar]
- Berry MN, Phillips JW, Henly DC, Clark DG. (1993) Effects of fatty acid oxidation on glucose utilization by isolated hepatocytes. FEBS Lett 319:26–30 [DOI] [PubMed] [Google Scholar]
- Birsoy K, Possemato R, Lorbeer FK, Bayraktar EC, Thiru P, Yucel B, Wang T, Chen WW, Clish CB, Sabatini DM. (2014) Metabolic determinants of cancer cell sensitivity to glucose limitation and biguanides. Nature 508:108–112 [DOI] [PMC free article] [PubMed] [Google Scholar]
- Blatt NB, Bednarski JJ, Warner RE, Leonetti F, Johnson KM, Boitano A, Yung R, Richardson BC, Johnson KJ, Ellman JA, et al. (2002) Benzodiazepine-induced superoxide signals B cell apoptosis: mechanistic insight and potential therapeutic utility. J Clin Invest 110:1123–1132 [DOI] [PMC free article] [PubMed] [Google Scholar]
- Boros LG, Steinkamp MP, Fleming JC, Lee WN, Cascante M, Neufeld EJ. (2003) Defective RNA ribose synthesis in fibroblasts from patients with thiamine-responsive megaloblastic anemia (TRMA). Blood 102:3556–3561 [DOI] [PubMed] [Google Scholar]
- Byersdorfer CA, Tkachev V, Opipari AW, Goodell S, Swanson J, Sandquist S, Glick GD, Ferrara JL. (2013) Effector T cells require fatty acid metabolism during murine graft-versus-host disease. Blood 122:3230–3237 [DOI] [PMC free article] [PubMed] [Google Scholar]
- Cantor JR, Sabatini DM. (2012) Cancer cell metabolism: one hallmark, many faces. Cancer Discov 2:881–898 [DOI] [PMC free article] [PubMed] [Google Scholar]
- Chakravarty K, Cassuto H, Reshef L, Hanson RW. (2005) Factors that control the tissue-specific transcription of the gene for phosphoenolpyruvate carboxykinase-C. Crit Rev Biochem Mol Biol 40:129–154 [DOI] [PubMed] [Google Scholar]
- Chatterjee P, Sari D, Petkova V, Li L, Boussiotis VA. (2013) PD-1 induces metabolic reprogramming of activated T cells from glycolysis to lipid oxidation. Blood 122:187–187 [Google Scholar]
- Chen BJ, Cui X, Sempowski GD, Liu C, Chao NJ. (2004) Transfer of allogeneic CD62L-memory T cells without graft-versus-host disease. Blood 103:1534–1541 [DOI] [PubMed] [Google Scholar]
- Chen BJ, Deoliveira D, Cui X, Le NT, Son J, Whitesides JF, Chao NJ. (2007) Inability of memory T cells to induce graft-versus-host disease is a result of an abortive alloresponse. Blood 109:3115–3123 [DOI] [PMC free article] [PubMed] [Google Scholar]
- Frauwirth KA, Riley JL, Harris MH, Parry RV, Rathmell JC, Plas DR, Elstrom RL, June CH, Thompson CB. (2002) The CD28 signaling pathway regulates glucose metabolism. Immunity 16:769–777 [DOI] [PubMed] [Google Scholar]
- Gatza E, Wahl DR, Opipari AW, Sundberg TB, Reddy P, Liu C, Glick GD, Ferrara JL. (2011) Manipulating the bioenergetics of alloreactive T cells causes their selective apoptosis and arrests graft-versus-host disease. Sci Transl Med 3:ra8. [DOI] [PMC free article] [PubMed] [Google Scholar]
- Glick GD, Hurd AR, Taylor CB, and Vanhuis CA (2012) inventors, Lycera Corporation, assignee. Pyrazolyl Guanidine F1F0-ATPase Inhibitors and Therapeutic Uses Thereof. Patent Cooperation Treaty, World Intellectual Property Organization, International Publication Number WO 2012/078874 A1. 2013 Oct 19.
- Hakim F, Shearer G. (1990) Immunologic and hematopoietic deficiencies of graft-vs.-host disease, in Graft-vs.-Host Disease: Immunology, Pathophysiology and Treatment (Burakoff S, Deeg H, Ferrara J, Atkinson K. eds) pp 133–160, Marcel Dekker Inc., New York [Google Scholar]
- Hill GR, Crawford JM, Cooke KR, Brinson YS, Pan L, Ferrara JL. (1997) Total body irradiation and acute graft-versus-host disease: the role of gastrointestinal damage and inflammatory cytokines. Blood 90:3204–3213 [PubMed] [Google Scholar]
- Johnson KM, Chen X, Boitano A, Swenson L, Opipari AW, Jr, Glick GD. (2005) Identification and validation of the mitochondrial F1F0-ATPase as the molecular target of the immunomodulatory benzodiazepine Bz-423. Chem Biol 12:485–496 [DOI] [PubMed] [Google Scholar]
- Johnson KM, Cleary J, Fierke CA, Opipari AW, Jr, Glick GD. (2006) Mechanistic basis for therapeutic targeting of the mitochondrial F1F0-ATPase. ACS Chem Biol 1:304–308 [DOI] [PubMed] [Google Scholar]
- MacIver NJ, Michalek RD, Rathmell JC. (2013) Metabolic regulation of T lymphocytes. Annu Rev Immunol 31:259–283 [DOI] [PMC free article] [PubMed] [Google Scholar]
- Metallo CM, Gameiro PA, Bell EL, Mattaini KR, Yang J, Hiller K, Jewell CM, Johnson ZR, Irvine DJ, Guarente L, et al. (2012) Reductive glutamine metabolism by IDH1 mediates lipogenesis under hypoxia. Nature 481:380–384 [DOI] [PMC free article] [PubMed] [Google Scholar]
- Mullen AR, Wheaton WW, Jin ES, Chen PH, Sullivan LB, Cheng T, Yang Y, Linehan WM, Chandel NS, DeBerardinis RJ. (2012) Reductive carboxylation supports growth in tumour cells with defective mitochondria. Nature 481:385–388 [DOI] [PMC free article] [PubMed] [Google Scholar]
- Newsholme EA, Crabtree B, Ardawi MS. (1985a) Glutamine metabolism in lymphocytes: its biochemical, physiological and clinical importance. Q J Exp Physiol 70:473–489 [DOI] [PubMed] [Google Scholar]
- Newsholme EA, Crabtree B, Ardawi MS. (1985b) The role of high rates of glycolysis and glutamine utilization in rapidly dividing cells. Biosci Rep 5:393–400 [DOI] [PubMed] [Google Scholar]
- Newsholme EA, Gevers W. (1967) Control of glycolysis and gluconeogenesis in liver and kidney cortex. Vitam Horm 25:1–87 [DOI] [PubMed] [Google Scholar]
- Owen OE, Kalhan SC, Hanson RW. (2002) The key role of anaplerosis and cataplerosis for citric acid cycle function. J Biol Chem 277:30409–30412 [DOI] [PubMed] [Google Scholar]
- Palsson-McDermott EM, O’Neill LA. (2013) The Warburg effect then and now: from cancer to inflammatory diseases. BioEssays 35:965–973 [DOI] [PubMed] [Google Scholar]
- Pearce EL, Poffenberger MC, Chang CH, Jones RG. (2013) Fueling immunity: insights into metabolism and lymphocyte function. Science 342:1242454. [DOI] [PMC free article] [PubMed] [Google Scholar]
- Pearce EL, Walsh MC, Cejas PJ, Harms GM, Shen H, Wang LS, Jones RG, Choi Y. (2009) Enhancing CD8 T-cell memory by modulating fatty acid metabolism. Nature 460:103–107 [DOI] [PMC free article] [PubMed] [Google Scholar]
- Randle PJ. (1998) Regulatory interactions between lipids and carbohydrates: the glucose fatty acid cycle after 35 years. Diabetes Metab Rev 14:263–283 [DOI] [PubMed] [Google Scholar]
- Randle PJ, Garland PB, Hales CN, Newsholme EA. (1963) The glucose fatty-acid cycle. Its role in insulin sensitivity and the metabolic disturbances of diabetes mellitus. Lancet 1:785–789 [DOI] [PubMed] [Google Scholar]
- Saha A, Aoyama K, Taylor PA, Koehn BH, Veenstra RG, Panoskaltsis-Mortari A, Munn DH, Murphy WJ, Azuma M, Yagita H, et al. (2013) Host programmed death ligand 1 is dominant over programmed death ligand 2 expression in regulating graft-versus-host disease lethality. Blood 122:3062–3073 [DOI] [PMC free article] [PubMed] [Google Scholar]
- Spencer A, Corman L, Lowenstein JM. (1964) Citrate and the conversion of carbohydrate into fat. A comparison of citrate and acetate incorporation into fatty acids. Biochem J 93:378–388 [DOI] [PMC free article] [PubMed] [Google Scholar]
- Sukumar M, Liu J, Ji Y, Subramanian M, Crompton JG, Yu Z, Roychoudhuri R, Palmer DC, Muranski P, Karoly ED, et al. (2013) Inhibiting glycolytic metabolism enhances CD8+ T cell memory and antitumor function. J Clin Invest 123:4479–4488 [DOI] [PMC free article] [PubMed] [Google Scholar]
- Uyeda K. (1979) Phosphofructokinase. Adv Enzymol Relat Areas Mol Biol 48:193–244 [DOI] [PubMed] [Google Scholar]
- Vander Heiden MG, Lunt SY, Dayton TL, Fiske BP, Israelsen WJ, Mattaini KR, Vokes NI, Stephanopoulos G, Cantley LC, Metallo CM, et al. (2011) Metabolic pathway alterations that support cell proliferation. Cold Spring Harb Symp Quant Biol 76:325–334 [DOI] [PubMed] [Google Scholar]
- van der Windt GJ, Everts B, Chang CH, Curtis JD, Freitas TC, Amiel E, Pearce EJ, Pearce EL. (2012) Mitochondrial respiratory capacity is a critical regulator of CD8+ T cell memory development. Immunity 36:68–78 [DOI] [PMC free article] [PubMed] [Google Scholar]
- Van Schaftingen E, Hers HG. (1981) Inhibition of fructose-1,6-bisphosphatase by fructose 2,6-biphosphate. Proc Natl Acad Sci USA 78:2861–2863 [DOI] [PMC free article] [PubMed] [Google Scholar]
- Wahl DR, Byersdorfer CA, Ferrara JL, Opipari AW, Jr, Glick GD. (2012) Distinct metabolic programs in activated T cells: opportunities for selective immunomodulation. Immunol Rev 249:104–115 [DOI] [PMC free article] [PubMed] [Google Scholar]
- Wang R, Dillon CP, Shi LZ, Milasta S, Carter R, Finkelstein D, McCormick LL, Fitzgerald P, Chi H, Munger J, et al. (2011) The transcription factor Myc controls metabolic reprogramming upon T lymphocyte activation. Immunity 35:871–882 [DOI] [PMC free article] [PubMed] [Google Scholar]
- Wieman HL, Wofford JA, Rathmell JC. (2007) Cytokine stimulation promotes glucose uptake via phosphatidylinositol-3 kinase/Akt regulation of Glut1 activity and trafficking. Mol Biol Cell 18:1437–1446 [DOI] [PMC free article] [PubMed] [Google Scholar]
- Wise DR, DeBerardinis RJ, Mancuso A, Sayed N, Zhang XY, Pfeiffer HK, Nissim I, Daikhin E, Yudkoff M, McMahon SB, et al. (2008) Myc regulates a transcriptional program that stimulates mitochondrial glutaminolysis and leads to glutamine addiction. Proc Natl Acad Sci USA 105:18782–18787 [DOI] [PMC free article] [PubMed] [Google Scholar]
- Wise DR, Ward PS, Shay JE, Cross JR, Gruber JJ, Sachdeva UM, Platt JM, DeMatteo RG, Simon MC, Thompson CB. (2011) Hypoxia promotes isocitrate dehydrogenase-dependent carboxylation of α-ketoglutarate to citrate to support cell growth and viability. Proc Natl Acad Sci USA 108:19611–19616 [DOI] [PMC free article] [PubMed] [Google Scholar]
- Yoo H, Antoniewicz MR, Stephanopoulos G, Kelleher JK. (2008) Quantifying reductive carboxylation flux of glutamine to lipid in a brown adipocyte cell line. J Biol Chem 283:20621–20627 [DOI] [PMC free article] [PubMed] [Google Scholar]
Associated Data
This section collects any data citations, data availability statements, or supplementary materials included in this article.