

Abstract
Gender is increasingly recognized as fundamental to understanding migration processes, causes and consequences. In South Africa, it is intrinsic to the social transformations fueling high levels of internal migration and complex forms of mobility. While female migration in Africa has often been characterized as less prevalent than male migration, and primarily related to marriage, in South Africa a feminization of internal migration is underway, fueled by women’s increasing labor market participation. In this paper, we report sex differences in patterns, trends and determinants of internal migration based on data collected in a demographic surveillance system between 2001 and 2006 in rural KwaZulu-Natal. We show that women were somewhat more likely than men to undertake any migration, but sex differences in migration trends differed by migration flow, with women more likely to migrate into the area than men, and men more likely to out-migrate. Out-migration was suppressed by marriage particularly for women, but most women were not married; both men’s and women’s out-migrations were undertaken mainly for purposes of employment. Over half of female out-migrations (versus 35% of male out-migrations) were to nearby rural areas. The findings highlight the high mobility of this population and the extent to which gender is intimately related to the processes determining migration. We consider the implications of these findings for the measurement of migration and mobility, in particular for health and social policy and research among highly mobile populations in southern Africa.
Keywords: Gender, migration, mobility, South Africa
INTRODUCTION
Gender is increasingly recognized as fundamental to understanding migration processes, causes and consequences. The first critical analyses of migration research through the lens of gender emerged some three decades ago, directing attention to the male gender bias embedded in migration studies (Bilsborrow 1992; Chant and Radcliffe 1992; Hugo 1993; Pedraza 1991; Tienda and Booth 1991). Women’s mobility in sub-Saharan Africa has continued to receive little attention in migration studies, in part due to an enduring paucity of national-level data for the study of sex-specific migration patterns in the region. However, a small number of recent studies using sex-specific data on migration (Beauchemin and Bocquier 2004; Beguy, Bocquier and Zulu 2010; Collinson et al. 2006; Collinson 2009; Reed, Andrzejewski and White 2010) have yielded growing evidence for a feminization of migration in sub-Saharan Africa, as in other developing regions (Bilsborrow 1992; Hugo 1993; Zlotnick 2003). In South Africa, the available data suggest that a feminization of internal labor migration has been underway for at least three decades (Casale and Posel 2002; Feinstein 2005; Posel 2006). In the 1990s, some 16% of the rural South African population migrated annually to urban areas (Anderson 2006) to seek opportunities and provide financial support to households of origin (Collinson et al. 2006; Collinson et al. 2009; Posel and Casale 2003; van der Berg et al. 2002). 2001–02 census data showed that 42% of citizens of African origin had ever moved from one district to another, and that 51% of these migrants were female (Wentzel, Viljoen and Kok 2006). A number of studies using data from rural demographic surveillance sites (DSS) have documented an increasing trend of migration to other rural villages, semi-urban towns, and the rural perimeters of metropolitan areas. A higher proportion of female than male migrants travel to these areas, which are closer to rural and peri-urban homes in the Agincourt DSS population in Mpumalanga Province (Collinson et al. 2006; Collinson, Tollman and Kahn 2007) and the DSS population for the present study in KwaZulu-Natal (KZN) (Lurie et al. 1997; Muhwava et al. 2010)1. In Agincourt, rural-to-rural and rural-to-town migration flows have become more prominent (Collinson et al. 2006)2 than migrations to the Johannesburg/Gauteng area. Female migration increased three-fold between 1997 and 2001 (Collinson et al. 2006) and continued to increase from 1999 to 2003 (Collinson 2007), with women aged 15 to 25 the most mobile population category. For the KZN population (this study), previous analyses also highlighted women’s predominance in localized, shorter-distance migration flows (Muhwava et al. 2010).
Complex, novel migration and mobility patterns are emerging in South Africa, concurrent with rapid social transformations in gender underway in the nation. These patterns warrant closer attention to women’s migration and its causes and consequences. In this paper, we present findings of study on sex differences in the trends, patterns and determinants of migration in a population living in a primarily rural area of KZN from 2001 to 2007. We use uniquely detailed data, and a range of measures in order to examine the degree to which they adequately encompass both men’s and women’s participation in migration. Finally, we investigate possible sex differences in the determinants of migration, and consider their implications for current and future studies of gender and migration in southern Africa.
BACKGROUND
Historical context
The gendered patterns of migration in today’s South Africa are rooted in its unique history as an extreme example of modern overseas settlement colonization (Osterhammel 1997). From the seventeenth century through the end of apartheid in the early 1990s, South Africa’s governmental policies sought to extract the cheap labor of blacks in order to support the privileged position of whites (Feinstein 2005). Male temporary labor migration was a cornerstone of South Africa’s segregationist economy. ‘Influx Control’ legislation, i.e. urban residency and land ownership restrictions on the black population, and apartheid policies governing the residence and movement of black South Africans, sought, among other things, to prevent women from migrating from rural areas (Preston-Whyte 1978). Yet despite the state’s best efforts, the male migrant labor system did not produce a stable population of women ‘left behind’ to maintain rural homesteads. Quite to the contrary, women have migrated independently to and within South Africa at least since the late 19th and early 20th centuries, when many moved to the Witwatersrand to pursue economic opportunities in the gold boom economy (Bonner 1990; van Onselen 1982). They came from rural areas of South Africa and from Swaziland and Bechuanaland (Botswana) (Cockerton 1995; Dodson and Crush 2004) to participate in the domestic labor and informal sectors, which evolved in tandem with the male migrant labor system (Walker 1990). The apartheid regime’s influx control laws specifically excluded women as labor immigrants to South Africa (Wilkinson 1983), but the internal migration of women in southern African ‘sending’ nations of Lesotho, Swaziland, Mozambique and Botswana increased over the 1970s: while the burden of agricultural production, falling exclusively upon women, became heavier, arable land became scarcer in sending areas, exacerbated by new systems of land tenure (Spiegel 1981; Wilkinson 1983). A similar phenomenon occurred in South Africa’s internal migrant sending areas, leading to dramatic sex imbalances in the towns of the former “homelands” (Preston-Whyte and Sibisi 1975).
Since at least the 1970s, the destinations of female migrants appear to have not been the distant large cities to which men migrated, but rather the small regional towns, peri-urban or semi-rural employment zones, or the informal peripheries of cities, all of which are closer to the rural homesteads to which women remain tied. In her history of a town in North West Province, Bozzoli (1990) noted, “Migration [of women] did not involve spending the long lonely periods away from home which the more distant migrant would experience. The surrounding towns and cities were relatively well known and understood, in ways that reflected the mental maps Bafokeng women held of their own rural universe” (p. 95). Indeed, despite their weak or declining economic bases, informal settlement areas and peripheral, regional towns in South Africa have continued to be focal points for female migrants. A case study of migration in and out of a township area in northern KZN (Todes 1998) documented changes in community members’ attitudes towards female migration as economic conditions worsened over the 1990s: confronting “older prejudices”, “families on the whole did not seem to prevent daughters from moving, and in fact were frequently supportive of their daughters” (Ibid., p.325).
The post-apartheid era
The political, economic and social changes of the past two decades have significantly altered the context, drivers and legislative controls of migration in South Africa. In 1986, apartheid influx control measures were formally abolished, “after a period in which it had broken down as people defied laws and streamed to the cities” (Todes 1998), p. 311). An assumption had been that “artificial” towns and peripheral industrial areas, created by apartheid through forced removals and influx controls, would “wither away” after apartheid as people continued to migrate to urban areas (Ibid., (Casale and Posel 2002). However, net rural-to-urban migration rates are estimated to have increased from 2% in 1980–84 to 15.4% in 1995–99 per 1,000 population in South Africa (Anderson 2006), with the caveat that the designation of ‘urban’ is difficult and controversial in the southern African context (Anderson 2006; Billsborrow 1998; Collinson 2007). No longer subject to brutal spatial interventions by the apartheid state, informal settlement areas3 have dramatically grown in size in South Africa over the past two to three decades, in a process of “displaced urbanization” (Anderson 2006).
Concurrent with these changes, the HIV/AIDS epidemic rapidly spread between urban areas, and from urban to rural areas in southern Africa, via the corridors of major population movement. The contributing role of South Africa’s migrant labor system to the nation’s enormous epidemic is well-documented (Abdool Karim et al. 1992; Campbell 2000, 2001; Hope 2000; Jochelson, Mothibeli and Leger 1991; Williams and Campbell 1996). Perhaps as a result, the literature on migration and HIV has largely focused on risk to male labor migrants and their non-migrant female partners, or migrants overall (Bwayo et al. 1994; Hope 2000; Jochelson et al. 1991; Lurie et al. 2003; Nunn et al. 1995). Those measuring HIV risks to women via their direct involvement in migration, however, have documented high acquisition and transmission risks among female migrants (Abdool Karim et al. 1992; Boerma et al. 2002; Camlin et al. 2010; Kishamawe et al. 2006; Lydie et al. 2004; Pison et al. 1993; Zuma et al. 2003). Previous research in the population for this study found higher HIV prevalence among recent female migrants than among male migrants or non-migrants of either sex. Women’s internal migration may be an under-recognized social antecedent to the HIV epidemic in South Africa (Camlin et al. 2010).
Causes of the feminization of migration in South Africa
The factors driving a feminization of internal migration in South Africa are thus multi-faceted, with unique historical antecedents, but are also well-explained by the new economics of labor migration (Massey 2006; Massey et al. 1998; Stark 1991): where urban labor markets are volatile and insecure, a geographically stretched household-one in which members live and work in multiple places-also diversifies its risks. In South Africa, this process of risk diversification has been highly gendered, and the large social transfers enacted after the democratic elections of 1994 may have facilitated women’s labor migration. The research on pensions and remittances suggests that the presence of older women in rural households, and absence of older men and husbands, has facilitated the migration of working-age women. Prior research in this population found that an ‘old age pension’-eligible woman provided not only access to pension income (Ardington, Case and Hosegood 2009; Ardington and Lund 1995), but also the child care that permitted reproductive-age women to migrate for work (Ardington et al. 2009; Hunter 2004). This finding is supported by other research from South Africa showing that a greater percentage of female labor migrants came from households with at least one woman of pension-eligible age (41% compared to 25% in households without a female pensioner) (Posel 2001). In the first decade of the 21st century in South Africa, the sending of a female migrant has become an essential livelihood strategy particularly advantageous to the poorest households (Collinson et al. 2009; Kok et al. 2006).
Transformations in gender norms in South Africa are also underway, relaxing ‘traditional’ gender-related constraints to female labor force participation and migration. Early anthropological research in the region (e.g. (Meillassoux 1960) documented the power that chiefs, fathers and husbands held with respect to restricting women’s mobility and reinforcing their roles in rural production. Women’s roles in child-care and farming reduced the likelihood of migration, as did marriage. Gendered divisions of labor were upheld by social pressure, gender ideology and women’s economic dependence in rural communities (Posel and Casale 2003). In South Africa and surrounding nations, male migrant labor systems are thought to have contributed to turbulent gender relations and disruptions of ‘traditional’ norms (Breckenridge 1998; Campbell 2001; Hunter 2007; Lovett 1996; Smith 2007; Spiegel 1991) and to the destabilization of family structures and marriage systems (Lovett 1996; Murray 1976, 1980; Wilkinson 1983). Indeed, Africa’s marriage rates are uniquely low in the region and probably declining4, and the structure and composition of households are changing. Reliable nationally-representative estimates of nuptiality were lacking until recently, but the Demographic and Health Surveys for South Africa found that only 34% of women of reproductive age were currently married in 1998 (Department of (Health, Council and Macro 1998), declining to28% in 2003 (Department of (Health, Council and Macro 2003). Previous analyses of the population for this study showed that the proportion never married increased continuously from 2000 to 2006, when 69 percent of women had never been married (Hosegood et al. 2008). At the same time, women are participating in the labor force in greater numbers than ever before: while the male labor force participation rate dropped from 97% in 1960 to 65% in 1996, the rate for females rose in the same period from 30 to 49% (Feinstein 2005).
There are few data sources for the study of sex-specific migration patterns and determinants in South Africa, and women’s unique patterns and motivations for migration are not well described in the demographic literature. This study exploits a rich data source to address this gap. We present a case study of sex differences in trends, patterns and determinants of migration in a population living in a primarily rural area of KZN from 2001 to 2007. A key aim of this analysis is to explore how the sex composition of migrants in the population shifted depending upon how migration was defined. We therefore use several measures to describe detailed patterns of migration and mobility in the adult population by sex. We examine sex differences in the individual and household characteristics that shape the likelihood of migration, in the destinations chosen by migrants over the period, and in the reasons given for migration. The data available for these analyses provide a detailed description of the gendered patterns of mobility in rural South Africa, and the factors driving this mobility.
DATA AND METHOD
Data source
Data are from the Africa Centre Demographic Information System (ACDIS) conducted by the Africa Centre for Health and Population Studies. Since 2000 ACDIS has collected demographic, social and behavioral data in a population of over 100,000 individuals in Umkhanyakude District, a predominantly rural area of KZN about two hours north of Durban (Tanser et al. 2008) (see Figure 1.) ACDIS was designed to closely reflect the complexity of the social organization of rural communities of KZN and the high mobility of the population (Hosegood and Timaeus 2005a; Tanser et al. 2008). The surveillance area is 435 km2 and all bounded structures within the area that have either a residential purpose (homesteads) or provide a service (e.g. schools, clinics, churches) are registered and updated routinely. The households that are resident at these structures are registered and followed, as are all members of these households.
Figure 1.
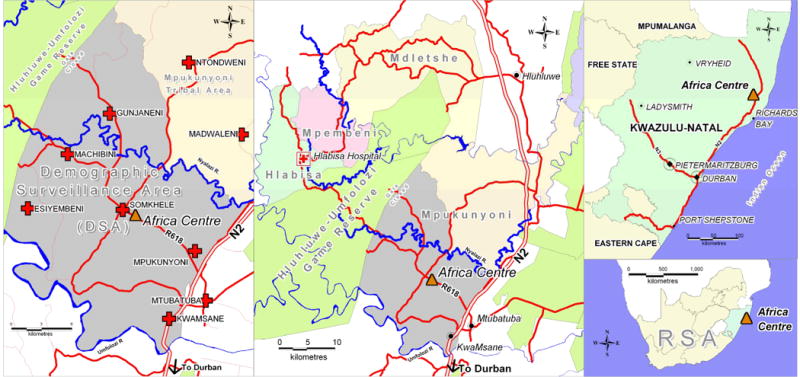
Location of Demographic Surveillance Area, Hlabisa sub-district and surroundings, KwaZulu-Natal, South Africa
Source: Africa Centre for Health and Population Studies. URL: http://www.africacentre.ac.za.
In ACDIS, individuals are included in the surveillance population on the basis of being a member of a household in the study area irrespective of whether the person is a resident or not (Hosegood and Timaeus 2005a; Tanser et al. 2008). The residency status (whether resident or non-resident) and place of residence is routinely recorded for all household members. The place of residence is in most cases the place where a person keeps their daily belongings and spends most nights. Although ACDIS can record an individual as being a member of more than one household at a time,5 for instance in the case of polygamous marriage, an individual can only be recorded as being resident within one bounded structure at any point in time.6 At each fieldworker visit, any change in household residency is recorded, together with information about the origin or destination and date of the move. Changes in residency are referred to as migration events. These are classified as in-migrations (a migration into a homestead within the surveillance area), internal migrations (migrations within the surveillance area) or out-migrations (migration to a homestead outside of the area). A household migration involves a change of residence by all resident members of the household to another homestead; both individual and household migrations are recorded. At each visit to a household, the household roster is reviewed and updated on the basis of any changes due to events including births, deaths and migration. The pattern of household presence (number of nights slept in the household since the previous visit, and whether present on previous night) is also recorded for each household member. This analysis used routinely-collected demographic data, and information from the first round of a Household Socio-Economic Survey (HSE-1), collected in 2001, about the household (household HSE-1 questionnaire) and each member of the household (individual HSE-1 questionnaire).
Setting
The surveillance area encompasses both land under tribal authority (Mpukunyoni) that was designated as a Zulu ‘homeland’ under former apartheid policy, and a township (KwaMsane) under municipal authority (Figure 1). Previous analyses of ACDIS data indicate that there were 85,502 individuals in the population in the mid-year of 2001 (Muhwava et al. 2010). Some 28% were non-resident household members on that date (Ibid.); the proportion of adult female non-residents has been lower than that of males since the start of ACDIS. Infrastructure and living conditions are poor: in 2001, 50% of households had no electricity, and only 13% had access to piped water. There is little subsistence agriculture in the area, and most households rely on pension, child support grants and wage income (Ardington et al. 2009; Case and Ardington 2004; Case, Hosegood and Lund 2005).
Mortality in the study area rose sharply in the late 1990s, largely as a result of HIV: by 2000, the probability of dying between the ages of 15 and 60 was 58% for women and 75% for men; AIDS with and without tuberculosis was the leading cause of death in adulthood (48%) (Hosegood, Vanneste and Timaeus 2004b). In 2006, 27% of female and 13.5% of male residents were HIV-infected (Welz et al. 2007). HIV prevalence was yet higher in non-residents, at 34% among men aged 15–54 and 41% among women aged 15–49 years (Ibid.). HIV incidence was sustained at a high level over the years 2003 through 2007, at an overall rate of 3.4 per 100 person-years (Barnighausen, Tanser and Newell 2009). Overall population mortality and HIV-related adult mortality declined significantly between 2002 and 2006 following the rollout of HIV antiretroviral treatment in the population (Herbst et al. 2009).
Methods
Populations
This analysis begins with a presentation of sex differences in migration patterns and determinants for the first two-year period from the start of ACDIS, 2001 through 2003. An analysis of sex differences in the pattern of presence in the household in the previous four months was carried out on the January 1, 2001 population, and age-specific rates of migration, by type of migration and sex, were also generated for this population. We also examine sex-specific trends in migration from 2001 through 2006, defining the populations for rates (i.e., the denominators) as all individuals aged 15 years and older who were members of households on January 1 of the calendar year. The numerators for rates were defined as the number of individuals who had at least one migration event, by type, within the year.
Analyses of characteristics associated with migration by sex were carried out on the January 1, 2001 population. We focus on individual, rather than household, migrations in 2001 through 2003, which comprised the majority of migration events over the period. We examined sex differences in migration destinations over the years 2001 through 2006, using the migration event as the unit of analysis (as information on destinations was often not available for out-migrants, the full six years of data were used to maximize non-missing responses).
Adjustment for selection bias in HSE-1 data
Of the population of 48,163 adults aged 18 and older, HSE-1 data were available for 41,919 individuals (87%). Other ACDIS data on the characteristics of the 6,244 adults for whom HSE-1 data were not available7 showed that they differed from the population for whom HSE-1 data were available. To adjust for this selection bias, we used a propensity score weighting approach (Little and Rubin 2002), generating a score representing the propensity of ‘participation’ in HSE-1 for all of the members of the population, and using this score to apply a non-response adjustment weight to the analyses.8 The weight was used as a frequency weight for analyses shown in Tables 2 and 3. (Unweighted data are shown in Appendix Tables A.1 and A.2)
Table 2.
Characteristics predictive of subsequent migration in 2001-03, by sex and type of migration (Multiple logistic regression models with robust standard errors and 99% CI)
| Out-migration of residents | In-migration of non-residents | |||
|---|---|---|---|---|
|
| ||||
| Adult females | Adult males | Adult females | Adult males | |
| aOR | aOR | aOR | aOR | |
| INDIVIDUAL CHARACTERISTICS | ||||
| Age group quantile | ||||
| 18-22 (reference) | ||||
| 23-28 | 1.00 | 0.91 | 0.84* | 0.85 |
| 29-37 | 0.63*** | 0.47*** | 0.66*** | 0.63*** |
| 38-50 | 0.30*** | 0.36*** | 0.59*** | 0.47*** |
| Over age 50 | 0.13*** | 0.15*** | 0.64** | 0.69* |
| Partnership pattern | ||||
| No current marital partner (reference) | ||||
| Currently married | 0.42*** | 0.66*** | 1.09 | 1.04 |
| Employment status | ||||
| Unemployed (reference) | ||||
| Full or part-time employment | 0.97 | 0.94 | 0.72*** | 0.54*** |
| Education level | ||||
| None through Standard 5 (reference) | ||||
| Standard 6 through 9 | 1.04 | 1.12 | 0.85 | 0.84* |
| Standard 10 (Matric) or higher | 1.25** | 1.18 | 0.98 | 0.75** |
| Parenthood | ||||
| Not a parent to children in household (reference) | ||||
| Parent to ≥1 children in household | 0.59*** | 0.92 | 1.08 | 1.30** |
| HOUSEHOLD CHARACTERISTICS | ||||
| Household dependency ratio | 0.91* | 0.96 | 1.02 | 1.05 |
| Sum of adults employed full-time | 1.04 | 1.03 | 0.98 | 0.99 |
| Drink water source | ||||
| Other source (reference) | ||||
| Piped (private/public) | 1.04 | 0.93 | 1.07 | 1.04 |
| Sanitation | ||||
| Other or none (reference) | ||||
| Flush toilet/VIP | 1.04 | 0.87 | 1.24 | 1.01 |
| Electricity | ||||
| No source of electricity (reference) | ||||
| Has electricity (grid/ generator) | 0.86* | 0.66*** | 1.01 | 1.21** |
| Quantiles of household assets | ||||
| Lower tertile of assets (0-2) (reference) | ||||
| Middle tertile of assets (3-5) | 0.86 | 1.09 | 1.11 | 0.96 |
| Higher tertile of assets (6-17) | 1.02 | 1.12 | 1.09 | 1.17 |
| Pension-eligible adults in household | ||||
| None (reference) | ||||
| 1 or more males or both sexes | 0.99 | 0.83 | 0.85 | 0.86 |
| 1 or more females only | 0.96 | 0.88 | 0.98 | 1.01 |
| Death of adults in household prior to migration (by type) | ||||
| No death of other adult (reference) | ||||
| Death of ≥1 adults in household before 1st migration | 1.56*** | 0.90 | 1.57*** | 1.71*** |
| N | 14,192 | 9,352 | 8,238 | 9,301 |
| Wald χ2 (19 df) | 945.94 | 589.40 | 125.68 | 263.34 |
Source: ACDIS. Data are for population aged 18 and older who were members of households on 01 January 2001. SE adjusted for clustering at the household level. Data weighted with survey participation propensity score weight. aOR= adjusted odds ratio.
p<.05
p<.01
p<.001
Table 3.
Distribution of individual out-migrations in 2001-06, by sex and destination type
| Destination characteristic | Adult male | Adult female | ||||
|---|---|---|---|---|---|---|
| N | col. % | N | col. % | chi-sq(df) | p | |
| Rural | 3,057 | 35.3 | 4,802 | 50.4 | 423.2 (1) | <.0001 |
| Urban | 5,616 | 64.8 | 4,732 | 49.6 | ||
| Formal | 5,148 | 92.9 | 4,310 | 91.9 | ||
| Informal | 396 | 7.1 | 381 | 8.1 | 3.4 (1) | 0.062 |
| Mpukunyoni Tribal Area or Hlabisa District | 1,707 | 18.2 | 2,895 | 29.1 | 598.8 (2) | <.0001 |
| Elsewhere in KwaZulu-Natal | 5,969 | 63.8 | 6,256 | 62.8 | ||
| Other South African Province or Int’l | 1,681 | 18.0 | 811 | 8.1 | ||
Source: ACDIS. Unit of analysis is migration event. Period shown is Jan. 1, 2001 through Dec. 31, 2006. N= 170 missing data on destination and n=1,282 missing data on urban/rural designation; missing data not shown.
Appendix Table A.1.
Population Characteristics in 2001, by Subsequent Migration in 2001-03
| Out-migration, Residents 2001-2003 % |
In-migration, Non-Residents 2001-2003 % |
Internal migration, Residents 2001-2003 % |
|
|---|---|---|---|
| INDIVIDUAL CHARACTERISTICS | |||
| Sex | |||
| Female | 11.0 | 15.3 | 2.7 |
| Male | 16.0 | 13.3 | 1.6 |
| Age group quantile | |||
| 18-22 | 25.5 | 19.4 | 3.4 |
| 23-28 | 22.1 | 14.7 | 3.4 |
| 29-37 | 11.8 | 11.6 | 2.7 |
| 38-50 | 6.3 | 10.6 | 1.3 |
| Over age 50 | 3.0 | 13.6 | 0.8 |
| Partnership pattern | |||
| No current partner | 13.6 | 16.4 | 1.8 |
| Marital partner | 4.0 | 11.4 | 0.8 |
| Regular non-marital partner | 16.5 | 13.8 | 3.4 |
| Casual partner | 25.5 | 17.4 | 2.4 |
| Employment status | |||
| Unemployed | 13.4 | 17.8 | 2.3 |
| Full or part-time employment | 11.1 | 10.4 | 2.1 |
| Education level | |||
| None or <1 year | 5.6 | 13.5 | 1.3 |
| Standard 1-5 | 9.6 | 13.7 | 1.9 |
| Standard 6-9 | 17.8 | 14.3 | 3.1 |
| Standard 10 (Matric) | 21.0 | 14.7 | 2.4 |
| Diploma, Bachelor’s or Master’s | 9.8 | 10.7 | 2.0 |
| Parenthood | |||
| Not parent to children in household | 15.3 | 14.5 | 2.4 |
| Parent to ≥1 children in household | 7.2 | 13.4 | 1.8 |
| HOUSEHOLD CHARACTERISTICS | |||
| Drink water source: Other source | 12.8 | 13.6 | 2.3 |
| Piped (private/public) | 12.5 | 14.7 | 1.9 |
| Sanitation: Other or none | 12.7 | 13.8 | 2.3 |
| Flush toilet/VIP | 12.4 | 16.0 | 1.8 |
| Drink water source: Other source | 12.8 | 13.6 | 2.3 |
| Piped (private/public) | 12.5 | 14.7 | 1.9 |
| Sanitation: Other or none | 12.7 | 13.8 | 2.3 |
| Flush toilet/VIP | 12.4 | 16.0 | 1.8 |
| Electricity: No source of electricity | 13.5 | 13.1 | 2.6 |
| Has electricity source (grid/generator) | 11.9 | 15.1 | 1.9 |
| Quantiles of household assets | |||
| Lower tertile of assets (0-2) | 13.4 | 14.3 | 2.5 |
| Middle tertile of assets (3-5) | 12.6 | 13.4 | 2.3 |
| Higher tertile of assets (6-17) | 13.0 | 14.9 | 1.8 |
| Pension-eligible adults: None | 13.9 | 14.5 | 2.2 |
| 1 or more males or both sexes | 11.0 | 13.0 | 2.1 |
| 1 or more females only | 12.0 | 14.2 | 2.3 |
| Household size | |||
| 1 to 4 | 11.0 | 12.2 | 1.8 |
| 5 to 7 | 12.6 | 14.9 | 1.9 |
| 8 to 10 | 12.8 | 14.3 | 2.2 |
| 11 to 14 | 14.2 | 15.5 | 2.4 |
| 15 or more | 14.0 | 13.0 | 2.8 |
Source: ACDIS. Data are for population aged 18 and older who were members of households on 01 January 2001. Percentages are weighted row percentages; survey participation propensity score weight applied.
Appendix Table A.2.
Characteristics of Migrants and Non-Migrants, by Type of Individual Migration
| I. Adult Residents | II. Adult Non-residents | III. Adult Residents | ||||||||||
|---|---|---|---|---|---|---|---|---|---|---|---|---|
| OUT-MIGRATION, 2001-03 | IN-MIGRATION, 2001-03 | INTERNAL MIGRATION, 2001-03 | ||||||||||
| No migration | Any migration | No migration | Any migration | No migration | Any migration | |||||||
| n | % | n | % | n | % | n | % | n | % | n | % | |
| INDIVIDUAL CHARACTERISTICS | ||||||||||||
| Sex | ||||||||||||
| Female | 14,420 | 89.4 | 1,717 | 10.6 | 9,569 | 86.7 | 1,471 | 13.3 | 15,717 | 97.4 | 420 | 2.6 |
| Male | 9,155 | 84.2 | 1,713 | 15.8 | 8,574 | 84.7 | 1,544 | 15.3 | 10,699 | 98.4 | 169 | 1.6 |
| Age group quantile | ||||||||||||
| 18-22 | 3,874 | 74.6 | 1,318 | 25.4 | 3,964 | 80.6 | 953 | 19.4 | 5,017 | 96.6 | 175 | 3.4 |
| 23-28 | 3,464 | 78.0 | 977 | 22.0 | 4,771 | 85.1 | 833 | 14.9 | 4,289 | 96.6 | 152 | 3.4 |
| 29-37 | 4,447 | 88.4 | 584 | 11.6 | 4,576 | 88.4 | 602 | 11.6 | 4,896 | 97.3 | 135 | 2.7 |
| 38-50 | 5,300 | 93.8 | 351 | 6.2 | 3,327 | 89.4 | 395 | 10.6 | 5,578 | 98.7 | 73 | 1.3 |
| Over age 50 | 6,490 | 97.0 | 200 | 3.0 | 1,505 | 86.6 | 232 | 13.4 | 6,636 | 99.2 | 54 | 0.8 |
| Partnership pattern | ||||||||||||
| No current partner | 6,835 | 86.4 | 1,073 | 13.6 | 4,046 | 83.7 | 791 | 16.4 | 7,771 | 98.3 | 137 | 1.7 |
| Marital partner | 6,797 | 96.0 | 284 | 4.0 | 2,859 | 88.6 | 369 | 11.4 | 7,025 | 99.2 | 56 | 0.8 |
| Regular non-marital partner | 9,169 | 83.5 | 1,813 | 16.5 | 10,171 | 86.1 | 1,636 | 13.9 | 10,611 | 96.6 | 371 | 3.4 |
| Casual partner | 726 | 74.5 | 248 | 25.5 | 995 | 82.5 | 211 | 17.5 | 951 | 97.6 | 23 | 2.4 |
| Employment status | ||||||||||||
| Unemployed | 14,450 | 86.9 | 2,174 | 13.1 | 7,225 | 82.3 | 1,556 | 17.7 | 16,256 | 97.8 | 368 | 2.2 |
| Full or part-time employment | 6,547 | 89.1 | 800 | 10.9 | 8,165 | 89.6 | 950 | 10.4 | 7,197 | 98.0 | 150 | 2.0 |
| Education level | ||||||||||||
| None or <1 year | 5,313 | 94.6 | 305 | 5.4 | 1,755 | 86.7 | 270 | 13.3 | 5,546 | 98.7 | 72 | 1.3 |
| Standard 1-5 | 6,289 | 90.6 | 650 | 9.4 | 3,905 | 86.3 | 620 | 13.7 | 6,812 | 98.2 | 127 | 1.8 |
| Standard 6-9 | 5,697 | 82.4 | 1,215 | 17.6 | 4,920 | 85.7 | 824 | 14.4 | 6,700 | 96.9 | 212 | 3.1 |
| Standard 10 (Matric) | 2,636 | 79.2 | 694 | 20.8 | 3,836 | 85.2 | 669 | 14.9 | 3,249 | 97.6 | 81 | 2.4 |
| Diploma, Bachelor’s or Master’s | 853 | 90.3 | 92 | 9.7 | 723 | 89.4 | 86 | 10.6 | 927 | 98.1 | 18 | 1.9 |
| Parenthood | ||||||||||||
| Not parent to children in household | 16,523 | 85.1 | 2,895 | 14.9 | 14,179 | 85.5 | 2405 | 14.5 | 18,960 | 97.6 | 458 | 2.4 |
| Parent to children in household | 7,052 | 93.0 | 535 | 7.1 | 3,964 | 86.7 | 610 | 13.3 | 7,456 | 98.3 | 131 | 1.7 |
| HOUSEHOLD CHARACTERISTICS | ||||||||||||
| Drink water source: Other | 12,506 | 87.5 | 1,789 | 12.5 | 9,900 | 86.4 | 1556 | 13.6 | 13,960 | 97.7 | 335 | 2.3 |
| Piped (private/public) | 8,501 | 87.7 | 1,191 | 12.3 | 5,494 | 85.3 | 950 | 14.7 | 9,510 | 98.1 | 182 | 1.9 |
| Sanitation: Other or none | 18,775 | 87.6 | 2,670 | 12.5 | 14,215 | 86.2 | 2,280 | 13.8 | 20,970 | 97.8 | 475 | 2.2 |
| Flush toilet/VIP | 2,243 | 87.9 | 310 | 12.1 | 1,198 | 84.0 | 228 | 16.0 | 2,509 | 98.3 | 44 | 1.7 |
| Electricity: No source | 10,137 | 86.8 | 1,542 | 13.2 | 8,758 | 86.9 | 1,326 | 13.2 | 11,387 | 97.5 | 292 | 2.5 |
| Electricity source (grid/generator) | 10,881 | 88.3 | 1,438 | 11.7 | 6,655 | 84.9 | 1,182 | 15.1 | 12,092 | 98.2 | 227 | 1.8 |
| Quantiles of household assets | ||||||||||||
| Lower tertile of assets (0-2) | 8,286 | 87.0 | 1,236 | 13.0 | 7,087 | 85.6 | 1,188 | 14.4 | 9,283 | 97.5 | 239 | 2.5 |
| Middle tertile of assets (3-5) | 7,162 | 87.7 | 1,007 | 12.3 | 5,487 | 86.6 | 853 | 13.5 | 7,985 | 97.8 | 184 | 2.3 |
| Higher tertile of assets (6-17) | 8,127 | 87.3 | 1,187 | 12.7 | 5,569 | 85.1 | 974 | 14.9 | 9,148 | 98.2 | 166 | 1.8 |
| Pension-eligible adults in household | ||||||||||||
| None | 13,584 | 86.3 | 2,155 | 13.7 | 10,632 | 85.5 | 1,808 | 14.5 | 15,399 | 97.8 | 340 | 2.2 |
| 1 or more males or both sexes | 3,364 | 89.4 | 400 | 10.6 | 2,389 | 87.0 | 358 | 13.0 | 3,686 | 97.9 | 78 | 2.1 |
| 1 or more females only | 6,627 | 88.3 | 875 | 11.7 | 5,122 | 85.8 | 849 | 14.2 | 7,331 | 97.7 | 171 | 2.3 |
| Household size | ||||||||||||
| 1 to 4 | 3,421 | 89.5 | 402 | 10.5 | 1,922 | 87.9 | 265 | 12.1 | 3,754 | 98.2 | 69 | 1.8 |
| 5 to 7 | 5,617 | 87.8 | 780 | 12.2 | 3,606 | 85.1 | 632 | 14.9 | 6,278 | 98.1 | 119 | 1.9 |
| 8 to 10 | 5,856 | 87.4 | 842 | 12.6 | 4,678 | 85.6 | 786 | 14.4 | 6,553 | 97.8 | 145 | 2.2 |
| 11 to 14 | 4,859 | 86.0 | 790 | 14.0 | 4,198 | 84.4 | 775 | 15.6 | 5,515 | 97.6 | 134 | 2.4 |
| 15 or more | 3,822 | 86.1 | 616 | 13.9 | 3,739 | 87.0 | 557 | 13.0 | 4,316 | 97.3 | 122 | 2.8 |
Source: ACDIS. Data for population aged 18 and older who were members of households on 01 January 2001. Unweighted row percentages shown.
Variables
In order to identify characteristics predictive of migration, we used data on socio-economic and other characteristics of individuals that were collected prior to their subsequent migration events.9 That is, we examine only the migrations undertaken after the HSE-1 data were collected. For this paper, we examine residency status and individual out-migration and in-migration events as defined in ACDIS, and two measures of short-term mobility: a dichotomous measure of present versus not present at household on the night prior to data collection (the first visit after January 1, 2001); and a categorical measure of the extent of recent presence in the household, with four levels: In the household every night, present most nights, present approximately half, and present few or no nights in the previous four months.
On the basis of prior research, we examined a set of characteristics likely to be associated with migration: sex, age, employment status, education level, marital/partnership status, and parenting status.10 We also examine the characteristics of individuals’ households including size; the sex and number of pension-eligible adults (ages 60 and older for women, and 65 and older for men); the dependency ratio (the ratio of children aged 0 to 17 years and pension-eligible adults to working-age adults); and measures of household socio-economic status, including electricity, watersource and sanitation, and household assets. The asset scale is a sum of the number of up to 17 assets in the household, divided into tertiles to provide a lower-, middle- and higher-level grouping of economic status. A dichotomous measure of the occurrence of any death of another adult in the household in 2001–02 prior to a migration was also included. The comparison category for this variable included individuals for whom no adult in the household died in the two-year period prior to migration and individuals who may have lost another adult household member to death after migration. This variable was included because previous research in the population showed that households experiencing more than one adult death or an injury death were more likely than other households to dissolve within two years of the death (Hosegood et al., 2004a).
Table 3 shows the distribution of individual out-migrations by sex and type of destination; the categories of destinations included rural versus urban, and within the urban category, whether formal or informal. Destinations were also classified into the categories “Mpukunyoni Tribal Area of Hlabisa District” which refers to areas that are within the local tribal area but not part of ACDIS surveillance; “Elsewhere in KZN” referring to within-province migrations beyond Mpukunyoni and Hlabisa; and “Other South African Province or International”. The latter category combines migrations to other South African provinces with migrations to other African countries and beyond, as international migrations were few in number (<1% of adult out-migrations in 2001–06.)
Statistical analysis
Multiple logistic and ordinal logit regression models were fitted to characterize sex differences in patterns and determinants of migration events. For the basic logit model, the logistic transformation of the success probability p is given by
logit (pi) equals xi’β, where β denotes the (K+1) × 1 vector of regression coefficients to be estimated (Powers and Xie 2000). Given that we use several household-level variables in these models, we adjusted standard errors for the clustering of individuals within households.
We calculated age-adjusted sex differences in the predicted probability of degree of presence in the household by fitting an ordinal logit regression model with age and sex as independent variables and a four-level dependent variable measuring household presence. The cumulative probability of the ordered logit model, a ‘proportional odds model’, is written as
Given the large population size for these analyses, the significance level for all statistical tests was set to 99%.
RESULTS
Sex differences in migration and mobility across several measures
As shown in Table 1, whether men or women predominated within the category of “migrant” varied by the definition and measure used. In a composite measure of individual migration of any type, women slightly predominated: 19.4% of all adult women versus 19.1% of adult men, overall, migrated within a two year period. Yet men (50.4%) were more likely than women (38.5%) to be a non-resident household member; and male residents were more likely than female residents to have out-migrated at least once within two years (15.8% versus 10.6%). Men were also less likely than women to have been present in the household on the night of the first visit after January 1, 2001.
Table 1.
Sex Differences in Measures of Residency Status, Migration, and Presence in Household on Night Before Visit
| Measure of residency status, migration, and household presence on night before visit | Adult females | Adult males | aOR | 99% CI | |||
|---|---|---|---|---|---|---|---|
| n | col.% | n | col.% | Female: Male |
|||
| Non-resident status on 01 Jan. 2001 | 10,122 | 38.5 | 11,044 | 50.4 | 0.64 | 0.61 | 0.67 |
| Resident on 01 Jan. 2001 | 16,142 | 61.5 | 10,873 | 49.6 | |||
| Any individual migration, 2001–03 | 5,082 | 19.4 | 4,185 | 19.1 | 1.09 | 1.02 | 1.16 |
| No individual migration in period | 21,182 | 80.7 | 17,732 | 80.9 | |||
| Any in-migration 2001-03, non-residents | 1,544 | 15.3 | 1,473 | 13.3 | 1.14 | 1.03 | 1.26 |
| No in-migration in period | 8,578 | 84.8 | 9,571 | 86.7 | |||
| Any out-migration 2001–03, residents | 1,717 | 10.6 | 1,713 | 15.8 | 0.74 | 0.67 | 0.82 |
| No out-migration in period | 14,425 | 89.4 | 9,160 | 84.3 | |||
| Absent from household, night before visit | 7,503 | 28.6 | 8,786 | 40.1 | 0.62 | 0.59 | 0.65 |
| Present in household, night before visit | 18,752 | 71.4 | 13,122 | 59.9 | |||
Source: ACDIS. Data are for population aged 18 and older who were members of households on 01 January 2001.
aOR: Odds ratios from logistic regression models are adjusted for age only.
The level of recent mobility in the population was quite high, even among residents, who may be presumed to be more residentially stable than non-resident household members. Resident women had only a slightly higher probability than resident men (0.50 versus 0.47) of having been present every night in the household, and a slightly lower probability than men (0.41 versus 0.43) of having been present most nights in the previous four months (Figure 2). Among non-residents, men were more likely than women (0.49 versus 0.40) to have been in the home few or no nights, while women had higher probabilities than men of being in the home approximately half (0.28 versus 0.26), most nights (0.19 versus 0.15), and every night (0.14 versus 0.10) in the previous four months. Thus, although women are more likely to be classified as resident, they are nonetheless highly mobile: only half of resident women were present in the household every night in the past four months, and some ten percent were present approximately half or fewer nights. Moreover, those classified as non-resident were often present in the household, with women more likely than men to have been present at least some nights.
Figure 2.
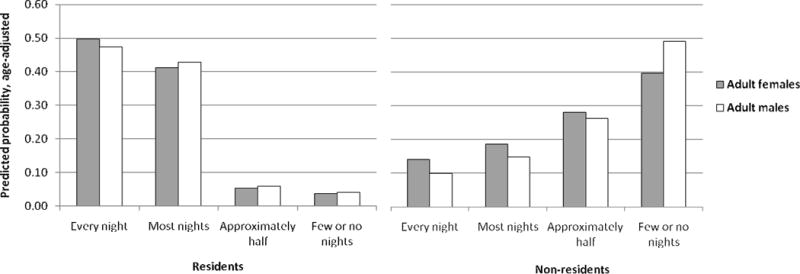
Probability of degree of presence in the household in past four months, by residency status
Source: Africa Centre Demographic Information System (ACDIS). Data are for total population aged 18 and older who were members of households on 01 January 2001. Predicted probabilities are from ordered logit model of nights in household in past 4 months, controlling for age.
Sex and age-pattern of migration rates in 2001, by type of migration
Sex differences in migration rates were larger in some age groupings than in others, as shown in Figures 3 and 4. In 2001, in-migration rates for both non-resident men and women peaked in the 20–24 year age group, but the rates diverged widely by sex: 108 female versus 86 male non-residents in this group (per 1,000) in-migrated in 2001 (Figure 3). In-migration rates declined in the age 30 and older groups and rose again in the 40 and older groups, but rates were higher for women than men across all ages. The widest interval of sex difference was seen in the 30–34 year age group, in which 68 female versus 45 male per 1,000 non-residents in-migrated. An opposite pattern was seen in the age-specific out-migration rates of resident men and women in 2001 (Figure 4): out-migration rates of men exceeded those of women in every age group except the 15–19 year group, in which 61 females versus 55 males per 1,000 out-migrated; and out-migration rates were virtually the same among men and women aged 25–29. The highest rate was again in the 20–24 year age group.
Figure 3.
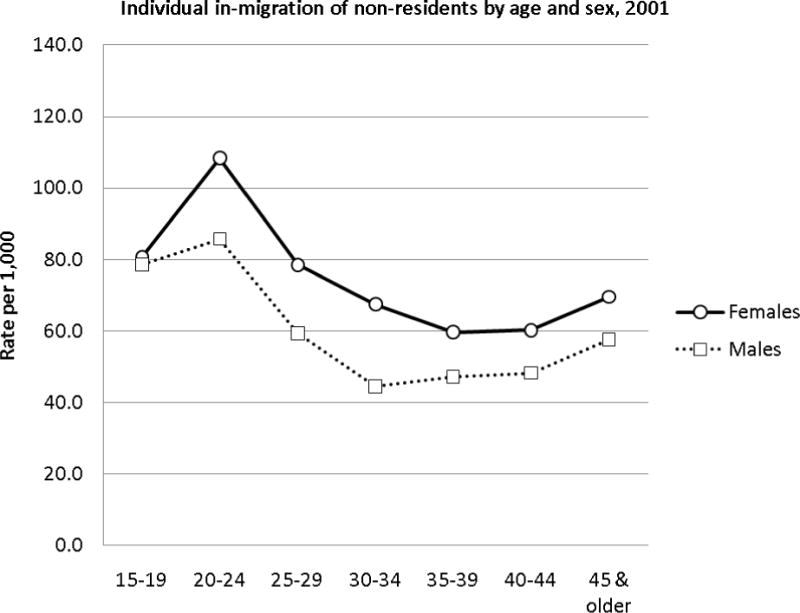
Source: ACDIS. Data are for population aged 15 and older who were non-resident members of households on 01 January 2001.
Figure 4.
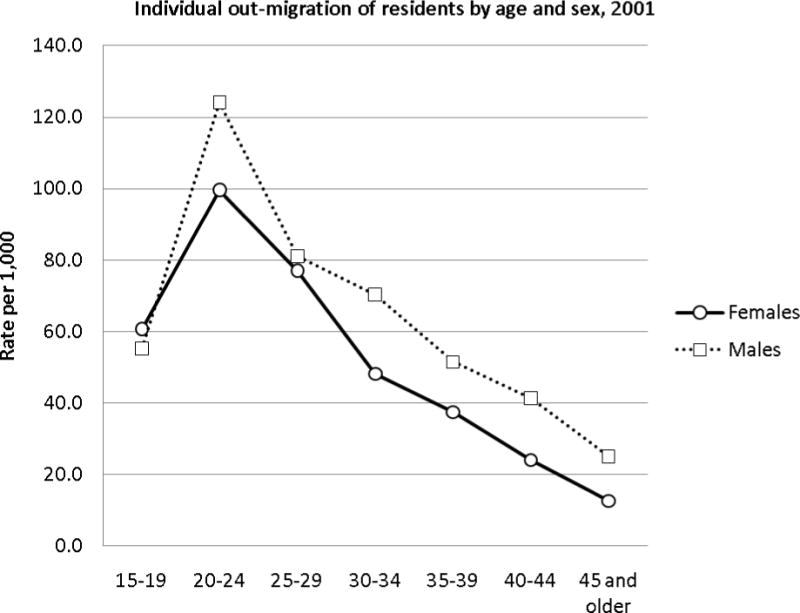
Source: ACDIS. Data are for population aged 15 and older who were resident members of households on 01 January 2001.
Sex differences in migration trends, 2001–2006
Figure 5 displays the trends of migration in the years 2001 through 2006, by sex and type of migration. Rates of in-migration remained higher for women than men (although the gap narrowed somewhat in 2005–06), averaging 81 per 1,000 for female and 70 per 1,000 for male non-residents over the six-year period. Individual out-migration rates remained higher among male than female residents, averaging 99 for men and 64 for women per 1,000 over the period. Overall, the sex-specific annual rates of in-migration did not change remarkably over the period, but rates of male out-migration declined, confirming a widening sex ratio imbalance within the ACDIS population over the years 2001–2006 (Muhwava et al. 2010).
Figure 5.
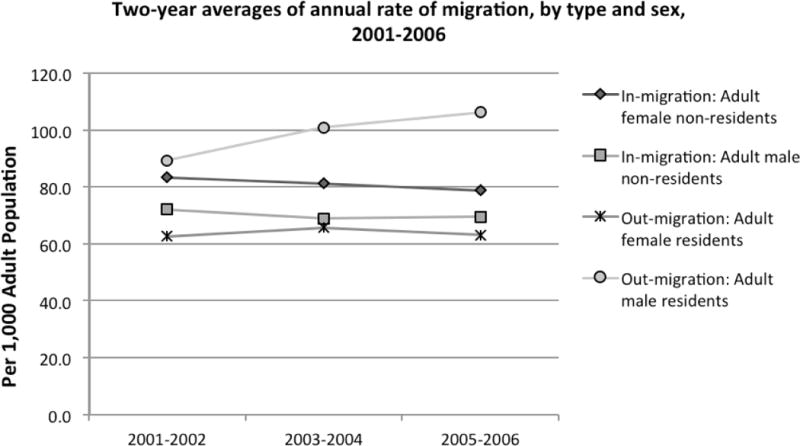
Source: ACDIS. Data are two-year averages of annual rates of in-migration (per 1,000 population), for populations aged 15 and older who were non-resident members of households on 01 January in years 2001 through 2006.
Socio-economic and demographic factors predictive of migration
As shown in Table 2, the factors predictive of migration in 2001–02 varied both by sex and by the type of migration. While out-migration was negatively associated with age for both men and women, other factors were more strongly predictive of women’s out-migration. Women with a marital partner had almost 60% lower odds of out-migration relative to unmarried women (aOR=0.42, versus the equivalent aOR= 0.66 in men). The out-migration of women, only, was positively associated with having attained the highest level of secondary education or higher (aOR=1.25; relative to those with the least education), and with the recent death of another adult in the household (aOR=1.56), and negatively associated with sharing the same household as one’s child (aOR=0.59). The household dependency ratio also negatively influenced women’s out-migration only: each unit increase in the ratio (reflecting an increase in the number of dependents relative to the number of working-age adults) reduced the odds of out-migration by 9% (aOR=0.91). However, the number of other adults with employment in the household had no influence on out-migration, suggesting that as the ratio of dependents to working adults increased, women’s out-migration is reduced more due to their involvement in care-giving than due to the suppressing effect of earned income to the household from other adults.
The right columns of Table 2 show factors predictive of in-migration in the non-resident populations of female and male adults, respectively. Household members who were non-resident on Jan. 1, 2001 but subsequently in-migrate are a special category of ‘in-migrants’: these are individuals who already had a significant tie to the area, and are not newcomers (for whom ACDIS has no information). Many of the factors that appeared to facilitate out-migration may also constrain in-migration, but in contrast to the out-migration models, were more strongly predictive in men. In-migration was negatively associated with being employed for women (aOR=0.72), but especially men (aOR=0.54). In men only, in-migration was negatively associated with having attained the highest education level (aOR=0.75), and positively associated with sharing a household with one’s children (aOR=1.30). The increasing role of men in caregiving, in a context of high HIV mortality in women, may account in part for this finding: the death of another adult predicted the in-migration of women (OR=1.57), but especially men (OR=1.71). Household infrastructure also appeared to facilitate men’s migration: household electricity access was significantly associated with the in-migration of men only (aOR=1.21).
Sex differences in out-migration destinations
Out-migrations to rural areas were significantly more likely to be undertaken by women than men (50.4 versus 35.3%) in 2001 through 2006. The out-migrations to urban areas (64.8% by males and 49.6% by females) were predominantly to formal areas for both sexes, although migrations to informal urban areas trended towards a greater proportion of females. Out-migrations to local areas near the surveillance area were more likely to be undertaken by women (29.1%) than men (18.2%); whereas male migrations outnumbered female migrations as a proportion of international out-migration events over the period (18.0% versus 8.1%). Across many measures, women were seen to undertake more local, shorter-term migration than men, and to predominate in the rural-rural migration flow.
DISCUSSION
This study documents extraordinarily high levels of mobility in a population of adults living in an area on the northern coast of KZN, South Africa; an area that in many ways is typical of the rapidly changing, and urbanizing, formerly rural ‘homelands’ of the nation. A large proportion of members of households are living away from their homes while continuing to be socially connected to them; and despite popular assumptions that women in rural areas are the ‘stay at home’ partners of male migrants, they are far from residentially stable. Resident members of households, who were disproportionately female and may have been assumed to represent the ‘stable’ population, were also highly mobile. At least half of both male and female residents were absent from home at least some of the time in the previous four months, and only 60 to 70 percent would have been found at home on the night prior to the surveillance visit.
This study used detailed measures of migration, examining sex-specific patterns of mobility over national and provincial boundaries and shorter-distance migrations in and out of a local surveillance area, and finding distinct sex differences in the patterns and determinants of migration. Men’s and women’s migration flows and destinations differed significantly, with overall higher rates out of, but not into, the surveillance area in men than women 2001 through 2006. Women predominated in migration flows to other rural areas, and men in flows to urban areas; and men migrated over longer distances, greatly outnumbering women in inter-provincial and international migration. Yet when out-migration, in-migration and localized internal migration were combined in a single indicator representing ‘any migration’, women’s levels of participation in migration were similar or slightly higher than those of men.
The results highlight the importance of measurement both for ascertaining sex differences in migration patterns and flows and for the development of measures that accurately capture both men’s and women’s overall levels of participation in migration. This study exploited unique advantages in DSS data for these purposes, providing the needed detail not available in either censuses or many existing surveys for the study of sex-specific forms of internal migration. These findings provide a quantitative referent to the historical and ethnographic accounts (e.g. (Bozzoli 1991; Hunter 2007; Todes 1998) of women’s high levels of mobility in South Africa, and of their participation in localized, rural-to-rural and -peri-urban migration flows. They imply that health and social policy that assumes a uniform participation by women and men in processes of urbanization, assuming equal participation by both sexes in rural-to-urban migration flows and the primacy of large urban areas as migration destinations, will under-recognize women’s participation in and unique patterns of mobility. A closer attention to women’s mobility reveals a rural South Africa in dramatic flux, with new configurations of household composition emerging in response to both the catastrophe of AIDS and the opportunities afforded by large social transfers (i.e. the old age pension) and changing gender norms surrounding migration.
Mobility in the ACDIS population appears very high, compared to other South African populations: the detailed measures of migration used in ACDIS show very high rates of migration relative to national-level estimates of rural-to-urban migration rates using South Africa census data (e.g. 15.6 per 1,000 in 1990–99) (Anderson 2006). Our findings were more comparable with those of other DSSs using ‘event-based’ measures of migration area (Adazu 2009) than to census-based measures; however, ACDIS rates were higher even relative to the high in-migration and out-migration rates in the Agincourt DSS over the years 2000–2004, in which, for example, in-migration peaked at 34 and out-migration peaked at 49 per 1,000 women aged 20 to 24 (Collinson et al. 2006). While not directly comparable, the ACDIS migration rates are closer to the high rates of migration observed in DSS populations in Kenya (Collinson 2009). For example, at the rural Kisumu site in 2002, out-migration rates were highest in women aged 20 to 24, at over 30 per 100 person-years (Ibid.); female migration in Kisumu, it was noted, was not only for purposes of employment but also for marriage, which, in contrast to South Africa, is very common. Cross-national research would be needed to ascertain the reasons for similarities and differences in rates across sites in the region. However, it is equally important to study location-specific forms of mobility and the economic and social processes producing these sometimes unique, complex forms (Deane, Parkhurst and Johnston 2010), and to draw inferences from these observations for similar locations.
This study also confirms prior research emphasizing the saliency of women’s increasing labor force participation as a driver of female migration in South Africa, as migration for nuptiality has declined (Casale and Posel 2002), and as female migrant remittances have become a crucial livelihood strategy for the poorest households (Collinson et al. 2009). In the ACDIS population, marriage reduced the likelihood of women’s migration, and had no influence on men’s migration, but it was uncommon: in 2001, only 20.4% of adults were currently married, although almost all were parents. Given the low rates of marriage in this population, female migrants are not predominantly young, unmarried women without children, as is the case in settings in which marriage is universal. Indeed, the findings support the proposition (Hunter, 2007) that gender norms related to migration for marriage may be changing in South Africa, as marriage remains a valued ideal that is increasingly hard to attain.
In the ACDIS population, being unemployed was associated with both men’s and women’s migration from the area, while being employed outside of the area reduced the likelihood of a return. Migrants overall were more highly educated than non-migrants; however, educational attainment was also positively associated with women’s out-migration, and negatively associated with men’s in-migration. Further research would be needed to ascertain whether women’s aspirations, tied to educational attainment, more frequently drive their migration due to the comparatively lower benefits of education for women’s employment in rural places of origin; or whether women experience relatively lower returns on education in labor markets in urban destinations, facilitating their return migrations to rural areas.
A previous analysis of ACDIS data on the effects of the old-age pension on households found the arrival of a pension facilitated the labor migration of prime-aged household members (Ardington et al. 2009). This impact was attributed both to an increase in household resources, used to stake migrants until they become self-sufficient, and to the presence of pensioners who can care for children. In this study, the presence of pension-eligible adults in the household was not significantly associated with subsequent migration. However, this study was not designed to detect whether losses or gains of pensioners in households impacted upon migration, and such an approach may be required to replicate prior results.
A major driver of both men’s and women’s migration was the HIV-related death of another adult in the household, confirming prior research in this population: mortality due to HIV is known to have contributed to household instability, precipitating the migration of adults and children (Ford and Hosegood 2005; Hosegood et al. 2007; Hosegood et al. 2004a; Hosegood and Timaeus 2005b; Welaga et al. 2009). HIV-related mortality was high in the population during the period considered in this study (Hosegood et al. 2004b), although it began to decline after 2004 (Herbst et al. 2009). In South African households, the death of an adult member to an HIV-related illness can be catastrophic, stimulating the migration of other adults and children for a variety of reasons. People living with HIV migrate to be cared for or to live near to the health services they need (Welaga et al. 2009).11 The burden of women as caregivers in the epidemic is well-documented, however, gender norms related to caregiving may be changing.12
For health and social research and policy, close attention to the gender dimensions of mobility, and to the potential gender biases in conventional measures and data sources, will be needed: women’s shorter-distance, shorter-term movements may be less easily measured or predicted than men’s, with important implications for service planning and delivery. Promising new approaches may include time-location sampling strategies (see, for example (MacKellar et al. 2007; Magnani et al. 2005; Stueve et al. 2001) in key migration destinations, and utilization of cell phone technologies to track and communicate with clinic populations (Besser 2010; Lester, Gelmon and Plummer 2006). New advances in the development of measures of complex patterns of mobility may be informative for characterizing temporary “service populations” (Taylor and Bell 2011) in the era of health interventions such as HIV antiretroviral therapy.
In this context of multi-generational, geographically stretched households and low marriage rates, young women—like their male counterparts— are on the move to seek opportunities, follow aspirations and earn income. Gender is intrinsic to the social transformations fueling high levels of internal migration and complex forms of mobility in South Africa, with diverse social, economic and health consequences.
Table A.3.
Baseline characteristics predictive of subsequent migration in 2001-03, by sex and type of migration (Multiple logistic regression models with robust standard errors and 99% CI)
| I. Out-migration of residents | II. In-migration of non-residents | III. Internal migration of residents | ||||||||||||||||
|---|---|---|---|---|---|---|---|---|---|---|---|---|---|---|---|---|---|---|
| Adult females | Adult males | Adult females | Adult males | Adult females | Adult males | |||||||||||||
| OR | 99% CI | OR | 99% CI | OR | 99% CI | OR | 99% CI | OR | 99% CI | OR | 99% CI | |||||||
| INDIVIDUAL CHARACTERISTICS | ||||||||||||||||||
| Age group quantile | ||||||||||||||||||
| 18-22 | ||||||||||||||||||
| 23-28 | 1.01 | 0.82 | 1.24 | 0.91 | 0.74 | 1.12 | 0.84 | 0.68 | 1.04 | 0.85 | 0.68 | 1.06 | 0.97 | 0.65 | 1.44 | 1.11 | 0.62 | 2.00 |
| 29-37 | 0.63 | 0.49 | 0.82 | 0.48 | 0.37 | 0.62 | 0.66 | 0.50 | 0.85 | 0.63 | 0.48 | 0.81 | 0.98 | 0.62 | 1.55 | 0.71 | 0.35 | 1.46 |
| 38-50 | 0.30 | 0.22 | 0.41 | 0.36 | 0.27 | 0.49 | 0.59 | 0.43 | 0.81 | 0.47 | 0.34 | 0.66 | 0.38 | 0.21 | 0.70 | 0.46 | 0.18 | 1.17 |
| Over age 50 | 0.13 | 0.09 | 0.18 | 0.16 | 0.10 | 0.24 | 0.64 | 0.43 | 0.95 | 0.69 | 0.47 | 1.00 | 0.20 | 0.10 | 0.38 | 0.25 | 0.08 | 0.80 |
| Partnership pattern | ||||||||||||||||||
| No current marital partner |
||||||||||||||||||
| Currently married | 0.42 | 0.31 | 0.56 | 0.64 | 0.47 | 0.88 | 1.09 | 0.81 | 1.47 | 1.04 | 0.79 | 1.38 | 0.36 | 0.21 | 0.62 | 1.03 | 0.42 | 2.52 |
| Employment status | ||||||||||||||||||
| Unemployed | ||||||||||||||||||
| Full or part-time employment |
0.97 | 0.80 | 1.19 | 0.94 | 0.78 | 1.15 | 0.72 | 0.59 | 0.88 | 0.54 | 0.45 | 0.66 | 0.97 | 0.67 | 1.40 | 2.00 | 1.19 | 3.36 |
| Education level | ||||||||||||||||||
| None - Standard 5 | ||||||||||||||||||
| Standard 6-9 | 1.05 | 0.85 | 1.29 | 1.12 | 0.92 | 1.38 | 0.85 | 0.68 | 1.06 | 0.84 | 0.69 | 1.03 | 0.98 | 0.67 | 1.44 | 1.29 | 0.72 | 2.33 |
| ≥Standard 10 (Matric) | 1.27 | 1.00 | 1.61 | 1.18 | 0.93 | 1.50 | 0.98 | 0.77 | 1.23 | 0.75 | 0.60 | 0.94 | 0.93 | 0.58 | 1.47 | 0.64 | 0.29 | 1.42 |
| Parenthood | ||||||||||||||||||
| Not a parent to children in household |
||||||||||||||||||
| Parent to children | 0.59 | 0.48 | 0.73 | 0.91 | 0.69 | 1.19 | 1.07 | 0.87 | 1.31 | 1.30 | 1.00 | 1.68 | 0.81 | 0.56 | 1.16 | 0.87 | 0.41 | 1.84 |
|
HOUSEHOLD CHARACTERISTICS |
||||||||||||||||||
|
Household dependency ratio |
0.92 | 0.81 | 1.03 | 0.96 | 0.85 | 1.09 | 1.02 | 0.91 | 1.14 | 1.05 | 0.93 | 1.19 | 0.93 | 0.76 | 1.13 | 0.93 | 0.63 | 1.36 |
|
Sum of adults employed full-time |
1.04 | 0.98 | 1.10 | 1.02 | 0.96 | 1.09 | 0.98 | 0.92 | 1.04 | 0.99 | 0.94 | 1.05 | 0.97 | 0.87 | 1.09 | 1.06 | 0.88 | 1.26 |
|
Water source: Other Piped (private/public) |
1.06 | 0.88 | 1.26 | 0.93 | 0.78 | 1.11 | 1.06 | 0.89 | 1.28 | 1.04 | 0.87 | 1.24 | 0.86 | 0.62 | 1.18 | 0.86 | 0.51 | 1.45 |
|
Sanitation: Other/none Flush toilet/VIP |
1.04 | 0.79 | 1.36 | 0.88 | 0.65 | 1.18 | 1.24 | 0.91 | 1.68 | 1.00 | 0.74 | 1.37 | 1.07 | 0.60 | 1.91 | 1.08 | 0.44 | 2.62 |
|
Electricity: No source Electricity source (grid/generator) |
0.85 | 0.71 | 1.02 | 0.66 | 0.55 | 0.79 | 1.01 | 0.84 | 1.22 | 1.21 | 1.00 | 1.46 | 0.70 | 0.50 | 0.98 | 0.98 | 0.57 | 1.70 |
| Quantiles of assets | ||||||||||||||||||
| Lower tertile of assets Middle tertile of assets |
0.86 | 0.69 | 1.06 | 1.08 | 0.89 | 1.33 | 1.11 | 0.89 | 1.38 | 0.96 | 0.77 | 1.20 | 0.88 | 0.62 | 1.26 | 0.98 | 0.54 | 1.75 |
| Higher tertile of assets | 1.02 | 0.81 | 1.29 | 1.11 | 0.88 | 1.40 | 1.09 | 0.85 | 1.39 | 1.17 | 0.92 | 1.48 | 0.88 | 0.57 | 1.36 | 0.66 | 0.33 | 1.32 |
|
Pension-eligible adults: None1 or more males or both sexes |
0.99 | 0.75 | 1.32 | 0.85 | 0.64 | 1.11 | 0.87 | 0.65 | 1.16 | 0.86 | 0.65 | 1.12 | 1.05 | 0.67 | 1.65 | 1.23 | 0.59 | 2.57 |
| 1 or more females only | 0.96 | 0.78 | 1.17 | 0.87 | 0.72 | 1.06 | 0.98 | 0.80 | 1.19 | 1.01 | 0.83 | 1.23 | 0.87 | 0.61 | 1.24 | 1.31 | 0.76 | 2.26 |
| Death of ≥1 adults before 1st migration |
1.57 | 1.18 | 2.11 | 0.89 | 0.67 | 1.18 | 1.54 | 1.16 | 2.04 | 1.71 | 1.28 | 2.28 | 9.01 | 5.33 | 15.26 | 23.65 | 12.14 | 46.09 |
| N | 14,193 | 9,356 | 8,241 | 9,303 | 14,193 | 9,356 | ||||||||||||
| Wald χ2 (19) | 955.8 | 584.8 | 119.1 | 265.9 | 337.5 | 212 | ||||||||||||
Source: ACDIS. Data are for population aged 18 and older who were members of households on 01 January 2001. Models using unweighted data shown.
Acknowledgments
We thank Yu Xie, James Levinsohn, Mark Padilla and Marie-Louise Newell for their reviews of Carol Camlin’s dissertation chapters that formed the basis of this paper. We are grateful for the participation of the members of the Africa Centre surveillance population, the Community Liaison, field staff, data capturers and database scientist in the production of data for this study.
Carol Camlin was supported by National Institute of Mental Health grants (T32-19105–20 and K01MH093205) during the writing of this manuscript. The content of this manuscript is solely the responsibility of the authors and does not necessarily represent the views of the National Institutes of Health. Several University of Michigan institutions also provided grant support for this research: the Rackham School of Graduate Studies, Center for the Education of Women, Center for Comparative and International Studies, International Institute, Alumni/Alumnae Council, South African Initiatives Office, Global Health Research and Training Initiative, and Institute for Research on Women and Gender. The Wellcome Trust provides core funding for the Africa Centre for Health and Population Studies, University of KwaZulu-Natal (UKZN), including for the surveillance data used for this study (Grant GR082384/Z/07/Z). Victoria Hosegood was separately funded by the Wellcome Trust (WT082599MA).
Footnotes
Similarly, survey data from the Southern African Migration Project in 1997 showed that among immigrants to South Africa, males have continued to favor the mining areas in Gauteng, while women have favored smaller towns and cities as destinations. See Dodson, B. 2000. “Women on the move: Gender and cross-border migration to South Africa from Lesotho, Mozambique and Zimbabwe.” Pp. 119–150 in On Borders: Perspectives on International Migration in Southern Africa, edited by D.A. McDonald. New York: St. Martin’s Press.
A counter-urbanization may even be occurring in South Africa as a result of decreasing standards of living in urban slums, as in other areas in the region. See Collinson, M.A. 2007. “Migration, settlement change and health in post-apartheid South Africa: Triangulating health and demographic surveillance with national census data.” Scandinavian Journal of Public Health 69:77–84, Potts, D. 1995. “Shall we go home? Increasing urban poverty in African cities and migration processes.” Geographical Journal 161:245–264, —. 2005. “Counter-urbanisation on the Zambian copperbelt? interpretations and implications.” Urban Studies 42(4):583–609.
3 These are areas of high social instability, characterized by high density housing and limited infrastructure. They are also typical settings for the informal sector employment (such as street trading, beer-brewing, sewing and other activities) in which women predominate. Hunter noted that since the early 20th century, informal settlements have been known to be places of poverty and transactional sex, but also as places that attracted female migrants, as they were known to allow women “a certain independence”. Hunter, M. 2007. “The changing political economy of sex in South Africa: the significance of unemployment and inequalities to the scale of the AIDS pandemic.” Social Science & Medicine 64(3):689–700. See also —. 2010. “Beyond the male-migrant: South Africa’s long history of health geography and the contemporary AIDS pandemic.” Health & Place 16(1):25–33.
One analysis of survey data showed that the national percentage of black women currently married declined from 35 in 1993 to 30 in 1999 Posel, D. 2006. “Moving on: Patterns of Labour Migration in Post-Apartheid South Africa.” in Africa on the Move: African Migration and Urbanisation in Comparative Perspective, edited by M. Tienda, S. Findley, S. Tollman, and E. Preston-Whyte. Johannesburg: Wits University Press. Another study comparing 1970 and 1996 census data reported that in KZN, the percentage of those over age 50 who were never married had risen from 14 to 27% among men, and from 5 to 18% among women Udjo, E. 2001. “Marital patterns and fertility in South Africa: The evidence from the 1996 Population Census.” Presented at XXIVth IUSSP International Population Conference, August 18–24, Salvador de Bahia.
In the population of 48,164 adults aged 18 and older who were members of households on 01 January 2001, 1,966 individuals (4.1%) were members of more than one household on that date. To define these individuals’ household characteristics, just one of their households was selected: the household at which they were resident or had spent the most time in the previous 6 months.
Residency is unique to bounded structures, not to households. Therefore, some polygamous men were not only members but also residents of more than one household within a bounded structure at the same time. Where there were multiple memberships of households that were resident at the same bounded structure at the same time, we selected the residence at which the individual spent the most time in the previous 6 months.
Few of these individuals actively refused to participate: some had out-migrated after January 1, 2001 and not retained a household membership before the HSE-1 data collection began, some died before HSE-1 data collection began, and some were not found.
Where Xi … represents the known covariates of ‘participation’ in the HSE-1. These included sex, residency status, marital status, and other measures of household composition. The predicted probabilities from this model were the propensity scores. We then weighted the respondents by dividing the mean participation rate by the predictions of the regression; i.e. weight=r(mean participated) / Pr(M = 1). The method corresponds to ‘inverse probability weighting’, another term used in the literature on causal inference methods.
These analyses used the most recent demographic information collected prior to (or at same time as) the collection of socio-economic data for each individual who participated in the HSE-1. Where HSE-1 data were missing, the demographic information collected at earliest visit after January 1, 2001 was used.
The social separation of parents and children in this population is common, with many children living with grandparents. A recent study found that only 27% of non-orphans were living with both parents (Hosegood, Floyd et al. 2007). In a context of low marriage rates, the co-membership of fathers with children is much lower than of mothers with children, which reduces the overall percentage of parents sharing household membership with children. This variable indicates whether either the mother or the father was a member of the same household as at least one of their children, on January 1, 2001.
The initiation of the Africa Centre HIV Treatment and Care Programme is “growing alarmingly”, increasingly drawing an influx of people into the area. (Marie-Louise Newell, personal communication, Feb. 24, 2011).
Montgomery and colleagues (2006) documented the ways in which, in the context of HIV, men in KZN are positively involved with their families: “They care for patients and children, financially support […] family members and are present at home, thereby enabling women to work […]” (p. 2411).
References
- Abdool Karim Q, Abdool Karim SS, Singh B, Short R, Ngxongo S. Seroprevalence of HIV infection in rural South Africa. AIDS. 1992;6(12):1535–1539. doi: 10.1097/00002030-199212000-00018. [DOI] [PubMed] [Google Scholar]
- Adazu K. Health and Demographic Surveillance Migration Methodology and Data: A Promise for Cross-Site Comparative Analyses. In: Collinson MA, Adazu K, M White, S Findley, editors. The Dynamics of Migration, Health and Livelihoods: INDEPTH Network Perspectives. Surrey, England: Ashgate; 2009. [Google Scholar]
- Anderson B. Migration in South Africa in Comparative Perspective. In: Kok P, Gelderblom D, Oucho JO, van Zyl J, editors. Migration in South and Southern Africa: Dynamics and Determinants. Cape Town, South Africa: Human Sciences Research Council; 2006. pp. 97–117. [Google Scholar]
- Ardington C, Case A, Hosegood V. Labor supply responses to large social transfers: Longitudinal evidence from South Africa. American Economic Journal: Applied Economics. 2009;1(1):22–48. doi: 10.1257/app.1.1.22. [DOI] [PMC free article] [PubMed] [Google Scholar]
- Ardington E, Lund F. Pensions and development: Social security as complementary to programmes of reconstruction and development. Development Southern Africa. 1995;12(4) [Google Scholar]
- Barnighausen T, Tanser F, Newell ML. Lack of a decline in HIV incidence in a rural community with high HIV prevalence in South Africa, 2003–2007. AIDS Research and Human Retroviruses. 2009;25(4):405–409. doi: 10.1089/aid.2008.0211. [DOI] [PMC free article] [PubMed] [Google Scholar]
- Beauchemin C, Bocquier P. Migration and urbanisation in Francophone west Africa: An overview of the recent empirical evidence. Urban Studies. 2004;41(11):2245–2272. [Google Scholar]
- Beguy D, Bocquier P, Zulu EM. Circular migration patterns and determinants in Nairobi slum settlements. Demographic Research. 2010;23:549–586. [Google Scholar]
- Besser M. XVIII International AIDS conference. Vienna, Austria: 2010. Promoting client retention during PMTCT and follow-up care: lessons learned through active client follow up at mothers2mothers sites in Kenya and South Africa. [Google Scholar]
- Billsborrow RE. State of the Art and Overview chapters. In: Billsborrow RE, editor. Migration, Urbanization and Development: New Directions and Issues. New York: UNFPA and Kluwer; 1998. [Google Scholar]
- Bilsborrow RE. Preliminary Report of the United Nations Expert Group Meeting on the Feminization of Internal Migration. International Migration Review. 1992;26(1):138. [Google Scholar]
- Boerma JT, Urassa M, Nnko S, Ng’weshemi J, Isingo R, Zaba B, Mwaluko G. Sociodemographic context of the AIDS epidemic in a rural area in Tanzania with a focus on people’s mobility and marriage. Sexually Transmitted Infections. 2002;78(Suppl 1):i97–105. doi: 10.1136/sti.78.suppl_1.i97. [DOI] [PMC free article] [PubMed] [Google Scholar]
- Bonner P. Desirable or undersirable Basotho women? Liquor, prostitution and the migration of Basotho women to the Rand, 1920–1945. In: Walker C, editor. Women and Gender in Southern Africa to 1945. Cape Town: David Phillip; 1990. [Google Scholar]
- Bozzoli B. Women of Phokeng: Consciousness, Life Strategy, and Migrancy in South Africa, 1900–1983. Portsmouth NH: Heinemann; 1991. [Google Scholar]
- Breckenridge K. The allure of violence: Men, race and masculinity on the South African goldmines, 1900–1950. Journal of Southern African Studies. 1998;24(4):669–693. [Google Scholar]
- Bwayo J, Plummer F, Omari M, Mutere A, Moses S, Ndinya-Achola J, Velentgas P, Kreiss J. Human immunodeficiency virus infection in long-distance truck drivers in east Africa. Arch Intern Med. 1994;154(12):1391–1396. [PubMed] [Google Scholar]
- Camlin CS, Hosegood V, Newell ML, McGrath N, Barnighausen T, Snow RC. Gender, migration and HIV in rural KwaZulu-Natal, South Africa. PLoS One. 2010;5(7):e11539. doi: 10.1371/journal.pone.0011539. [DOI] [PMC free article] [PubMed] [Google Scholar]
- Campbell C. Selling sex in the time of AIDS: the psycho-social context of condom use by sex workers on a Southern African mine. Soc Sci Med. 2000;50(4):479–494. doi: 10.1016/s0277-9536(99)00317-2. [DOI] [PubMed] [Google Scholar]
- Campbell C. ‘Going underground and going after women’: Masculinity and HIV transmission amongst black workers on the gold mines. In: Morrell R, editor. Changing Men in Southern Africa. New York: Zed Books; 2001. pp. 275–286. [Google Scholar]
- Casale D, Posel D. The Continued Feminisation of the Labour Force in South Africa: An Analysis of Recent Data and Trends. South African Journal of Economics. 2002;70(1):156–184. [Google Scholar]
- Case A, Ardington C. Chapter 8. Socioeconomic factors. In: Population Studies group, editor. ACDIS monograph. Mtubatuba, South Africa: Africa Centre for Health and Population Studies; 2004. [Google Scholar]
- Case A, Hosegood V, Lund F. The reach and impact of Child Support Grants: evidence from KwaZulu-Natal. Development Southern Africa. 2005;22(4):467–482. [Google Scholar]
- Chant S, Radcliffe SA. Migration and development: the importance of gender. In: Chant S, editor. Gender and Migration in Developing Countries. New York: Belhaven Press; 1992. [Google Scholar]
- Cockerton C. ‘Running away’ from ‘the land of the desert’: women’s migration from colonial Botswana to South Africa, c. 1895–1966. Queen’s University: 1995. [Google Scholar]
- Collinson M, Tollman S, Kahn K, Clark S, Garenne M. Highly prevalent circular migration: households, mobility and economic status in rural South Africa. In: Tienda M, Findley S, Tollman S, Preston-Whyte E, editors. Africa On the Move: African Migration and Urbanisation in Comparative Perspective. Johannesburg: Wits University Press; 2006. pp. 194–216. [Google Scholar]
- Collinson MA. Migration, settlement change and health in post-apartheid South Africa: Triangulating health and demographic surveillance with national census data. Scandinavian Journal of Public Health. 2007;69:77–84. doi: 10.1080/14034950701356401. [DOI] [PMC free article] [PubMed] [Google Scholar]
- Collinson MA. Age-Sex Proflies of Migration: Who ia a Migrant? In: Collinson MA, Adazu K, White M, Findley S, editors. The Dynamics of Migration, Health and Livelihoods: INDEPTH Network Perspectives. Surrey, England: Ashgate; 2009. [Google Scholar]
- Collinson MA, Gerritsen AAM, Clark SJ, Kahn K, Tollman SM. Migration and socio-economic change in rural South Africa, 2000–2007. In: Collinson MA, Adazu K, White M, Findley S, editors. The Dynamics of Migration, Health and Livelihoods: INDEPTH Network Perspectives. Surrey, England: Ashgate; 2009. [Google Scholar]
- Collinson MA, Tollman SM, Kahn K. Scandinavian Journal of Public Health. Supplement 69. 2007. Migration, settlement change and health in post-apartheid South Africa: triangulating health and demographic surveillance with national census data; pp. 77–84. [DOI] [PMC free article] [PubMed] [Google Scholar]
- Deane KD, Parkhurst JO, Johnston D. Linking migration, mobility and HIV. Tropical Medicine and International Health. 2010;15(12):1458–1463. doi: 10.1111/j.1365-3156.2010.02647.x. [DOI] [PubMed] [Google Scholar]
- Dodson B. Women on the move: Gender and cross-border migration to South Africa from Lesotho, Mozambique and Zimbabwe. In: McDonald DA, editor. On Borders: Perspectives on International Migration in Southern Africa. New York: St. Martin’s Press; 2000. pp. 119–150. [Google Scholar]
- Dodson B, Crush J. a report on gender discrimination in South Africas 2002 Immigration Act: masculinizing the migrant. Feminist Review. 2004;77:96. [Google Scholar]
- Feinstein CH. An Economic History of South Africa: Conquest, Discrimination and Development. London, United Kingdom: Cambridge University Press; 2005. [Google Scholar]
- Ford K, Hosegood V. AIDS mortality and the mobility of children in KwaZulu Natal, South Africa. Demography. 2005;42(4):757–768. doi: 10.1353/dem.2005.0029. [DOI] [PubMed] [Google Scholar]
- Health Do, Council MR, Macro O. South Africa Demographic and Health Survey 1998. Pretoria: Department of Health; 1998. [Google Scholar]
- Health Do, Council MR, Macro O. South Africa Demographic and Health Survey 2003. Pretoria: Department of Health; 2003. [Google Scholar]
- Herbst AJ, Cooke GS, Barnighausen T, KanyKany A, Tanser F, Newell ML. Adult mortality and antiretroviral treatment roll-out in rural KwaZulu-Natal, South Africa. Bulletin of the World Health Organization. 2009;87(10):754–762. doi: 10.2471/BLT.08.058982. [DOI] [PMC free article] [PubMed] [Google Scholar]
- Hope KR., Sr Mobile workers and HIV/AIDS in Botswana. AIDS Analysis Africa. 2000;10(4):6–7. [PubMed] [Google Scholar]
- Hosegood V, Floyd S, Marston M, Hill C, McGrath N, Isingo R, Crampin A, Zaba B. The effects of high HIV prevalence on orphanhood and living arrangements of children in Malawi, Tanzania, and South Africa. Population Studies. 2007;61(3):327–336. doi: 10.1080/00324720701524292. [DOI] [PMC free article] [PubMed] [Google Scholar]
- Hosegood V, McGrath N, Herbst K, Timaeus IM. The impact of adult mortality on household dissolution and migration in rural South Africa. AIDS. 2004a;18(11):1585–1590. doi: 10.1097/01.aids.0000131360.37210.92. [DOI] [PubMed] [Google Scholar]
- Hosegood V, Timaeus IM. Household Composition and Dynamics in KwaZulu-Natal, South Africa: Mirroring Social Reality in Longitudinal Data Collection (Chapter 4) In: van der Walle E, editor. African Households: An Exploration of Census Data. New York, NY: M.E. Sharpe, Inc; 2005a. pp. 58–77. [Google Scholar]
- Hosegood V, Timaeus IM. The impact of adult mortality on the living arrangements of older people in rural South Africa. Aging & Society. 2005b;25:431–444. [Google Scholar]
- Hosegood V, Vanneste AM, Timaeus IM. Levels and causes of adult mortality in rural South Africa: the impact of AIDS. AIDS. 2004b;18(4):663–671. doi: 10.1097/00002030-200403050-00011. [DOI] [PubMed] [Google Scholar]
- Hugo G. Migrant women in developing countries. In: D.o.E.a.S.I.a.P. Analysis, editor. Internal Migration of Women in Developing Countries. New York: United Nations; 1993. [Google Scholar]
- Hunter M. From migrating men to moving women? Historical patterns of women’s migration. Migration Working Group, Africa Centre for Health and Population Studies; 2004. 25 Nov. 2004. [Google Scholar]
- Hunter M. The changing political economy of sex in South Africa: the significance of unemployment and inequalities to the scale of the AIDS pandemic. Social Science & Medicine. 2007;64(3):689–700. doi: 10.1016/j.socscimed.2006.09.015. [DOI] [PubMed] [Google Scholar]
- Hunter M. Beyond the male-migrant: South Africa’s long history of health geography and the contemporary AIDS pandemic. Health & Place. 2010;16(1):25–33. doi: 10.1016/j.healthplace.2009.08.003. [DOI] [PubMed] [Google Scholar]
- Jochelson K, Mothibeli M, Leger JP. Human immunodeficiency virus and migrant labor in South Africa. International Journal of Health Services. 1991;21(1):157–173. doi: 10.2190/11UE-L88J-46HN-HR0K. [DOI] [PubMed] [Google Scholar]
- Kishamawe C, Vissers DC, Urassa M, Isingo R, Mwaluko G, Borsboom GJ, Voeten HA, Zaba B, Habbema JD, de Vlas SJ. Mobility and HIV in Tanzanian couples: both mobile persons and their partners show increased risk. AIDS. 2006;20(4):601–608. doi: 10.1097/01.aids.0000210615.83330.b2. [DOI] [PubMed] [Google Scholar]
- Kok P, Gelderblom D, Oucho JO, van Zyl J. Migration in South and Southern Africa: Dynamics and Determinants. Cape Town: Human Sciences Research Council; 2006. [Google Scholar]
- Lester RT, Gelmon L, Plummer FA. Cell phones: tightening the communication gap in resource-limited antiretroviral programmes? AIDS. 2006;20(17):2242–2244. doi: 10.1097/QAD.0b013e3280108508. [DOI] [PubMed] [Google Scholar]
- Little RJ, Rubin DB. Statistical Analysis with Missing Data. 2. New York: Wiley; 2002. [Google Scholar]
- Lovett M. “She thinks like a man”: Marriage and (de)constructing gender identity in colonial Buha, Western Tanzania, 1943–1960. Canadian Journal of African Studies. 1996;30(1):52–68. [Google Scholar]
- Lurie M, Harrison A, Wilkinson D, Karim SA. Circular migration and sexual networking in rural KwaZulu/Natal: implications for the spread of HIV and other sexually transmitted diseases. Health Transition Review. 1997;7(Supplement 3):17–27. [Google Scholar]
- Lurie MN, Williams BG, Zuma K, Mkaya-Mwamburi D, Garnett GP, Sweat MD, Gittelsohn J, Karim SS. Who infects whom? HIV-1 concordance and discordance among migrant and non-migrant couples in South Africa. AIDS. 2003;17(15):2245–2252. doi: 10.1097/00002030-200310170-00013. [DOI] [PubMed] [Google Scholar]
- Lydie N, Robinson NJ, Ferry B, Akam E, De Loenzien M, Abega S. Mobility, sexual behavior, and HIV infection in an urban population in Cameroon. Journal of Acquired Immune Deficiency Syndromes. 2004;35(1):67–74. doi: 10.1097/00126334-200401010-00010. [DOI] [PubMed] [Google Scholar]
- MacKellar D, Gallagher K, Finlayson T, Sanchez T, Lansky A, Sullivan P. Surveillance of HIV risk and prevention behaviors of men who have sex with men- A national application of venue-based, time-space sampling. Public Health Reports. 2007;122(1):39–47. doi: 10.1177/00333549071220S107. [DOI] [PMC free article] [PubMed] [Google Scholar]
- Magnani R, Sabin K, Saidel T, Heckathorn D. Review of sampling hard-to-reach populations for HIV surveillance. AIDS. 2005;19(Suppl 2):S67–S72. doi: 10.1097/01.aids.0000172879.20628.e1. [DOI] [PubMed] [Google Scholar]
- Massey DS. Patterns and Processes of International Migration in the Twenty-First Century: Lessons for South Africa. In: Tienda M, Findley S, Tollman S, Preston-Whyte E, editors. Africa on the Move: African Migration and Urbanisation in Comparative Perspective. Johannesburg: Wits University Press; 2006. [Google Scholar]
- Massey DS, Arango A, Koucouci A, Pelligrino A, Taylor JE. Worlds in Motion: Understanding International Migration at the End of the Millennium. Oxford: Oxford University Press; 1998. [Google Scholar]
- Meillassoux C. Essai d’interprétation du phénomène économique dans les sociétés d’autosubsistance. Cahiers d’Etudes Africaines. 1960;4:38–67. [Google Scholar]
- Muhwava W, Hosegood V, Nyirenda M, Herbst A, Newell M. Levels and determinants of population movements and migration in rural Kwa-Zulu Natal, South Africa. African Population Studies. 2010;24:259–280. [Google Scholar]
- Murray C. Marital strategy in Lesotho: the redistribution of migrant earnings. African Studies. 1976;35(2):99–122. [Google Scholar]
- Murray C. Migrant labour and changing family structure in the rural periphery of Southern Africa. Journal of Southern African Studies. 1980;6(2):139–156. [Google Scholar]
- Nunn AJ, Wagner HU, Kamali A, Kengeya-Kayondo JF, Mulder DW. Migration and HIV-1 seroprevalence in a rural Ugandan population. AIDS. 1995;9(5):503–506. [PubMed] [Google Scholar]
- Osterhammel J. Colonialism: A Theoretical Overview. Princeton, N.J.: Markeu Wiener Publishers; 1997. [Google Scholar]
- Pedraza S. Women and migration: The social consequences of gender. Annual Review of Sociology. 1991;17:303–325. doi: 10.1146/annurev.so.17.080191.001511. [DOI] [PubMed] [Google Scholar]
- Pison G, Le Guenno B, Lagarde E, Enel C, Seck C. Seasonal migration: a risk factor for HIV infection in rural Senegal. Journal of Acquired Immune Deficiency Syndromes. 1993;6(2):196–200. [PubMed] [Google Scholar]
- Posel D. Intra-family Transfers and Income-Pooling: A Study of Remittances in Kwazulu-Natal. South African Journal of Economics. 2001;69(3):501–528. [Google Scholar]
- Posel D. Moving on: Patterns of Labour Migration in Post-Apartheid South Africa. In: Tienda M, Findley S, Tollman S, Preston-Whyte E, editors. Africa on the Move: African Migration and Urbanisation in Comparative Perspective. Johannesburg: Wits University Press; 2006. [Google Scholar]
- Posel D, Casale D. What has been happening to internal labour migration in South Africa, 1993–1999? The South African Journal of Economics. 2003;71(3):455–479. [Google Scholar]
- Potts D. Shall we go home? Increasing urban poverty in African cities and migration processes. Geographical Journal. 1995;161:245–264. [Google Scholar]
- Potts D. Counter-urbanisation on the Zambian copperbelt? interpretations and implications. Urban Studies. 2005;42(4):583–609. [Google Scholar]
- Powers DA, Xie Y. Statistical Methods for Categorical Data Analysis. New York: Academic Press; 2000. [Google Scholar]
- Preston-Whyte E, Sibisi H. Ethnographic oddity or ecological sense? Nyuswa-Zulu descent groups and land allocation. African Studies. 1975;34(4):283–316. [Google Scholar]
- Preston-Whyte EM. Families Without Marriage. In: Argyle WJ, Preston-Whyte EM, editors. Social System and Tradition in Southern Africa. Capetown: Oxford University Press; 1978. pp. 55–83. [Google Scholar]
- Reed HE, Andrzejewski CS, White MJ. Men’s and women’s migration in coastal Ghana: An event history analysis. Demographic Research. 2010;22:771–812. doi: 10.4054/DemRes.2010.22.25. [DOI] [PMC free article] [PubMed] [Google Scholar]
- Smith DJ. Modern marriage, men’s extramarital sex, and HIV risk in southeastern Nigeria. American Journal of Public Health. 2007;97(6):997–1005. doi: 10.2105/AJPH.2006.088583. [DOI] [PMC free article] [PubMed] [Google Scholar]
- Spiegel A. Changing patterns of migrant labour and rural differentiation in Lesotho. Social Dynamics. 1981;6(2):1–13. [Google Scholar]
- Spiegel A. Polgyny as myth: Towards understanding extramarital relations in Lesotho. African Studies. 1991;50(1):145–166. doi: 10.1080/00020189108707739. [DOI] [PubMed] [Google Scholar]
- Stark O. The Migration of Labour. Cambridge: Basil Blackwell; 1991. [Google Scholar]
- Stueve A, O’Donnell LN, Duran R, San Doval A, Blome J. Time-Space sampling in minority communities: Results with young latino men who have sex with men. American Journal of Public Health. 2001;91(6):922–926. doi: 10.2105/ajph.91.6.922. [DOI] [PMC free article] [PubMed] [Google Scholar]
- Tanser F, Hosegood V, Barnighausen T, Herbst K, Nyirenda M, Muhwava W, Newell C, Viljoen J, Mutevedzi T, Newell ML. Cohort Profile: Africa Centre Demographic Information System (ACDIS) and population-based HIV survey. International Journal of Epidemiology. 2008;37(5):956–962. doi: 10.1093/ije/dym211. [DOI] [PMC free article] [PubMed] [Google Scholar]
- Tienda M, Booth K. Gender, Migration and Social-Change. International Sociology. 1991;6(1):51–72. doi: 10.1177/026858091006001004. [DOI] [PubMed] [Google Scholar]
- Todes A. Gender, place, migration and regional policy in South Africa. In: Larsson A, Mapetla M, Schlyter A, editors. Changing Gender Relations in Southern Africa: Issues of Urban Life. Lesotho: The Institute of Southern African Studies and the National University of Lesotho; 1998. pp. 309–330. [Google Scholar]
- Udjo E. Marital patterns and fertility in South Africa: The evidence from the 1996 Population Census; Presented at XXIVth IUSSP International Population Conference; August 18–24; Salvador de Bahia. 2001. [Google Scholar]
- van der Berg S, Burger R, Leibbrandt M, Mlatsheni C. Migration and the changing rural-urban interface in South Africa: What can we learn from census and survey data?; Presented at Labour Markets and Poverty in South Africa; 22–24 October; Johannesburg, South Africa. 2002. [Google Scholar]
- van Onselen C. Studies in the social and economic history of the Witwatersrand 1886–1914. New York: Longman, Inc; 1982. [Google Scholar]
- Walker C. Gender and the development of the migrant labour system c. 1850–1930. In: Walker C, editor. Women and Gender in Southern Africa to 1945. Cape Twon: David Phillip; 1990. [Google Scholar]
- Welaga P, Hosegood V, Weiner R, Hill C, Herbst K, Newell ML. Coming home to die? The association between migration and mortality in rural South Africa. BMC Public Health. 2009;9:193. doi: 10.1186/1471-2458-9-193. [DOI] [PMC free article] [PubMed] [Google Scholar]
- Welz T, Hosegood V, Jaffar S, Batzing-Feigenbaum J, Herbst K, Newell ML. Continued very high prevalence of HIV infection in rural KwaZulu-Natal, South Africa: a population-based longitudinal study. AIDS. 2007;21(11):1467–1472. doi: 10.1097/QAD.0b013e3280ef6af2. [DOI] [PubMed] [Google Scholar]
- Wentzel M, Viljoen J, Kok P. Contemporary South African migration patterns and intentions. In: Kok P, Gelderblom D, Oucho JO, van Zyl J, editors. Migration in South and Southern Africa: Dynamics and Determinants. Cape Town: Human Sciences Research Council; 2006. [Google Scholar]
- Wilkinson RC. Migration in Lesotho: Some comparative aspects, with particular reference to the role of women. Geography. 1983;68:208–224. [Google Scholar]
- Williams B, Campbell C. Mines, migrancy and HIV in South Africa--managing the epidemic. S Afr Med J. 1996;86(10):1249–1251. [PubMed] [Google Scholar]
- Zlotnick H. The Global Dimensions of Female Migration. In: Kalia K, editor. Migration Information Source. Washington, D.C.: Migration Policy Institute; 2003. [Google Scholar]
- Zuma K, Gouws E, Williams B, Lurie M. Risk factors for HIV infection among women in Carletonville, South Africa: migration, demography and sexually transmitted diseases. International Journal of STD & AIDS. 2003;14(12):814–817. doi: 10.1258/095646203322556147. [DOI] [PubMed] [Google Scholar]