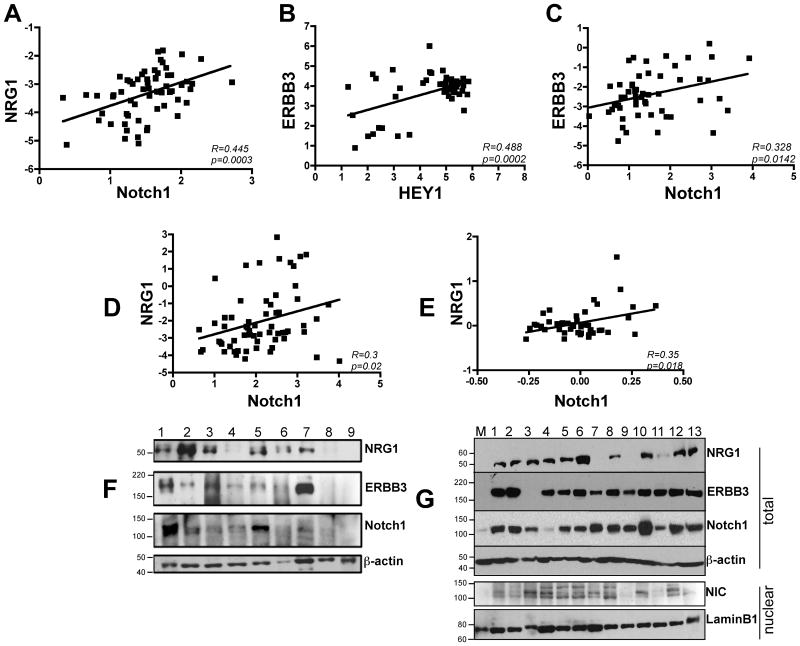
Figure 1. Notch and NRG1 signaling components correlate in melanoma.
Correlation analysis of NRG1 and Notch1 (A); ERBB3 and HEY1 (B); and ERBB3 and Notch1 (C) of publicly available data sets of human melanoma samples. Data in A and B show a significant correlation between NRG1-Notch1 (R=0.445, p=0.0003) and ERBB3-HEY1 (R=0.488, p=0.0002) among both preneoplastic lesions (nevi, n=18) and primary melanomas (n=45) (Talantov et al (28)). Data in C show a significant correlation between ERBB3 and Notch1 (R=0.328, p=0.0142) in both primary (n=16) and metastatic melanomas (n=40) (Riker et al (29)). D-E) A significant correlation between NRG1 and Notch1 is observed in human melanoma cell lines (D, n=63, R=0.3, p=0.02 (30); E, n=45, R=0.35, p=0.018 (31). F) Western blot analysis of NRG1, ERBB3 and Notch1-TM in nine human metastatic melanoma samples. G) Upper panel: western blot analysis of NRG1, ERBB3 and Notch1-TM expression in thirteen melanoma cell lines compared with normal melanocytes (M). The melanocytes used are a mixed population of cells derived from at least five different foreskins. The bottom panel shows Notch1-NIC expression in nuclear lysates. β-actin or lamin-B1 were used a loading controls for either total or nuclear protein lysates.

