

Abstract
Systematic investigations of the upper forest line (UFL) primarily concentrate on mid and high latitudes of the Northern Hemisphere, whereas studies of Neotropical UFLs are still fragmentary. This article outlines the extraordinary high tree diversity at the UFL within the Andean Depression and unravels the links between the comparatively low position of the local UFL, high tree-species diversity, and climate. On the basis of Gentry′s rapid inventory methodology for the tropics, vegetation sampling was conducted at 12 UFL sites, and local climate (temperature, wind, precipitation, and soil moisture) was investigated at six sites. Monotypic forests dominated by Polylepis were only found at the higher located margins of the Andean Depression while the lower situated core areas were characterized by a species-rich forest, which lacked the elsewhere dominant tree-species Polylepis. In total, a remarkably high tree-species number of 255 tree species of 40 different plant families was found. Beta-diversity was also high with more than two complete species turnovers. A non-linear relationship between the floristic similarity of the investigated study sites and elevation was detected. Temperatures at the investigated study sites clearly exceeded 5.5°C, the postulated threshold value for the upper tree growth limit in the tropics. Instead, quasi-permanent trade winds, high precipitation amounts, and high soil water contents affect the local position of the UFL in a negative way. Interestingly, most of the above-mentioned factors are also contributing to the high species richness. The result is a combination of a clearly marked upper forest line depression combined with an extraordinary forest line complexity, which was an almost unknown paradox.
Keywords: Andean Depression, Andes, climate, forest structure, plant diversity, tree diversity, upper forest line
Introduction
Systematic investigations of the upper forest line (UFL) mainly concentrate on mid and high latitudes of the Northern Hemisphere, whereas studies of tropical UFLs are still fragmentary (e.g., Walter and Medina 1969; Ellenberg 1979; Miehe and Miehe 1996; Kessler and Hohnwald 1998; Körner 1998, 2007; Lauer et al. 2001a; Holtmeier 2003; Bader and Ruijten 2008). Along the north–south stretching tropical Andes, the factors that determine its altitudinal position are not well understood and little information is available about tree diversity and species distribution at the UFL. Since at least 7000 years, Andean landscapes have been modified by humans, and the poignancy of land use has grown during the past fifty years (Jokisch and Lair 2002; Sarmiento and Frolich 2002; Peters et al. 2010; Rodriguez et al. 2013). Although climate change is intensely debated as a cause of future species extinctions at UFLs, human land use is currently the most important threat to biodiversity in the tropics (Pimm and Raven 2000; Sala et al. 2000; Köster et al. 2009). As early as 1958, Ellenberg claimed isolated and insular Polylepis woodlands of the high Andean mountain areas to be relics of a former closed forest zone, which has been destroyed by anthropogenic fires and extensive pasture management (Ellenberg 1979). Several studies (e.g., Walter and Medina 1969; Miehe and Miehe 1996; Kessler and Hohnwald 1998; Körner 1998, 2007; Lauer et al. 2001b; Körner and Paulsen 2004) show that temperature is the most important natural factor for limiting tree growth. Körner (1998, 2007) and Körner and Paulsen (2004) demonstrate that soil temperatures >5.5°C (measured close to the rhizosphere 10 cm below ground surface) are essential for tree growth at the UFL ecotones in the tropics. On a local scale, further climate elements (e.g., wind, precipitation, soil moisture) and environmental factors such as relief form, different types of slope processes, and the occurrence of fires affect the position of the natural UFL as well (Holtmeier 2003; Tinner and Theurillat 2003; Holtmeier and Broll 2005; Bader et al. 2007a,b2007b; Treml and Banaš 2008).
Within the Andean chain, the relatively low-lying regions of the so-called Andean Depression located between northern Peru and southern Ecuador are of special interest since this area forms an important migration corridor for tree species of different plant geographical areas during the recent climate history (Richter et al. 2009). Studying tree-species diversity and climate at the UFL of the Andean Depression is central to understand tree-species distribution and forest structure patterns within this important transition zone between the central and northern Andes. The objectives of this study are to: (1) record the exceptionally high tree-species diversity at the UFL within the Andean Depression, (2) document changes in species composition, forest structure, and location of the local UFLs, and (3) unravel the links between the position of the UFL, tree-species diversity, and climate within the study area.
Materials and Methods
Study region
The study was carried out between El Cajas in southern Ecuador and Llanganuco in northern Peru (Fig. 1, Table 1). Except for El Cajas and Llanganuco, the investigated areas are part of the “Andean Depression” (also known as Depression of Huancabamba) which separates the central Andes from the northern Andes. This mountain section, where the highest peaks barely reach 4000 m a.s.l., stretches about 500 km north–south between the Girón-Paute drainage basin around Cuenca in southern Ecuador and the Rio Chicama-Rio Huallaga intersection around Cajamarca in northern Peru (Weigend 2002, 2004). Within the Andean Depression, the UFL is situated lower than in the northern and southern Andes. Here, the Ecuadorian Andes includes one of the world′s five hotspots of vascular plant diversity, where approximately half of the estimated 20,000 Ecuadorian vascular plant species occur (Balslev 1988; Jorgensen and León-Yánez 1999; Barthlott et al. 2007). The region's climate is dominated by the tropical trade wind system. Especially, high-elevation crest lines and adjacent upper forest line ecotones are affected by strong easterlies over 70% of the year. Maximum amounts of rainfall are measured at the eastern slopes of the Andean chain, where the predominant easterlies are lifted by forced convection (e.g., >6000 mm year−1 in several windward locations of the Andean Depression; Emck 2007). The specific study sites are located in the “tierra fria” (mean annual temperature ≈ 9–10°C at 3000 m a.s.l.) and “tierra subhelada” (mean annual temperature ≈ 6–7° C at 3500 m a.s.l.; Richter 2003) altitudinal belts. The topography of the central Andean Depression is structured by deep ravines, steep slopes, and narrow ridge tops (Richter et al. 2009).
Figure 1.
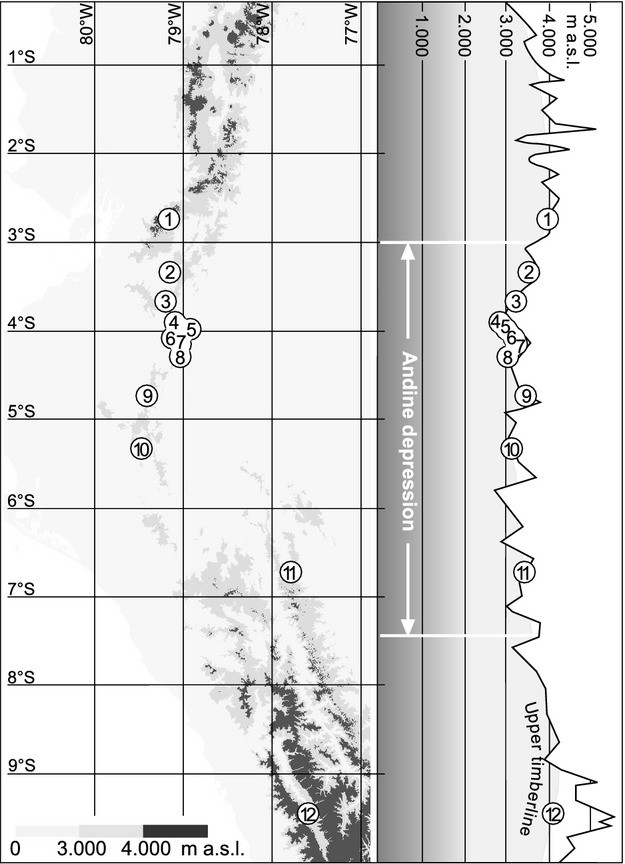
Location of the twelve investigated UFL study sites. Map based on the 2012 (SRTM) dataset 2012. For detailed information, refer to Table 1.
Table 1.
Site details for the 12 investigated UFL locations in southern Ecuador and northern Peru
| No. | Study site (abbr.) | Coordinates | Mean altitude (m a.s.l.) | Climate measurement period |
|---|---|---|---|---|
| 1 | El Cajas (EC) | 2°46′ S; 79°12′ W | ∼3900 | |
| 2 | Fierro Urco (FU) | 3°43′ S; 79°19′ W | ∼3530 | 22.05.2007–19.02.2008 |
| 3 | Saraguro (Sa) | 3°40′ S; 79°14′ W | ∼3270 | 22.05.2007–19.02.2008 |
| 4 | El Tiro (ET) | 3°58′ S; 79°8′ W | ∼2800 | 01.01.2005–28.02.2008 |
| 5 | Cerro del Consuelo (CC) | 3°59′ S; 79°3′ W | ∼2890 | 01.01.2005–28.02.2008 |
| 6 | Cajanuma (Ca) | 4°7′ S; 79°9′ W | ∼3240 | 01.01.2005–28.02.2008 |
| 7 | Rabadilla de Vaca (Ra) | 4°15′ S; 79°7′ W | ∼3250 | |
| 8 | Cerro Toledo (CT) | 4°22′ S; 79°6′ W | ∼3130 | |
| 9 | Amaluza (Am) | 4°44′ S; 79°25′ W | ∼3530 | 30.04.2006–04.03.2007 |
| 10 | Huancabamba (Hu) | 5°20′ S; 79°32′ W | ∼3190 | |
| 11 | Barro Negro (BN) | 6°42′ S; 77°54′ W | ∼3550 | |
| 12 | Llanganuco (Ll) | 9°3′ S; 77°35′ W | ∼4.250 |
Vegetation sampling
The selection of twelve UFL sites (Fig. 1, Table 1) was based on topographic maps (map scale 1:50,000) and aerial photographs of the “Instituto Geográfico Militar” of Ecuador. Based on Gentry′s rapid inventory methodology for the tropics (Gentry 1982, 1988), eight transects à 50 m × 2 m were selected at each study site and trees with a stem diameter >5 cm at 30 cm above ground level were identified. Due to the sometimes restricted size of forest areas and the complex topography of the region, Gentry′s method was modified by taking an irregular layout of the 2 × 50 m transects (transects parallel to equal altitude and without splitting the lines) and by investigating only eight instead of 10 plots at each study site. Collected specimens were identified in the herbaria of the Universities of Loja (Universidad Nacional), Cuenca (Universidad del Azuay), and Quito (Universidad Católica).
Statistical analysis of vegetation data
In a first step, we used cluster analyses to compare the floristic composition of the different sampling plots. Secondly, detrended correspondence analysis was applied to identify relationships between species composition and environmental factors such as temperature, wind speed, precipitation, elevation, slope, aspect, latitude, and longitude. Thirdly, ordinations and modeling techniques were coupled to link the community patterns to environmental predictors (Muenchow et al. 2013a,b2013b). An initial linear model, trying to fit the scores of the first DCA-axis, revealed spatial autocorrelation, since the transects of each location were more similar to one another as to those from other locations. Therefore, we used a linear mixed-effects model in which location was treated as random intercept. A random intercept model allows for correlation within a class (here location), thus accounting for the observed spatial autocorrelation (Zuur et al. 2009). Moreover, to model the non-linear relationship between the first DCA-axis and elevation, elevation was subjected to an orthogonal polynomial function of the third order. Following a hypothesis-testing modeling selection procedure, we had to dismiss all further topographical predictors one at a time in accordance with an F- test (P value > 0.05). Further model inspection revealed no violations of model assumptions (normality, heterogeneity, independence). As a measure of fit, we used the coefficient of determination between the fitted values and the response. The intraclass correlation (correlation between the transects from the same location) was computed as the ratio of the variance of the random effects and the sum of the variance and the squared residuals of the random effects (Zuur et al. 2009). Additionally, we used species accumulation curves to decide whether our sampling approach provided a representative sample of the expected forest line tree species within our study area. We used the algorithm recommended by Oksanen (2013). It was developed independently by various authors (Ugland et al. 2003; Colwell et al. 2004; Kindt et al. 2006). For the statistical modeling and species accumulation curves, we used the open-source software R (R Development Core Team 2014) and its packages lattice (Sarkar 2008) lme4 (Bates et al. 2014) and vegan (Oksanen et al. 2014).
Climate measurements
Local climate was recorded at six of the UFL sites (Table 1) by installing nine full automatic climate stations (manufactured by THIES Clima Germany or Hobo Onset USA) inside and outside of local forest stands (Peters 2009). Each climate variable was recorded in 10 minute intervals, and hourly arithmetic means (for wind direction vectorial mean) were stored by data loggers. At all sites, air temperatures were taken 2 m above ground level and soil temperatures at 10 cm ground depth. Wind velocities and directions were measured 2.5 m above ground. Wind as a decisive force for the position of the UFL was investigated in detail at Cajanuma Páramo, where wind direction and wind speed were studied at four sites at the crest line and at the lee side of the Cordillera de San Francisco. Precipitation and soil moisture were analyzed at Cajanuma in and outside local forest stands.
Results
Tree diversity and distribution
Syntaxonomical tree studies at the UFL of the Andean Depression show remarkably high tree-species numbers (Fig. 2A). In total, 255 tree species (including 94 morpho species) of 40 different plant families were identified within 96 transects (e.g., a total area of only 9600 m2). Beta-diversity was high with more than two complete species turnovers (length of the first DCA-axis: 8.73). Using species accumulation curves (graph not shown), we found the expected number of species for the visited UFLs. The calculated species richness is 253.8 (Standard deviation: SD = 1.4), what means that the number of the tree species of the visited sites (255 tree species) matches almost entirely the expected mean diversity. Melastomataceae (45 spp.), Asteraceae (31 spp.), Araliaceae (15 spp.), and Cunoniaceae (15 spp.) are the most species-rich families, while Melastomataceae and Rosaceae are the most common, with 18% and 13% of all tree individuals, respectively. The highest quantity of 66 tree species per 800 m2 was sampled in the strongly anthropogenically affected study area of Saraguro, where forest stands are dominated up to 66% (Fig. 2A and B) by trees showing stem diameters of only 5–10 cm. Species richness and evenness are maximal in Saraguro, whereas the lowest species numbers were collected in El Cajas and Llanganuco, outside of the Andean Depression. We suggest that this low diversity is the consequence of the comparatively high altitude of the two study sites and the dominance of Polylepis incana, P. sericea, P. reticulata, and P. weberbauerii (Rosaceae) representing more than 60% of tree individuals at these sites. Within the Andean Depression species numbers and evenness values are clearly increased, varying from 0.8 to 0.9. One exception is the site Cajanuma, where a high proportion of trees with stem diameters of >25 cm induces a smaller number of tree individuals and thus of tree species. Statistical analyses on the species level reveal a conspicuous floristical division of the investigated study sites into four groups (I–IV, Fig. 3). Group I contains the working areas of El Cajas, Amaluza, Fierro Urco, and Huancabamba which are characterized by the indicator species Polylepis reticulata (P < 0.018), P. weberbaueri (P < 0.007; both Rosacea), Myrsine dependens (P < 0.002; Myrsinaceae), Diplostephium glandulosum (P < 0.049; Asteraceae), Clethra ferruginea (P < 0.048; Clethraceae), and Miconia bracteolata (P < 0.008; Miconiaceae) (Fig. 4). Polylepis reticulata and P. weberbaueri are very common within the higher situated UFLs of the north and central Andes, and numerous populations have been described for the higher regions of Ecuador and Peru (up to 4500 m a.s.l.; Jorgensen and León-Yánez 1999; Missouri Botanical Garden 2013). This holds also true for Myrsine dependens, Diplostephium glandulosum, and Miconia bracteolata which were found at altitudes up to 4500 m a.sl. (Jorgensen and León-Yánez 1999; Missouri Botanical Garden 2013). Group II consists of the eight transects at the Llanganuco study site. This group is distinguished by the occurrence of Polylepis sericea (P < 0.001), P. weberbaueri (both Rosaceae), and Gynoxis caracensis (P < 0.001; Asteraceae), representing characteristic tree species of the higher located ULFs of the Andes (Fig. 4, Baumann 1988). Group III contains the two lowest situated study areas El Tiro and Cerro del Consuelo. Both are floristically clearly different from the remaining areas (Fig. 3; threshold level 1). This is mainly due to the presence of Podocarpus oleifolius (P < 0.001; Podocarpaceae) and Clusia ducoides (P < 0.012; Clusiaceae) (Fig. 4). Both species are very common in the lower humid areas of the Neotropics, and distribution areas are described for Ecuador up to 3200 m a.s.l. (Smith et al. 2004; Missouri Botanical Garden 2013). Group IV is comprised of the remaining middle elevation study sites (Fig. 3). These relevés are characterized by the occurrence of Weinmannia rollottii (P < 0.001; Cunoniaceae), Miconia jahnii (P < 0.006; Melastomataceae), and Hedyosmum cumbalense (P < 0.004; Chloranthaceae) (Fig. 4). While the first two species were described for Ecuador up to 3500 m a.s.l., Hedyosmum cumbalense was found at even higher altitudes up to 4500 m a.s.l. (Missouri Botanical Garden 2013). There is a non-linear relationship between the scores of the first DCA-axis and elevation. Furthermore, transects of the same location show spatial autocorrelation. Our linear mixed-effects modeling approach in combination with a polynomial function provided the solutions to both challenges. The R2 between the fitted values and the response is 96%. The intraclass correlation is 0.92. As shown by Fig. 5, the scores of the first DCA-axis also show a strong correlation with decreasing amounts of wind speed, precipitation, and alpha diversity and no interrelations with slope, longitude, latitude, and aspect. Unfortunately, the same available topographic and climatic predictors show no significant relationship with the second DCA-axis. Concerning the distribution patterns of the 45 most frequent tree species, the major part has been found in this section of the Andes before (see bars Fig. 6). Only a few tree species (e.g., Graffenrieda harlingii, Oreopanax sessiliflorus, and Weinmania loxense) are restricted to the Andean Depression and have to be considered as endemic to the region. According to our study, the known distribution limits for some species (e.g., Brachyotum ledifolium, Gynoxis cuicochensis, Ilex andicola, Miconia cladonia, Oreopanax andreanus, Polylepis lanuginose, P. reticulata, Weinmannia rollottii, W. elliptica) must be expanded toward the south. None of the presented tree species was sampled within all investigated study sites, and most species show very heterogeneous distribution patterns (Fig. 6).
Figure 2.
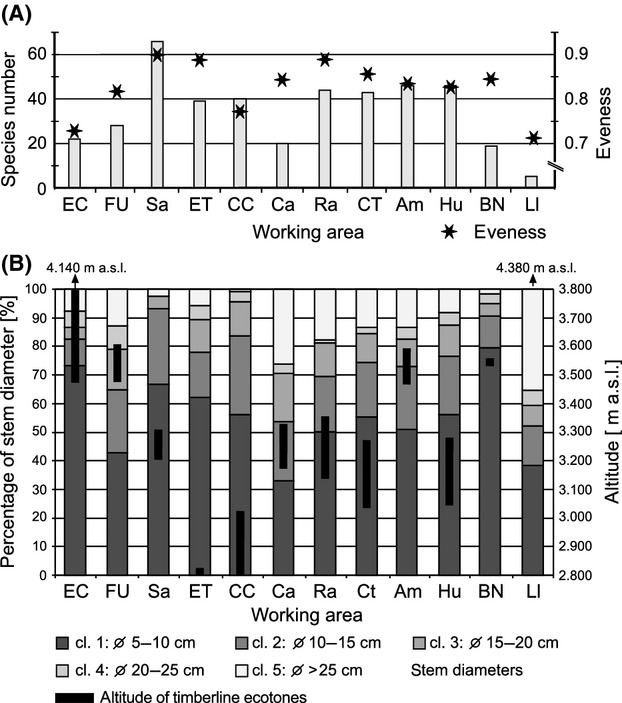
(A) Numbers of tree species and evenness values per study site and (B) classified stem diameters and altitudes of the local UFLs. For site codes, refer to Table 1.
Figure 3.

Classification of the sampled vegetation transects, showing the degree of dissimilarity in tree-species composition.
Figure 4.
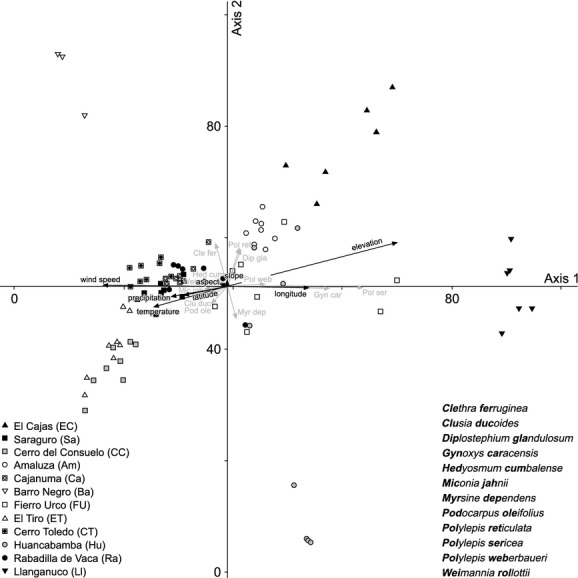
Detrended correspondence analysis (DCA) showing the floristic similarity of the investigated study sites. The most important indicator species as well as side factors were shown by gray and black arrows, respectively. Total variance 15.01; axis 1 eigenvalue = 0.87 (gradient length 4.344); axis 2 eigenvalue = 0.70 (gradient length 6.553).
Figure 5.
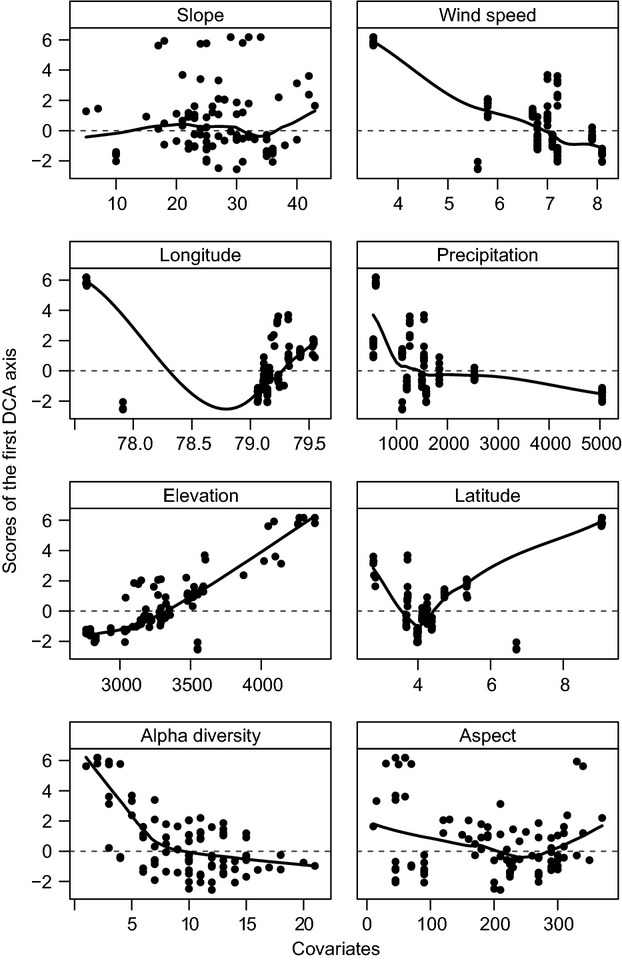
Scatter plot of available covariates versus the scores of the first DCA-axis. A line smoother was added to aid visual inspection. Units of the variables: scores of the first DCA-axis in SDs; aspect, latitude, longitude, and slope in °; elevation in m a.s.l.; precipitation in mm; wind speed in ms−1.
Figure 6.

Distribution areas of the 45 most frequent tree species of the investigated UFLs. The bars show the distribution of the species as listed by Missouri Botanical Garden (2013).
Climate
Temperature
Average annual air temperatures at the UFL sites range from 5.6°C at Amaluza to 9.6°C at Cerro del Consuelo. Soil temperatures are even higher, ranging between 8.9°C at Amaluza to 11.4°C at Cerro del Consuelo. Temperature variations (expressed by standard deviation SD) are highest at Cerro del Consuelo for soil temperatures (SD 2.3) and at Saraguro and Amaluza for air temperatures (SD 1.9) (Table 2). Differences between soil and air temperatures were generally larger at the higher study sites. Diurnal air temperature amplitudes are largest at the sites of Fierro Urco, Cajanuma Páramo, and Amaluza, varying from 3.2–5.1 K. In comparison, soil temperature amplitudes only vary between 0.7 K at Amaluza to 2.1 K at Cajanuma Páramo and Fierro Urco. Absolute minimum temperatures of 0.8°C were measured at Cajanuma Páramo and Fierro Urco. Mean daily temperatures below 5.5°C, which corresponds to the postulated upper threshold for tree growth in the tropics (Körner and Paulsen 2004; Körner 2007), are reflected in low frequencies. Only at Amaluza and Fierro Urco, frequencies of 59.35% and 32.78% hint to a limitation of tree growth possibly driven by temperature. Both, air as well as soil temperatures vary during the year, since seasonal minimum temperatures come along with a perhumid period between May and August.
Table 2.
Comparison of air (+2 m) and soil temperatures (−10 cm) at five UFLs
| Area Recording period | Type of data | Tmean (SD) (°C) | Tmin (°C) | Tmax (°C) | Mean daily amplitude (K) | Percentage of T ≤ 5.5°C |
|---|---|---|---|---|---|---|
| Fierro Urco 23.5.07–18.2.08 | Tair (+2 m) | 6.4 (1.7) | 1.6 | 13.7 | 3.7 | 32.78 |
| Tsoil (−10 cm) | 9.1 (2.0) | 4.4 | 15.6 | 2.1 | 0.94 | |
| Saraguro 23.5.07–18.2.08 | Tair (+2 m) | 7.4 (1.9) | 5.9 | 16.7 | 2.4 | 0 |
| Tsoil (−10 cm) | 11.3 (1.7) | 2.9 | 14.9 | 3.7 | 9.73 | |
| Cajanuma Páramo 1.1.98–17.9.06 | Tair (+2 m) | 6.8 (1.7) | 0.8 | 18.6 | 3.2 | 18.6 |
| Tsoil (−10 cm) | 10.5 (1.6) | 3.8 | 19.4 | 2.1 | 0.18 | |
| Cerro de Consuelo 1.1.98–17.9.06 | Tair (+2 m) | 9.6 (1.6) | 3.7 | 20.9 | 2.9 | 0.13 |
| Tsoil (−10 cm) | 11.4 (2.3) | 4.2 | 23.2 | 4.2 | 0.03 | |
| Amaluza 7.10.06–3.3.07 | Tair (+2 m) | 5.6 (1.9) | 0.8 | 16.3 | 5.1 | 59.35 |
| Tsoil (−10 cm) | 8.9 (0.9) | 5 | 10.6 | 0.7 | 0.76 |
Wind
Mean wind speed ranges between 7.1 ms−1 at El Tiro and Cajanuma Páramo to 2.4 ms−1 at Amaluza. Maximum wind speeds were recorded at Cajanuma Páramo (24.0 ms−1) and El Tiro (20.5 ms−1) where winds show an impressive directional perseverance driven by easterlies (Table 3). Storms (>16.9 ms−1) occur all over the year with highest frequencies of 2.25% at the study site of Cajanuma. Comparatively, calms are rare, showing values from 2.11% at Amaluza to 0% at Cajanuma Páramo. Wind as an important force for determining the local position of the UFL was investigated in detail at Cajanuma Páramo (Fig. 7). Mean wind speeds are highest on the crest itself (average wind speed 7.1 ms−1 at 3400 m a.s.l.). Only 150 m beyond the ridge, at Cajanuma forest line in 3235 m a.s.l., mean wind velocity is reduced to 4.1 ms−1) and even to 2.0 ms−1 within the forest at Cajanuma (1 m above the closed forest canopy at 3215 m a.s.l.). Lowest average wind speeds of only 0.5 ms−1 occur within Cajanuma forest 1 m below closed forest canopy. The easterlies dominating at the crest line are strongly dampened at the lee side. Here, wind fields are more balanced showing slight tendencies toward a mountain-valley wind system.
Table 3.
Wind velocities and averaged wind directions at five UFLs
| Area Recording period | Wind speed mean (m s−1) | Wind speed max (m s−1) | Easterlies (%) | Storms (%) | Calms (%) |
|---|---|---|---|---|---|
| Fierro Urco 22.5.07–19.2.08 | 6.3 | 13.7 | n.a. | 0.00 | 0.03 |
| El Tiro 17.11.05–17.12.06 | 7.1 | 20.5 | 78.16 | 1.41 | 0.04 |
| Cajanuma Páramo 19.10.05–19.1.07 | 7.1 | 24.0 | 64.69 | 2.25 | 0.00 |
| Cerro de Consuelo 19.10.05–17.9.06 | 5.7 | 15.9 | 79.34 | 0.00 | 0.34 |
| Amaluza 30.4.06–4.3.07 | 2.4 | 16.2 | 31.93 | 0.05 | 2.11 |
Figure 7.
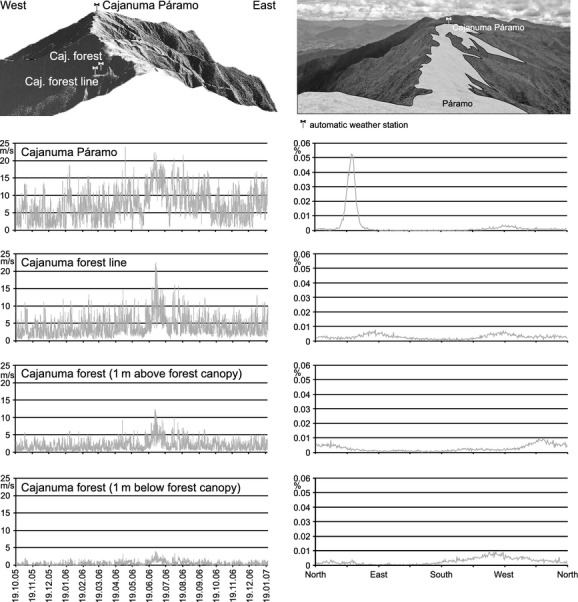
Wind speeds (left panel) and wind directions (right panel) inside and outside of local forest stands at Cajanuma. Photo: Peters 2013.
Precipitation and soil moisture
Rainfall observations along the Andes of southern Ecuador and northern Peru present extraordinary high amounts of rainfall at the northern part of the Andean Depression (Killeen et al. 2007; Peters 2009). Here, more than 6000 mma−1 are registered at Lagunas Compadres close to Cajanuma (Emck 2007). The resulting high soil moisture levels at Cajanuma indicate significantly different soil water contents between local forest stands and open páramo sites (Fig. 8). Soils of the open grass and scrubland develop on solid rocky layers, which cause long-lasting water stagnation, causing considerably higher soil moisture content than in the coarse porous debris layer beyond the forests. However, thick isolating organic layers in elfin forests guarantee that these soils never dry up completely. Elfin forests create their own water regime by a thick organic stratum that conserves moisture also during rarely occurring events of several weeks lasting dry periods during “Veranillo del Niño” from October to November, e.g., given during the second half of November 2005.
Figure 8.
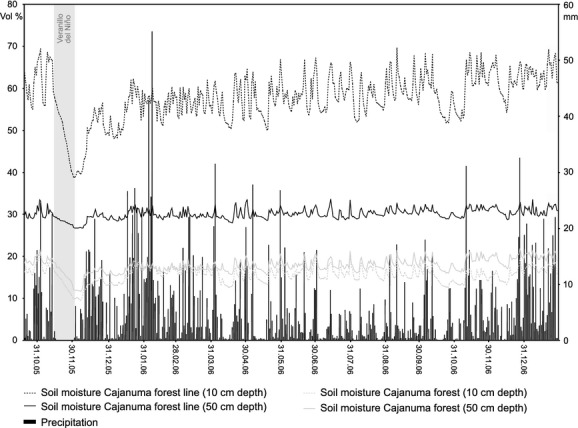
Daily precipitation amounts and soil moisture contents inside and outside of local forest stands at Cajanuma.
Discussion
Polylepis sometimes joined by Gynoxis is the most important indicator tree species of the higher situated UFLs outside of the Andean Depression. This is best demonstrated by comparing two UFL sites from northern Ecuador (Páramo de Papallacta) and central Peru (Cordillera Blanca). At Papallacta, the UFL is situated between 3700 m and 4700 m a.sl. and Polylepis pauta, P. incana, Gynoxis buxifolia, G. acostea, and Escallonia myrtilloides are the prevailing tree species (Lauer et al. 2001b, 2003). South of the Andean Depression, the UFL of the Cordillera Blanca is located at almost the same altitude between 3800 m to 4550 m a.s.l. Here, Polylepis weberbauerii, P. sericea, Gynoxis caracensis, and Buddleja usush are dominant (Kull 1991). At the study sites within the Andean Depression, monotypic forests dominated by Polylepis were only found at El Cajas, Fierro Urco, Huancabamba, Barro Negro, and Llanganuco, all located at the margins of the Andean Depression. In contrast, the core areas are characterized by a species-rich forest, which lacks the elsewhere dominant UFL genus Polylepis. Strong winds and high precipitation amounts are considered to be the most important reasons for the lack of Polylepis in the northern section of the Andean Depression, because the genus tends to avoid perhumid regions (Kessler 1995; Richter and Moreira-Munoz 2005; Brunschön and Behling 2010). One of the most surprising results is the high number of 255 tree species (including 94 morpho species) of 40 different plant families at the UFLs of the study area. On global scale, high species numbers result from diversity triggers such as the so-called “Rapoport′s rule” (Willig et al. 2003) and the effective evolutionary time since the mid-tertiary (Rohde 1992; Beck and Richter 2008). On regional scale, the northern Andes form an important interface between the Tumbes-Chocó-Magdalena hotspot in the west and the Amazonian lowlands in the east (Richter et al. 2009). On a local scale, the tropical section of the Andean mountain chain is characterized by various taxa of constrictive range. Here, harsh climatic conditions (e.g., high wind speeds and precipitation amounts) as well as a complex topography cause a manifold pattern of tree species. Besides natural factors, also anthropogenic disturbances have to be considered as triggers for the area′s outstanding plant diversity. Especially at the ULFs in the vicinity of Saraguro, including Cerro Toledo, Amaluza, and Huancabamba, human influence is clearly visible. Here, the UFL is composed of small forest patches and the forest-páramo border is always sharp. A relatively high amount of trees showing a stem diameter of < 15 cm induces a higher number of tree individuals and thus of tree species. These forests resemble secondary stands, including many treelets of “pioneer” character with softwood and large hydromorphous leaves. Soil temperatures as well as mean air temperatures at these UFLs clearly exceed 5.5°C, the postulated threshold value for the upper tree growth limit in the tropics (Körner 1998, 2007; Körner and Paulsen 2004). Consequently, temperature cannot be considered as the main cause for the low position of the local UFL ecotone. Having regard to the floristic similarity of the investigated study sites, elevation almost completely explained the first DCA-axis of the presented detrended correspondence analysis. Elevation also represents closely correlated ecological parameters such as temperature (Emck 2007), precipitation (Fries et al. 2012; Muenchow et al. 2013c), wind speed (Richter et al. 2008; Peters 2009), and/or soil conditions (Muenchow et al. 2013a). In our study area, quasi-permanent trade winds and extraordinary high precipitation amounts as well as high soil water contents are affecting the local position of the UFL in a negative way. Especially, the strong easterlies constrain the establishment of forests at the upper ridge areas of the Páramo formations. The consequence is a patchy structure of isolated but dense tree stands in shallow depressions or on wind-protected flats on the windward escarpment below the crest line. In contrast, dense forests occur just beneath the rim of the same crest forming a sharp forest line on the leeside. In addition, high precipitation amounts are leading to higher soil water contents on the ridges, thus inhibiting tree growth. Depending on topography, this phenomenon may already begin as low as 2600 m a.s.l. At lower elevations, the ridges disappear under a coherent forest cover as they become steeper and thus water drainage is more efficient. Since elevation also explains species richness pretty well (R2: 72%, model not shown), the first DCA-axis also constitutes a species richness gradient. Of course, increasingly harsh conditions at higher altitudinal levels affect adversely community composition and diversity. Some of the challenges plants encounter with increasing altitude are lower temperatures (Körner 1998; Bendix and Rafiqpoor 2001; Körner and Paulsen 2004), higher wind speeds (Holtmeier 2003; Peters 2009) and higher precipitation amounts (Emck 2007; Bendix et al. 2009), to name but a few. Interestingly, most of the above-mentioned climate factors are also contributing to the high species richness. On the one hand, high tree diversity can be explained by harsh environmental conditions as well as by a complex topography and also by the rain-induced poor soil conditions. On the other hand, the same factors are also responsible for the lowering of the UFL. The result is a combination of a clearly marked UFL depression combined with an extraordinary UFL complexity, which was an almost unknown paradox.
Acknowledgments
The authors are indebted to the German Research Foundation (DFG) for funding the study in the framework of the Research Unit FOR 816. We also would like to thank Eva and Jay Llewellyn, Bruno Lasermann, and Karl-Heinz Diertl for the help at various stages of this work. We gratefully acknowledge the help of Bolívar Merino at the herbarium of Loja for assistance with the identification of the collected plant material. We acknowledge support by Deutsche Forschungsgemeinschaft and Friedrich-Alexander-Universität Erlangen-Nürnberg (FAU) within the funding programme Open Access Publishing.
Conflict of interest
None declared.
References
- Bader MY, Ruijten JA. A topography-based model of forest cover at the alpine tree line in the tropical Andes. J. Biogeogr. 2008;35:711–723. [Google Scholar]
- Bader MY, Rietkerk M, Bregt AK. Vegetation structure and temperature regimes of tropical alpine treelines. Arct. Antarct. Alp. Res. 2007a;39:353–364. [Google Scholar]
- Bader MY, van Geloof I, Rietkerk M. High solar radiation hinders tree regeneration above the alpine treeline in northern Ecuador. Plant Ecol. 2007b;191:33–45. [Google Scholar]
- Balslev H. Distribution patterns of Ecuadorean plant species. Taxon. 1988;37:567–577. [Google Scholar]
- Barthlott W, Hostert A, Kier G, Küper W, Kreft H, Mutke J, et al. Geographic patterns of vascular plant diversity at continental to global scales. Erdkunde. 2007;61:305–315. [Google Scholar]
- Bates D, Maechler M, Bolker B. 2014. lme4: Linear mixed-effects models using S4 classes. Available at http://CRAN.R-project.org/package=lme4. (accessed 23 February 2014)
- Baumann F. Zürich: Geographisches Institut der Universität Zürich; 1988. Geographische Verbreitung und Ökologie südamerikanischer Hochgebirgspflanzen. Beitrag zur Rekonstruktion der quartären Vegetationsgeschichte der Anden. PhD thesis. [Google Scholar]
- Beck E. Ecological aspects of a biodiversity hotspot in the Andes of southern Ecuador. In: Gradstein SR, Homeier J, Gansert D, Richter M, editors. The tropical mountain forest – patterns and processes in a biodiversity hotspot. Göttingen: Biodiversity and Ecology Series; 2008. pp. 195–217. [Google Scholar]
- Bendix J, Rafiqpoor MD. Studies on the thermal conditions of soils at the upper tree line in the Páramo of Papallacta (Eastern cordillera of Ecuador) Erdkunde. 2001;55:257–276. [Google Scholar]
- Bendix J, Behling H, Peters T, Richter M. Functional biodiversity and climate change along an altitudinal gradient in a tropical mountain rainforest. In: Tscharnke T, Leuschner C, Veldkamp E, Faust H, Guhardja E, Bidin A, Beck E, editors. Tropical rainforests and agroforests under global change. Heidelberg: Environmental Science and Engineering Subseries: Environmental Science; 2009. pp. 239–268. [Google Scholar]
- Brunschön C, Behling H. Reconstruction and visualization of upper forest line and vegetation changes in the Andean depression region of south-eastern Ecuador since the last glacial maximum - A multi-site synthesis. Rev. Palaeobot. Palynol. 2010;163:139–152. [Google Scholar]
- Colwell RK, Mao CX, Chang J. Interpolating, extrapolating, and comparing incidence-based species accumulation curves. Ecology. 2004;85:2717–2727. [Google Scholar]
- Ellenberg H. Mans influence on tropical mountain ecosystems in South America. J. Ecol. 1979;67:401–416. [Google Scholar]
- Emck P. Erlangen: University of Erlangen-Nuremberg; 2007. A Climatology of South Ecuador. With Special Focus on the Major Andean Ridge as Atlantic-Pacific Climate Divide. PhD thesis. Available at http://www.opus.ub.uni-erlangen.de/opus/volltexte/2007/656/. (accessed 7 February 2013) [Google Scholar]
- Fries A, Rollenbeck R, Nauss T, Peters T, Bendix J. Near surface air humidity in a megadiverse Andean mountain ecosystem of southern Ecuador and its regionalisation. Agric. For. Meteorol. 2012;152:17–30. [Google Scholar]
- Gentry AH. Neotropical floristic diversity: phytogeographical connections between Central and South America, Pleistocene climatic fluctuations, or an accident of the Andean orogeny? Ann. Mo. Bot. Gard. 1982;69:557–593. [Google Scholar]
- Gentry AH. Changes in plant community diversity and floristic composition on environmental and geographical gradients. Ann. Mo. Bot. Gard. 1988;75:1–34. [Google Scholar]
- Holtmeier FK. Mountain timberlines. Ecology, patchiness and dynamics. Adv. Glob. Res. 2003;14:369. [Google Scholar]
- Holtmeier FK, Broll G. Sensitivity and response of northern hemisphere altitudinal and polar treelines to environmental change at landscape and local scales. Glob. Ecol. Biogeogr. 2005;14:395–410. [Google Scholar]
- Jokisch BD, Lair BM. One last stand? Forests and change on Ecuador′s eastern Cordillera. Geogr. Rev. 2002;92:235–256. [Google Scholar]
- Jorgensen PM, León-Yánez S. Catálogo de las plantas vasculares del Ecuador. St. Louis, MO, USA: Missouri Botanical Garden Press; 1999. p. 1181. [Google Scholar]
- Kessler M. Polylepis-Wälder Boliviens: Taxa, Ökologie, Verbreitung und Geschichte. Diss. Bot. 1995;246:303. [Google Scholar]
- Kessler M, Hohnwald S. Bodentemperaturen innerhalb und außerhalb bewaldeter und unbewaldeter Blockhalden in den bolivianischen Hochanden. Ein Test der Hypothese von Walter & Medina (1969) Erdkunde. 1998;52:54–62. [Google Scholar]
- Killeen TJ, Douglas M, Consiglio T, Jorgensen PM, Mejia J. Dry spots and wet spots in the Andean hotspot. J. Biogeogr. 2007;34:1357–1373. [Google Scholar]
- Kindt R, van Damme P, Simons AJ. Patterns of species richness at varying scales in western Kenya: planning for agroecosystem diversification. Biodivers. Conserv. 2006;15:3225–3249. [Google Scholar]
- Körner C. A re-assessment of high elevation treeline positions and their explanation. Oecologia. 1998;115:445–459. doi: 10.1007/s004420050540. [DOI] [PubMed] [Google Scholar]
- Körner C. Climatic treelines: conventions, global patterns, causes. Erdkunde. 2007;61:316–324. [Google Scholar]
- Körner C, Paulsen J. A world-wide study of high altitude treeline temperatures. J. Biogeogr. 2004;31:713–732. [Google Scholar]
- Köster N, Friedrich K, Nieder J, Barthlott W. Conservation of epiphyte diversity in an Andean landscape transformed by human land use. Conserv. Biol. 2009;23:911–919. doi: 10.1111/j.1523-1739.2008.01164.x. [DOI] [PubMed] [Google Scholar]
- Kull U. Ein botanischer Streifzug durch die Cordillera Blanca (Peru) Nat. Mus. 1991;121:257–268. [Google Scholar]
- Lauer W, Rafiqpoor MD, Bendix J. 2001a;1:154. Vergleichende Geoökologie der Hochgebirge der Nördlichen (Mexiko) und Südlichen (Bolivien) Randtropen sowie der inneren Tropen (Ecuador). Abhandlungen der Mathematisch – Naturwissenschaftlichen Klasse. [Google Scholar]
- Lauer W, Rafiqpoor MD, Theisen I. Physiogeographie. Erdwissenschaftliche Forschung: Vegetation und Syntaxonomie der Flora des Páramo de Papallacta (Ostkordillere Ecuador); 2001b. 39. [Google Scholar]
- Lauer W, Rafiqpoor MD, Bendix J. 2003;1 Vergleichende Geoökologie der Hochgebirge der Nördlichen (Mexiko) und Südlichen (Bolivien) Randtropen sowie der inneren Tropen (Ecuador). Abhandlungen der Mathematisch-Naturwissenschaftlichen Klasse. [Google Scholar]
- Miehe G, Miehe S. Die obere Waldgrenze in tropischen Gebirgen. Geogr. Rundsch. 1996;11:670–676. [Google Scholar]
- Missouri Botanical Garden. 2013. Tropicos. Available at http:// http://www.tropicos.org/. (accessed 3 March 2013)
- Muenchow J, Braeuning A, Rodríguez EF, von Wehrden H. Predictive mapping of species richness and plant species' distributions of a Peruvian fog oasis along an altitudinal gradient. Biotropica. 2013a;45:557–566. [Google Scholar]
- Muenchow J, Feilhauer H, Braeuning A, Rodríguez EF, Bayer F, Rodríguez RA, et al. Coupling ordination techniques and GAM to spatially predictvegetation assemblages along a climatic gradient in an ENSO-affected region of extremelyhigh climate variability. J. Veg. Sci. 2013b;24:1154–1166. [Google Scholar]
- Muenchow J, Hauenstein S, Braeuning A, Baeumler R, Rodríguez EF, von Wehrden H. Soil texture and altitude, respectively, widely determine the floristic gradient of the most diverse fog oasis in the Peruvian desert. J. Trop. Ecol. 2013c;29:427–438. [Google Scholar]
- Oksanen J. 2013. Vegan: ecological diversity. Available at http://cran.rproject.org/web/packages/vegan/vignettes/diversity-vegan.pdf. (accessed 25 February 2014)
- Oksanen J, Blanchet FG, Kindt R, Legendre P, Minchin PR, O'Hara RB, et al. 2014. Package vegan: Community ecology package. Available at http://CRAN.R-project.org/package=vegan. (accessed 21 February 2014)
- Peters T. 2009. Struktur und ökologische Merkmale der oberen Waldgrenze in der Andinen Depression. PhD thesis, University of Erlangen-Nuremberg, Erlangen. Available at http://www.opus.ub.uni-erlangen.de/opus/volltexte/2009/1384/. (accessed 2 July 2013)
- Peters T, Diertl KH, Gawlik J, Rankl M, Richter M. Vascular plant diversity in natural and anthropogenic ecosystems in the Andes of Southern Ecuador. Mt. Res. Dev. 2010;30:344–352. [Google Scholar]
- Pimm R, Raven P. Biodiversity – extinction by numbers. Nature. 2000;403:843–845. doi: 10.1038/35002708. [DOI] [PubMed] [Google Scholar]
- R Development Core Team. R: A language and environment for statistical computing. 2014. Available at http://www.R-project.org/. (accessed 21 February 2014) [Google Scholar]
- Richter M. Using epiphytes and soil temperatures for eco-climatic interpretations in Southern Ecuador. Erdkunde. 2003;57:161–181. [Google Scholar]
- Richter M, Moreira-Munoz A. Heterogeneidad climática y diversidad de la vegetación en el sur de Ecuador: un método de fitoindicación. Rev. Peru. Biol. 2005;12:217–238. [Google Scholar]
- Richter M, Diertl K, Peters T. Vegetation structures and ecological features of the upper timberline ecotone. In: Beck E, Bendix J, Kottke I, Makeschin F, Mosandl R, Bussmann R, editors. Gradients in a tropical mountain ecosystem of Ecuador. Berlin: Ecological Studies; 2008. pp. 123–136. [Google Scholar]
- Richter M, Diertl KH, Emck P, Peters T, Beck E. Reasons for an outstanding plant diversity in the tropical Andes of Southern Ecuador. Landsc. Online. 2009;12:1–35. [Google Scholar]
- Rodriguez F, Bräuning A, Gerique A, Behling H. Current cultural services: landscape history. In: Bendix J, Beck E, Bräuning A, Makeschin F, Mosandl R, Scheu S, Wilcke W, Volland F, editors. Ecosystem services, biodiversity and environmental change in a tropical mountain ecosystem of south Ecuador. Berlin, Heidelberg: Ecological Studies Series; 2013. pp. 53–66. [Google Scholar]
- Rohde K. Latitudinal gradients in species diversity: the search for the primary cause. Oikos. 1992;65:514–527. [Google Scholar]
- Sala OE, Armesto FS, III, Chapin JJ, Berlow R, Bloomfield J, Dirzo R, et al. Global biodiversity scenarios for the year 2100. Science. 2000;287:1770–1774. doi: 10.1126/science.287.5459.1770. [DOI] [PubMed] [Google Scholar]
- Sarkar D. Lattice: Multivariate data visualization with R. New York: Springer; 2008. [Google Scholar]
- Sarmiento FO, Frolich LM. Andean Cloud forest tree lines. Naturalness, Agriculture and the Human Dimension. Mt. Res. Dev. 2002;22:278–287. [Google Scholar]
- Smith N, Mori SA, Henderson A, Stevenson D, Heald S. Flowering plants of the neotropics. New York, USA: Princeton Univ. Press; 2004. p. 594. [Google Scholar]
- Tinner W, Theurillat JP. Uppermost limit, extent, and fluctuations of the timberline and treeline ecocline in the Swiss Central Alps during the past 11,500 years. Arct. Antarct. Alp. Res. 2003;35:158–169. [Google Scholar]
- Treml V, Banaš M. The effect of exposure on Alpine treeline position: a case study from the High Sudetes, Czech Republic. Arct. Antarct. Alp. Res. 2008;40:751–760. [Google Scholar]
- Ugland KI, Gray JS, Ellingsen KE. The species-accumulation curve and estimation of species richness. J. Anim. Ecol. 2003;72:888–897. [Google Scholar]
- United States Geological Survey. 2012. Shuttle Radar Topography Mission (SRTM) Data. http://ftp://e0srp01u.ecs.nasa.gov/srtm/version2/SRTM3/South_America/ last accessed 08/01/2012.
- Walter H, Medina E. Die Bodentemperatur als ausschlaggebender Faktor für die Gliederung der subalpinen und alpinen Stufe in den Anden Venezuelas. Ber. Dtsch. Bot. Ges. 1969;82:275–281. [Google Scholar]
- Weigend M. Observations on the biogeography of the Amotape-Huancabamba-Zone in northern Peru. Bot. Rev. 2002;69:38–54. [Google Scholar]
- Weigend M. Additional observations on the biogeography of the Amotape-Huancabamba-Zone in northern Peru. Defining the south-eastern limits. Rev. Peru. Biol. 2004;11:127–134. [Google Scholar]
- Willig MR, Kaufman DM, Stevens RD. Latitudinal gradients of biodiversity: patterns, process, scale and synthesis. Annu. Rev. Ecol. Evol. Syst. 2003;34:273–309. [Google Scholar]
- Zuur AF, Ieno EN, Walker N, Saveliev AA, Smith GM. Mixed effects models and extensions in ecology with R. New York: Springer; 2009. [Google Scholar]