Summary Paragraph
Medulloblastoma is a highly malignant paediatric brain tumour currently treated with a combination of surgery, radiation, and chemotherapy, posing a considerable burden of toxicity to the developing child. Genomics has illuminated the extensive intertumoural heterogeneity of medulloblastoma, identifying four distinct molecular subgroups. Group 3 and Group 4 subgroup medulloblastomas account for the majority of paediatric cases; yet, oncogenic drivers for these subtypes remain largely unidentified. Here we describe a series of prevalent, highly disparate genomic structural variants, restricted to Groups 3 and 4, resulting in specific and mutually exclusive activation of the growth factor independent 1 family protooncogenes, GFI1 and GFI1B. Somatic structural variants juxtapose GFI1/GFI1B coding sequences proximal to active enhancer elements, including super-enhancers, instigating oncogenic activity. Our results, supported by evidence from mouse models, identify GFI1 and GFI1B as prominent medulloblastoma oncogenes and implicate ‘enhancer hijacking’ as an efficient mechanism driving oncogene activation in a childhood cancer.
Introduction
Recent genome sequencing studies of medulloblastoma (MB), a leading cause of cancer-related mortality in children1, have yielded considerable insight into the genes, pathways, and overall mutational landscape contributing to its pathogenesis2–4. Despite these advances, MB continually proves to be a vastly heterogeneous disease characterised by very few recurrently mutated genes5. MB comprises at least four distinct molecular subgroups – wingless (WNT), sonic hedgehog (SHH), Group 3 and Group 4 – each of which exhibits unique clinical and biological attributes, consistent with the concept of MB existing as not a single entity, but more aptly a collection of different diseases6,7.
Of the consensus subgroups, Groups 3 and 4 MBs have the poorest outcomes and remain least understood in terms of underlying genetics and biology5. Somatic MYC and MYCN amplifications rank amongst the most prevalent driver events known in these subgroups, altered in just 17% (MYC) and 6% (MYCN) of Group 3 and Group 4 MBs, respectively8. Recurrent, somatically mutated genes are equally scarce, and for the majority of cases, no obvious somatic ‘drivers’ have yet been revealed5.
By analysing MB genome sequencing data from different initiatives2–4, we identified a series of spatially clustered somatic genomic structural variants (SVs) involving diverse SV classes that are exquisitely linked to activation of GFI1B or its paralog GFI1 in Group 3 and Group 4 MBs. Further genomic and epigenomic analyses revealed a varied yet consistent interplay between SVs and the underlying epigenome that can explain GFI1/GFI1B activation in the majority of cases. Functional analyses performed in mice confirmed the oncogenicity of GFI1/GFI1B in the context of MB. Collectively, these studies establish GFI1 and GFI1B as novel, highly prevalent MB oncogenes specifically activated in Group 3 and Group 4.
Diverse SVs activate GFI1B in MB
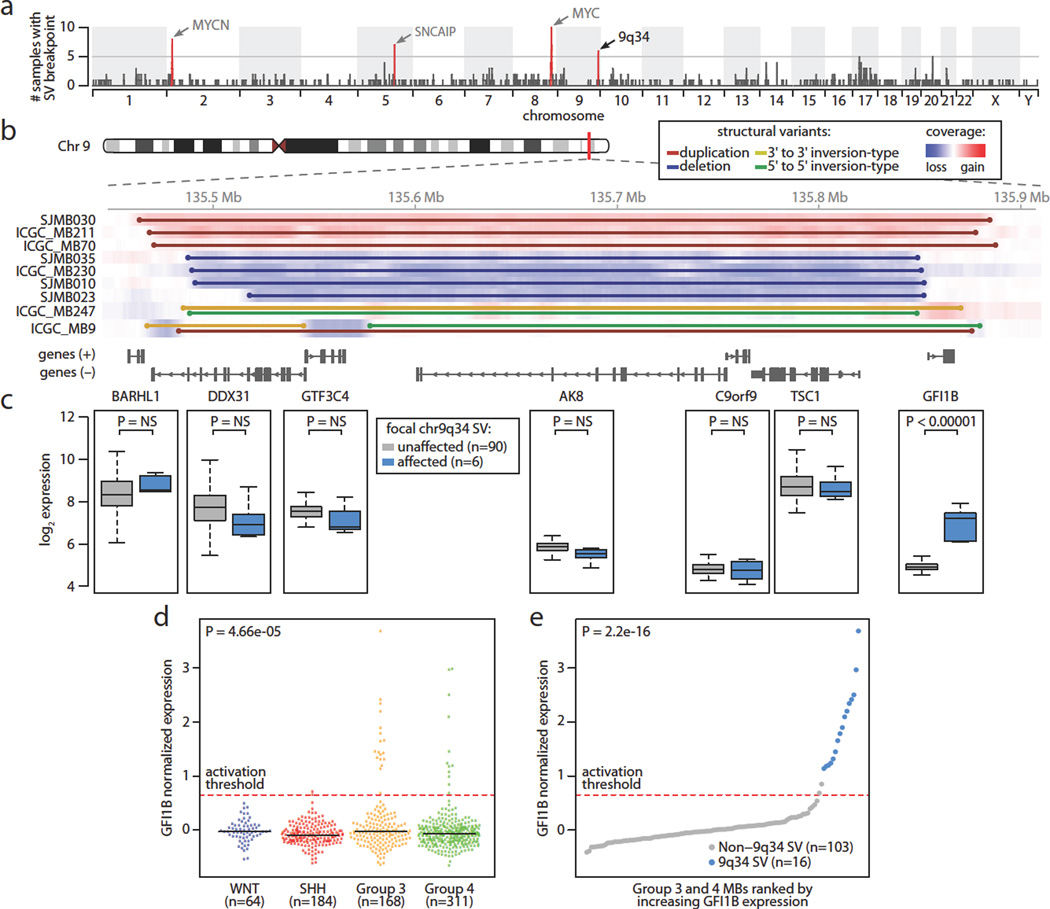
Whole-genome sequencing (WGS; standard 100 bp, paired-end and large-insert paired end sequencing – see Online Methods) of 137 primary Group 3 and 4 MB samples (46 published2,4 and 91 newly generated; Supplemental Table 1) facilitated a systematic, high-resolution screen for somatic SVs targeting novel MB drivers. Rather than limiting our search to minimal common regions of recurrent amplification or deletion, a well-established approach for identifying somatically altered cancer genes9,10, we considered all chromosomal rearrangements (i.e., breakpoint clusters) detectable by WGS, including deletions, insertions, tandem duplications, amplifications, inversions, and complex variants involving different SV classes (see Online Methods). Loci harboring known MB-related genes, including MYCN (2p24.3), MYC (8q24.21), and SNCAIP (5q23.2)8, were readily recovered using this strategy (Fig. 1a). A novel prominent region of interest mapped to chromosome 9q34.13 (Fig. 1a). Further assessment of our entire discovery series identified 9/137 (6.6%) cases with evidence of focal SV spanning this region of interest on chromosome 9 (135.46–135.89 Mb, ~425 kb; Fig. 1b).
Figure 1. Recurrent SVs activate the GFI1B proto-oncogene in MB.
(a) Genome-wide SVs identified by WGS in a discovery cohort of Group 3 and Group 4 MBs (n=137). (b) Summary of SVs affecting a common locus of aberration on 9q34. (c) Expression boxplots (n=96) for the 7 genes contained within the 9q34 region of interest. (d) GFI1B expression across MB subgroups (n=727). Dashed line delineates the threshold for detectable expression (see Online Methods). (e) GFI1B expression for Group 3 and Group 4 MBs (n=119) coloured according to 9q34 SV state. Dashed line indicates the threshold for detectable expression (see Online Methods).
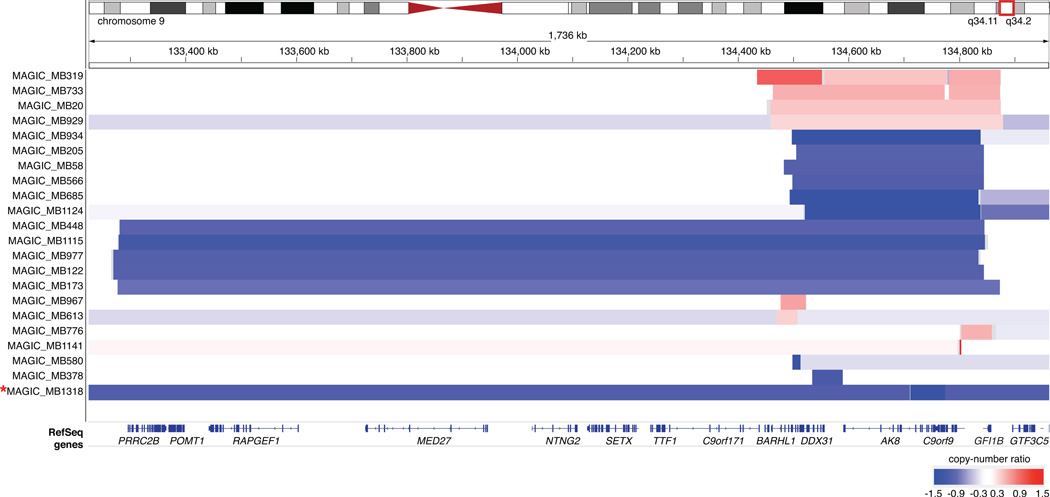
Instead of showing preponderance for a particular SV type, we observed a range of different SV classes at 9q34, including focal deletion (n=4), tandem duplication (n=3), and complex variants exhibiting inversions and focal deletions (n=2). Examination of microarray-based copy-number data from our recent MB genomics study8 revealed additional evidence for subgroup-specific incidence of recurrent SVs affecting this region (Extended Data Fig. 1).
The region of interest on 9q34 harbours seven known genes (Fig. 1b), including the TSC1 tumour suppressor gene previously implicated in MB11. Integration of SV status with sample-matched gene expression data, however, uncovered highly specific transcriptional up-regulation of GFI1B in samples harboring 9q34 SV compared to non-affected counterparts (P<0.00001, Fig. 1c). In contrast, neither TSC1 nor any of the other remaining candidate genes exhibited a significant difference in expression in this context (Fig. 1c). Analysis of GFI1B expression in a large series of MBs (n=727)4,8 further substantiated this candidate, confirming restriction of GFI1B activation to Groups 3 and 4, affecting 10.7% and 3.5% of cases from these subgroups, respectively (Fig. 1d).
To further characterise the relationship between somatic SVs at 9q34 and GFI1B transcriptional activation, we sequenced a validation set of eleven Group 3 and Group 4 MBs exhibiting GFI1B expression, confirming the existence of somatic SVs in 10/11 cases (Supplemental Table 2). In just one case (MAGIC_MB179), we failed to detect an underlying SV, suggesting GFI1B over-expression might in rare instances be driven by an alternative non-SV-associated mechanism. Collectively, among 119 Group 3 and Group 4 MBs for which both WGS and matched expression array data were available, 16/18 (89%) GFI1B-activated cases displayed a detectable underlying SV (Fig. 1e). Importantly, every case showing SV at the 9q34 locus was associated with accompanying activation of GFI1B expression.
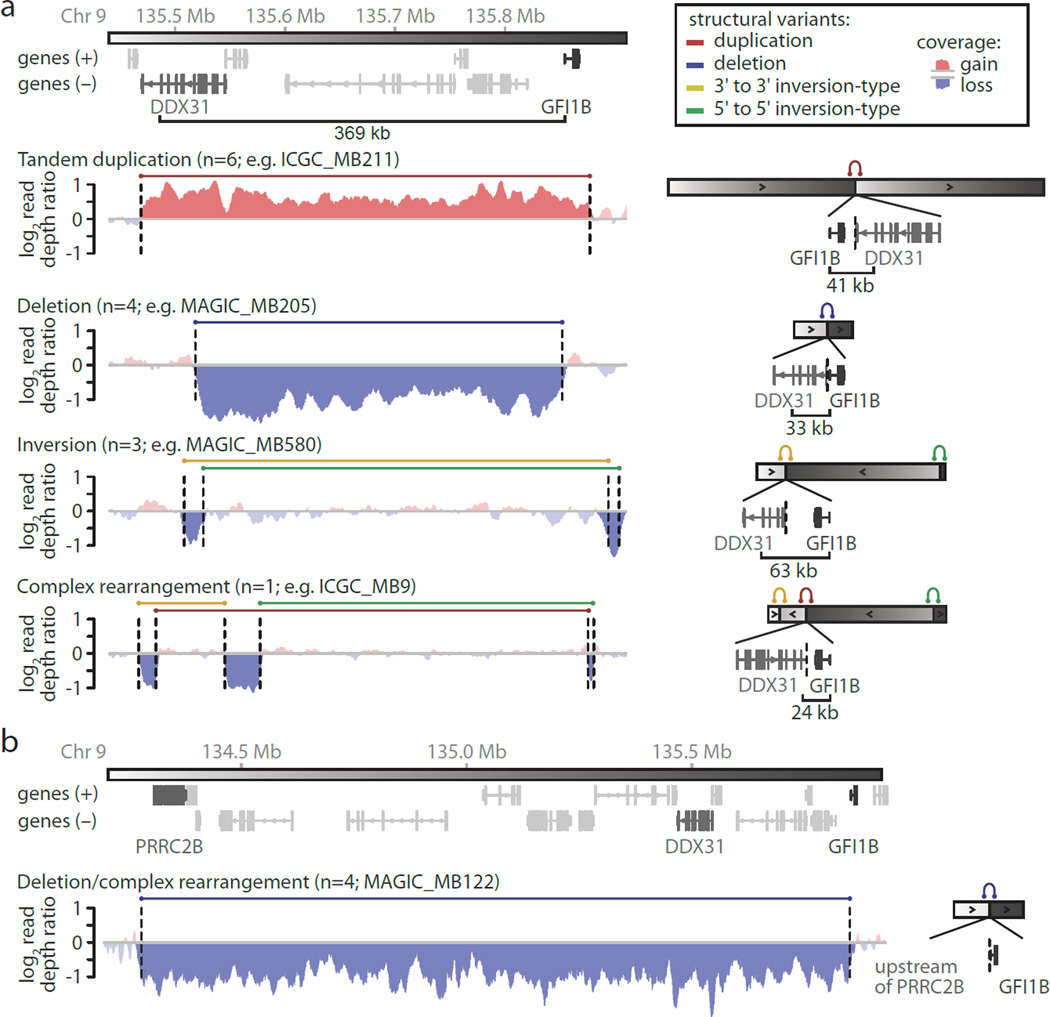
We next investigated each of the somatic SVs occurring at this locus in further detail to determine the mechanisms of GFI1B activation. Interestingly, irrespective of the underlying SV class, in 14/18 unique cases these events repositioned GFI1B proximal to the terminal sequence of the DDX31 gene, a region that is normally positioned ~370 kb upstream of the GFI1B transcriptional start site (TSS) (Fig. 2a, Supplemental Table 2). The majority of affected samples annotated in our series juxtapose GFI1B within ~40 kb of DDX31, with the most distal introns of DDX31 positioned either upstream or downstream of GFI1B, depending on the individual SV. Additionally, a smaller subset of examined cases (4/18) was found to exhibit broader deletions (~1.6 Mb) and complex rearrangements spanning a consistent region that initiates upstream of the PRRC2B gene (chr9: 134.27–134.28 Mb) and extends into the first intron (upstream of the first coding exon)of GFI1B (Fig. 2b).
Figure 2. Summary of recurrent SVs identified in GFI1B activated MBs.
(a, b) Representative WGS coverage plots and associated schematics summarizing the different mechanisms of SV observed in GFI1B-activated MBs.
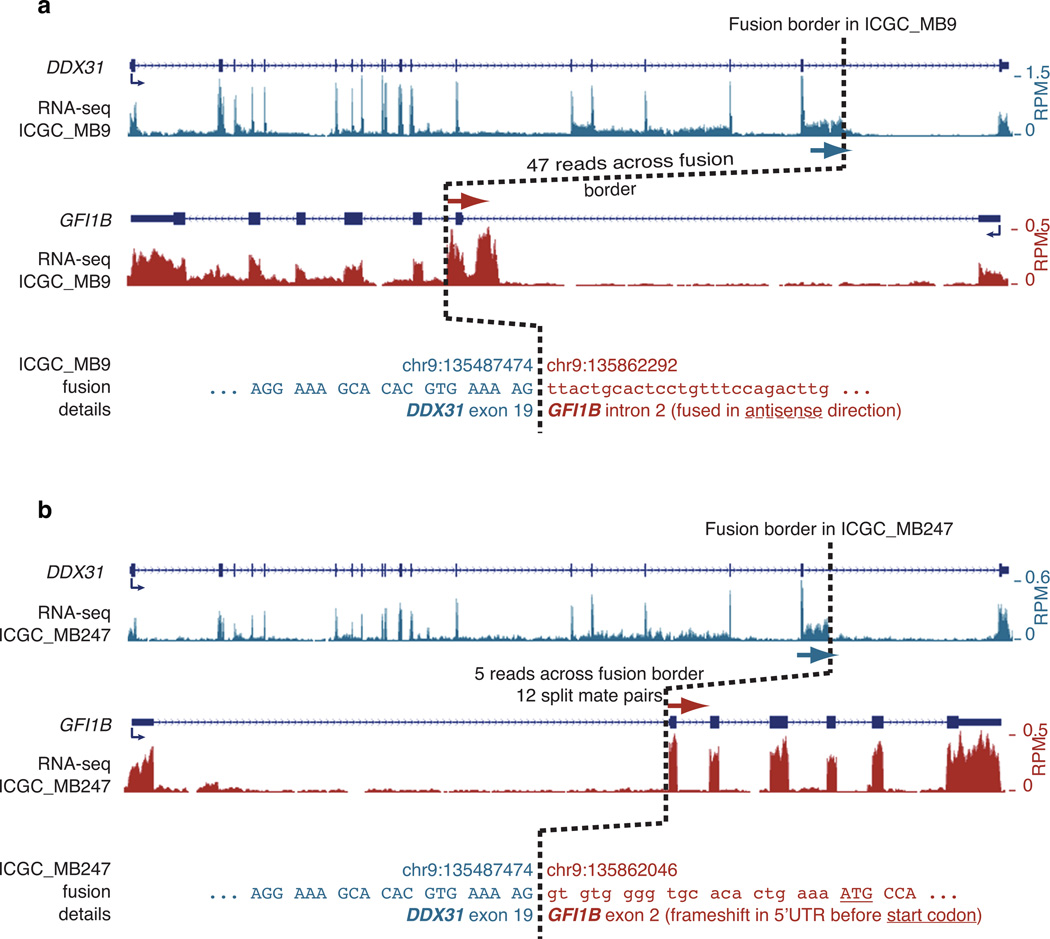
The pattern of observed SVs argued against fusions of the DDX31 coding sequence or its promoter with GFI1B as a common means of gene activation (see Fig. 2a). DDX3F.GFI1B fusion transcripts were detected in two cases (2/4 GFI1B-activated MBs with available RNA-seq data: ICGC_MB9 and ICGC_MB247) but these were predicted to constitute non-functional (antisense or out-of-frame) alternative transcripts, not resulting in GFI1B activation (Extended Data Fig. 2).
Active enhancers drive GFI1B expression
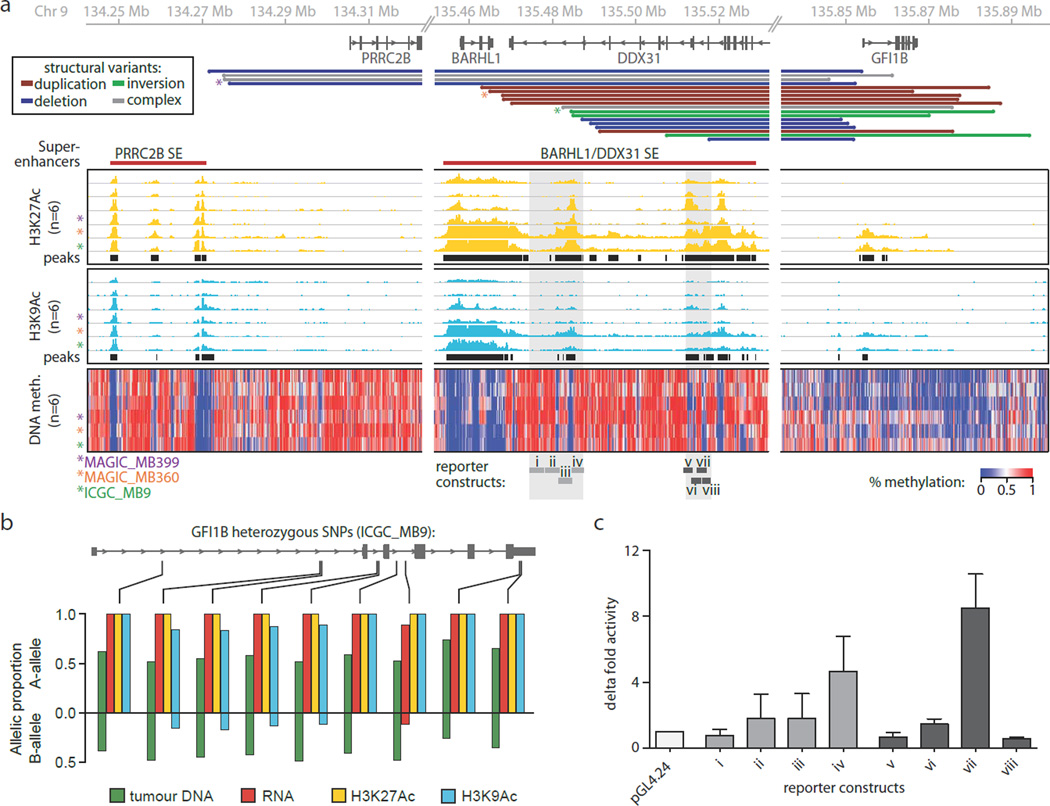
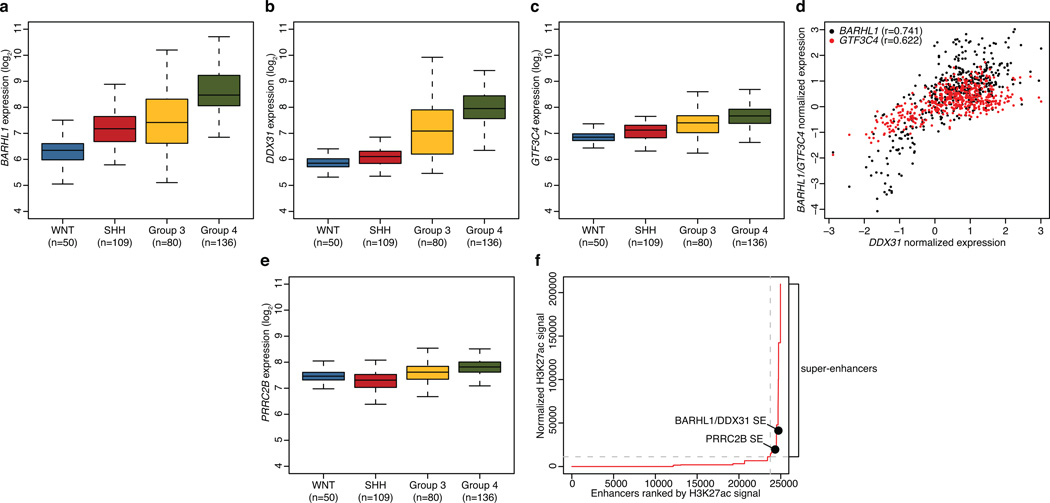
The unexpected yet consistent observation of SVs resulting in juxtaposition of GFI1B to DNA elements normally located several hundred kilobases (kb) upstream suggested that rearrangements of cis-acting regulatory elements (such as enhancers) within these regions might be responsible for GFI1B activation. DDX31 is highly expressed in Group 3 and Group 4 MBs and shows a correlated expression pattern with its two closest neighbours, BARHL1 (downstream) and GTF3C4 (upstream), suggesting this locus exists in a transcriptionally permissive chromatin state in these MB subgroups (Extended Data Fig. 3). To examine this locus and the surrounding region for evidence of enhancer activity, we utilised chromatin immunoprecipitation coupled with sequencing (ChIP-seq) for H3K27Ac and H3K9Ac, both known to mark active enhancers12, in six primary Group 3 MBs (Supplemental Table 1), including three GFI1B-activated cases (MAGIC_MB399, MAGIC_MB360, and ICGC_MB9; marked with an asterisk; Fig. 3a). Peak-identification of these histone modification data predicted the presence of multiple enhancer clusters in this region, with peak H3K27Ac and H3K9Ac signals prominently overlapping or found immediately adjacent to the SV breakpoints observed in GFI1B-activated cases (Fig. 3a). Such clustering of highly active enhancers, and the overall H3K27 acetylation signal measured for these regions, is consistent with the recently described super-enhancers (SEs), regulatory elements associated with the expression of cell identity genes and master transcriptional regulators13. Super-enhancer identification (see Online Methods) performed on our H3K27Ac ChIP-seq data inferred the presence of two such elements within the 9q34 region of interest (designated ‘PRRC2B SE’ and ‘BARHL1/DDX31’ SE, Fig. 3a, Extended Data Figure 3).
Figure 3. Recurrent SVs juxtapose GFI1B proximal to active enhancers on 9q34.
(a) SV breakpoints (n=18), enhancer-histone marks (H3K27Ac and H3K9Ac; n=6), and whole-genome DNA methylation data (n=6) overlapping the 9q34 locus in a subset of analysed MBs. (b) Allelic analysis of RNA-seq and enhancer ChIP-seq reads overlapping GFI1B. (c) Luciferase reporter activity for regions encompassed within the predicted enhancers indicated in panel (a) compared to empty vector. Error bars represent standard deviation from 3–4 independent experiments.
GFI1B-activated MBs with SV breakpoints overlapping the inferred ‘BARHL1/DDX31 SE’ (MAGIC_MB360, and ICGC_MB9) showed markedly higher levels of H3K27Ac and H3K9Ac within this region (compared to non-GFI1B-activated samples), indicative of a potential feedback mechanism that increases the local enhancer signal (Fig. 3a). Moreover, H3K27Ac and H3K9Ac both mark the GFI1B locus in these two cases, suggesting ‘spreading’ of the activating enhancer marks from within the predicted SE to GFI1B consequent to genomic rearrangement (Fig. 3a). Indeed, allelic analysis of RNA-seq and enhancer ChIP-seq data for ICGC_MB9 demonstrated that both GFI1B expression and the active enhancer signals spanning GFI1B originate from the same allele (Fig. 3b), presumably the allele residing on the rearranged haplotype. Whole-genome bisulphite sequencing (WGBS) analysis of the same cases revealed profound DNA hypomethylation overlapping the putative enhancers identified by ChIP-seq, further supporting the accessibility of this chromatin to the transcriptional machinery in Group 3 MBs (Fig 3a).
To directly assess the capacity of identified enhancer elements to potentiate gene expression, a series of genomic fragments (~2 kb) tiling two of the constituent enhancers (Fig. 3a, shaded regions) that contribute to the BARHL1/DDX31 SE were independently tested for enhancer activity. Assays performed in the D425 Group 3 MB cell line confirmed robust reporter activity for constructs derived from either region, whereas constructs mapping outside of these peak regions failed to yield any detectable signal (Fig. 3c).
Mutually exclusive GFI1/GFI1B activation
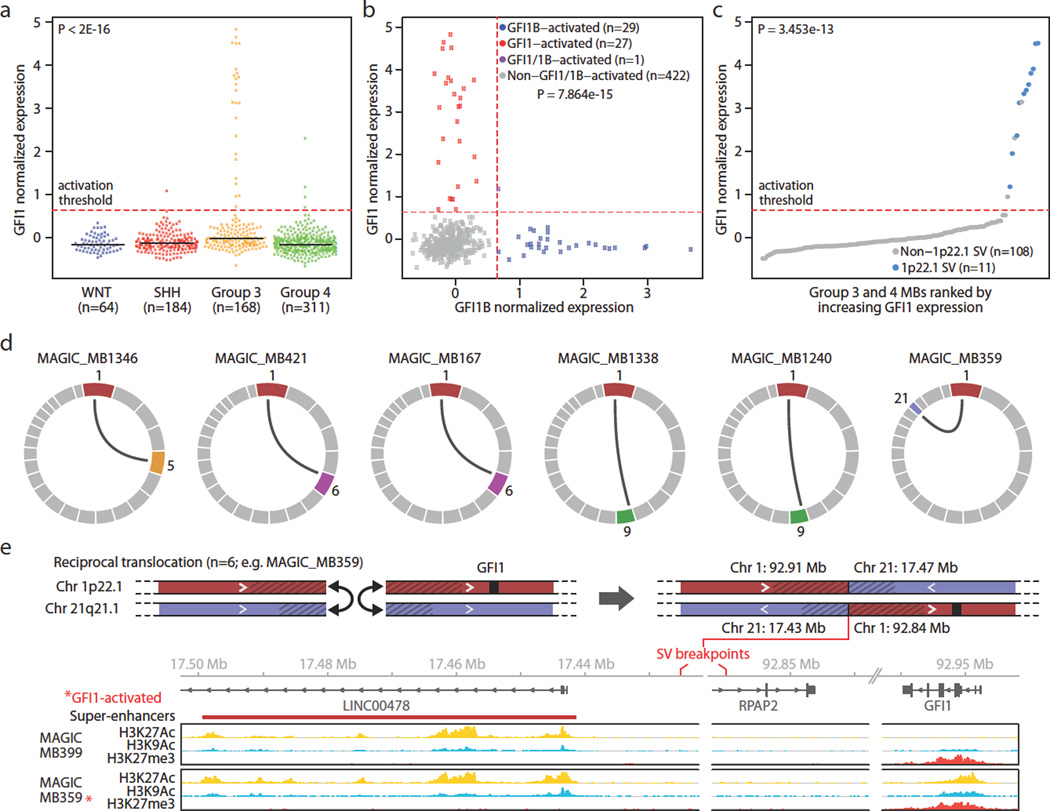
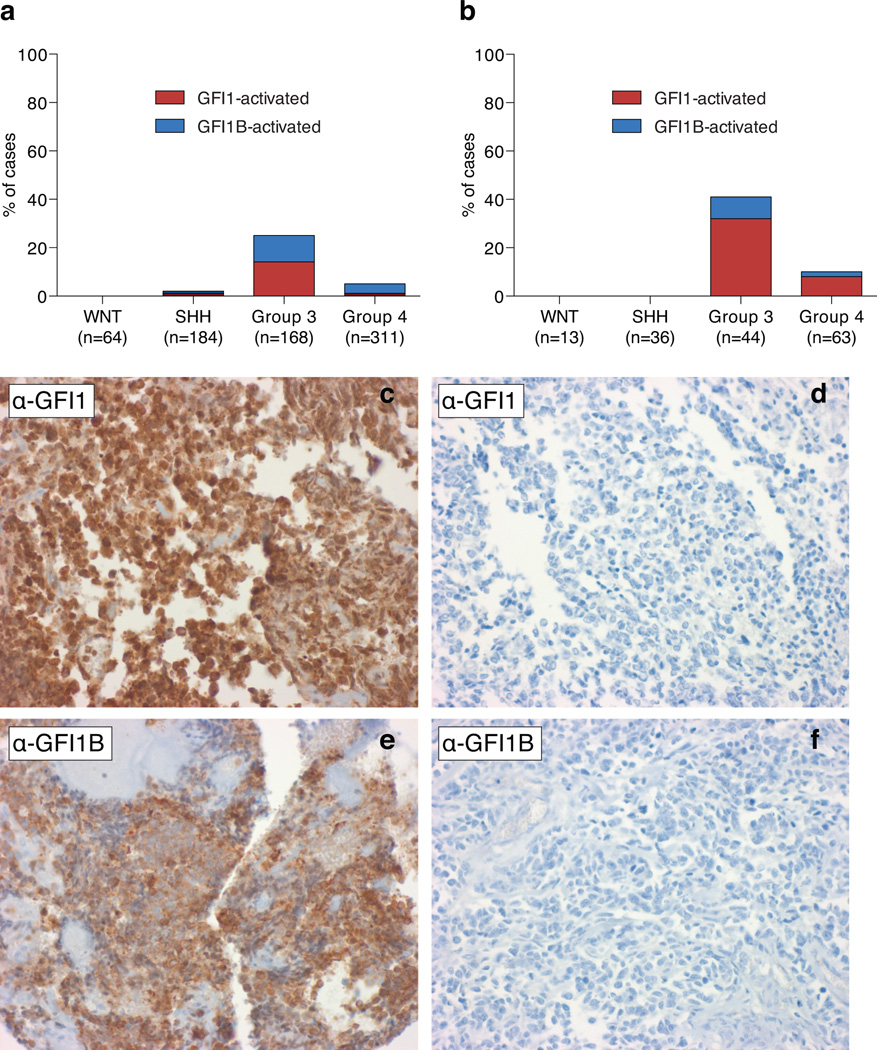
GFI1B is a paralog of growth factor independence 1 (GFI1), with both genes functioning as SNAG domain-containing zinc finger transcriptional repressors essential for a variety of developmental processes, most notably hematopoiesis14–16. Importantly, extensive mouse genetics and insertional mutagenesis screens have established Gfi1 and Gfi1b as potent proto-oncogenes in subtypes of leukemias and lymphomas17,18. However, no recurrent somatic SVs affecting GFI1 or GFI1B have been reported in these or any other cancers. Transcriptional analysis showed clear activation of GFI1 in a subset of MBs (29/724, 4.0%), with expression tightly restricted to Group 3 MBs (P < 2e-16; Fig. 4a). Comparison of GFI1 and GFI1B expression amongst Group 3 and Group 4 MBs showed a mutually exclusive pattern of activation (P=7.864e-15; Fig. 4b), further supportive of their oncogenic roles in MB. Collectively, GFI1/GFI1B expression was observed in 25% and 5% of Group 3 and Group 4 MBs, respectively (Extended Data Fig. 4). These findings were validated in an independent series of MBs (n=156) by immunohistochemical (IHC) analysis, confirming mutual exclusive GFI1 and GFI1B expression that contributed to 41% and 10% of Group 3 and Group 4 cases analysed, respectively (Extended Data Fig. 4).
Figure 4. Mutually exclusive activation of GFI1 and GFI1B in MB.
(a, b) GFI1 expression is largely restricted to Group 3 (a) and is mutually exclusive from GFI1B expression (b). (c) GFI1 expression for Group 3 and Group 4 MBs (n=119) coloured according to underlying SV state. Dashed line indicates the threshold for detectable gene expression (see Online Methods). (d) Summary of GFI1 translocations (n=6) observed in Group 3 MB. (e) Schematic of the reciprocal t(1:21) translocation observed in GFI1-activated MAGIC_MB359. Histone marks overlapping the breakpoints proximal to GFI1 and the partner chr21 translocation region are shown for a non-GFI1-activated case (MAGIC_MB399) and the translocation case (MAGIC_MB359).
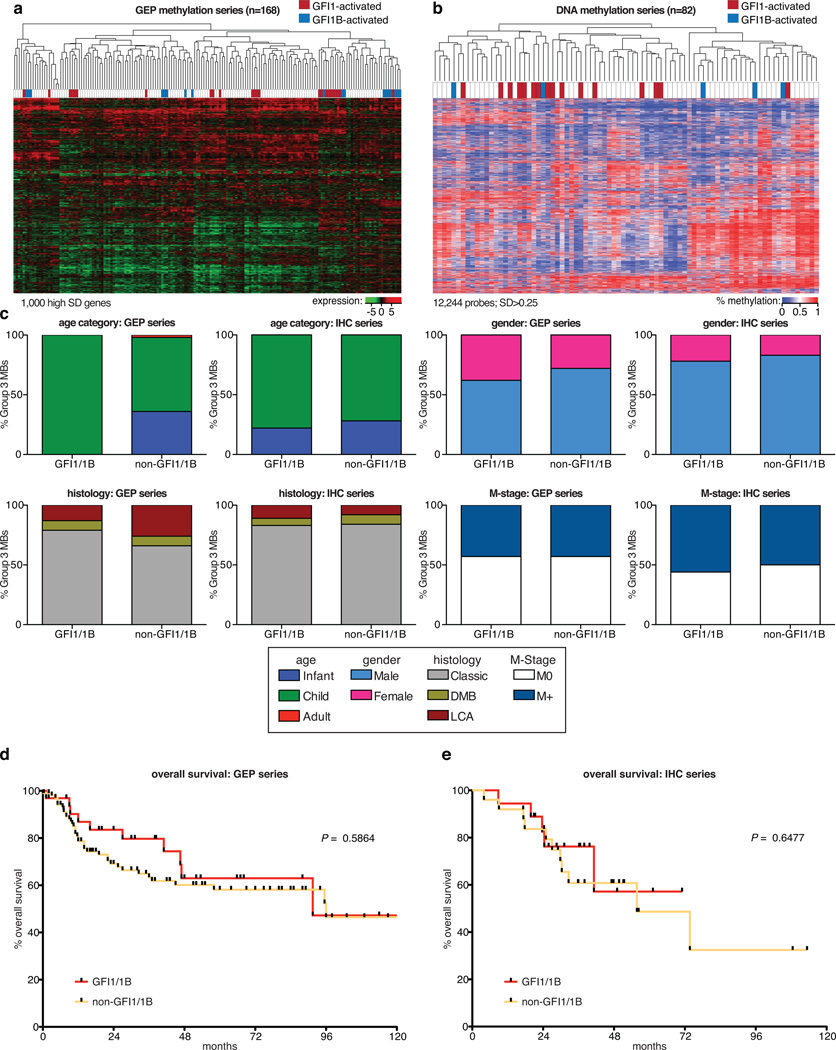
GFI1/GFI1B-expressing MBs did not form their own discrete subtype within this subgroup as evaluated by clustering of either gene expression or DNA methylation data (Extended Data Fig. 5). GFI1/GFI1B-activation status was associated with patient age in Group 3, occurring exclusively in non-infant cases in the gene expression cohort (P<0.0001, chi-squared test; Extended Data Fig. 5). However, no association with patient outcome or other clinical/demographic variables was observed in either our combined gene expression or formalin-fixed paraffin-embedded (FFPE) cohorts (Extended Data Fig. 5).
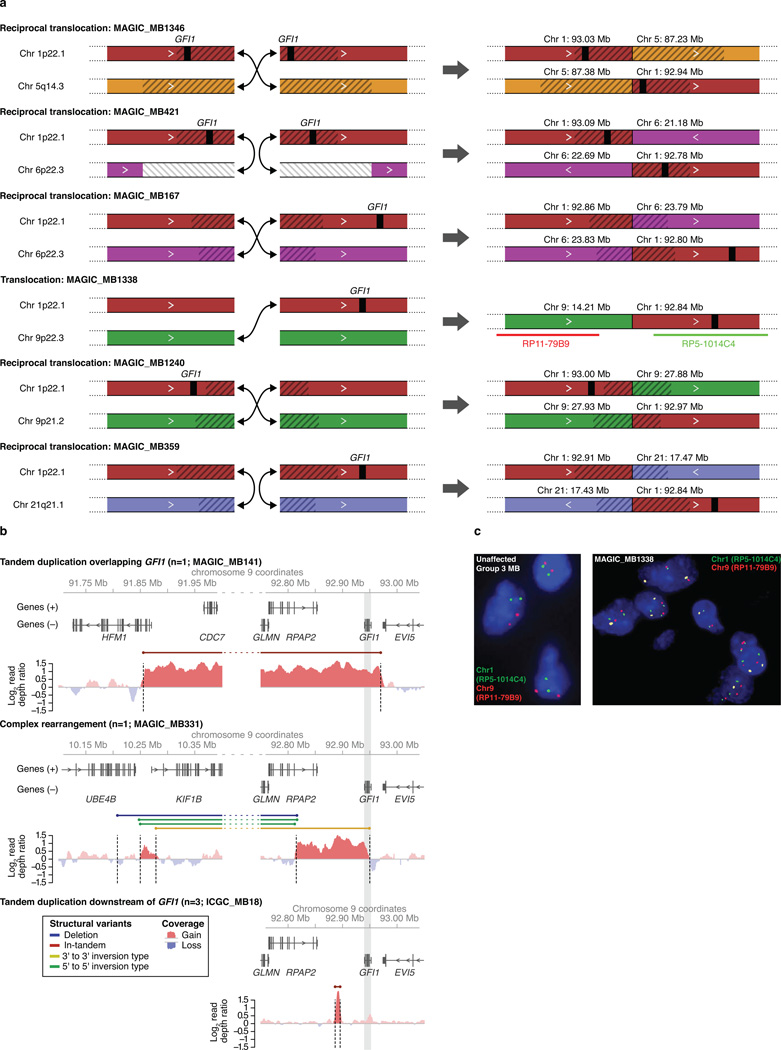
To investigate whether GFI1 activation in MB is attributable to SV mechanisms similar to those targeting GFI1B, we examined the GFI1 locus in our discovery WGS series of Group 3 and Group 4 MBs (n=137) and sequenced an additional validation set consisting of eleven non-overlapping GFI1-activated cases. This strategy revealed a diversity of SVs affecting the GFI1 locus or surrounding genomic regions, including interchromosomal translocations (n=6), tandem duplications (n=4), and a complex rearrangement (n=1), respectively, in MBs exhibiting GFI1 expression (Fig. 4d, e; Extended Data Fig. 6). We confirmed somatic SVs in 11/14 GFI1-activated cases analysed (Fig. 4c), demonstrating that, similar to GFI1B, GFI1 activation is typically associated with an underlying SV.
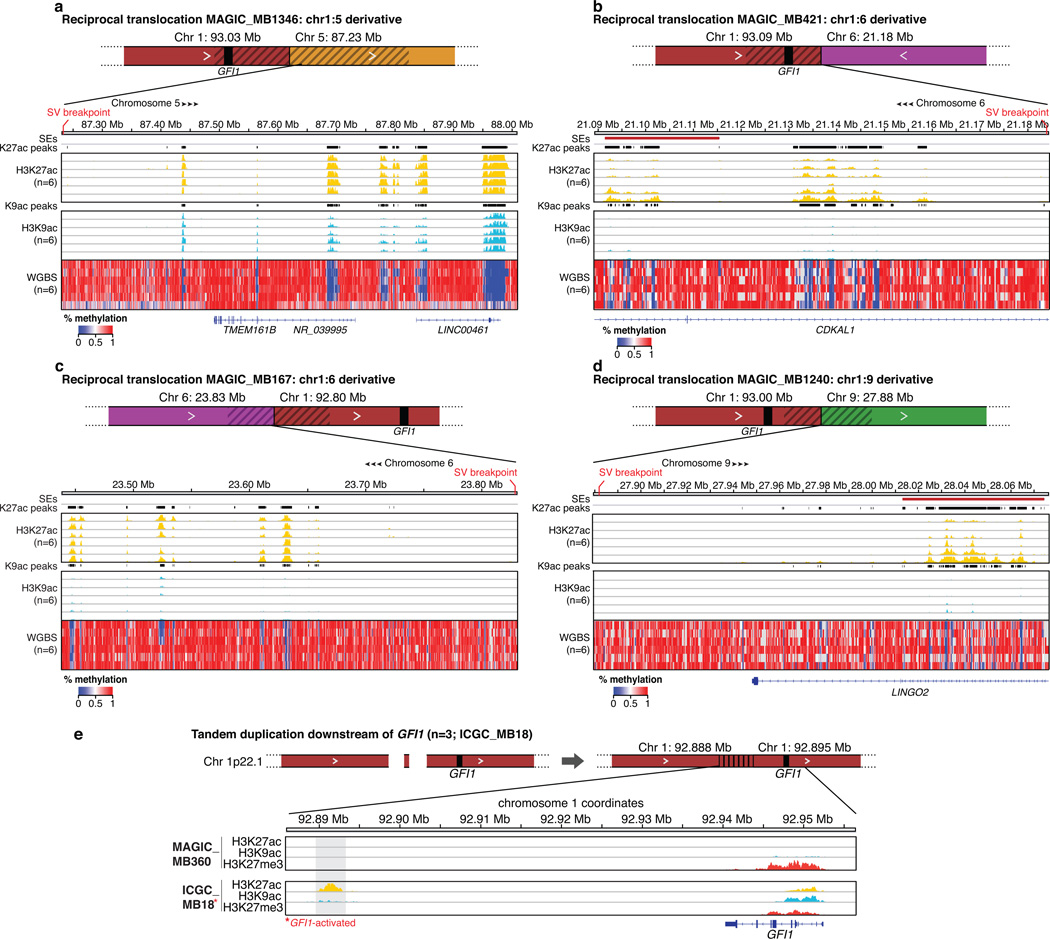
RNA-seq analysis did not disclose evidence for possible GFI1 fusion genes (data not shown), suggesting that the detected rearrangements contribute to GFI1 activation by alternative mechanisms. Observed translocation partners showed no apparent preference for intragenic or intergenic breakpoints (Supplemental Table 2). Overlaying histone ChIP-seq data with translocation breakpoint regions revealed activating enhancer-histone modification states close to the observed breakpoints (Fig. 4e; Extended Data Fig. 7), suggesting translocations of the normally repressed GFI1 locus into actively transcribed regions as the likely mechanism of gene activation. Importantly, most GFI1 translocation partners were confirmed to harbour clusters of highly active enhancers consistent with SEs that were situated proximal to sequenced breakpoints, analogous to what we observed for GFI1B-activated cases (Figure 4e, Extended Data Fig. 7).
Despite identifying multiple distinct t(1:6) and t(1:9) translocations (Fig. 4d), the only recurrent SV detected in GFI1-activated MBs was a focal (~6 kb) tandem duplication located ~45 kb downstream of GFI1, identified in three GFI1-activated samples but not in any other sequenced sample (Extended Data Fig. 6, 7). Enhancer mark ChIP-seq analysis confirmed that this focal region was profoundly marked by the active H3K27Ac mark in the context of tandem duplication but not in non-activated Group 3 MBs (Extended Data Fig. 7), suggesting that this region downstream of GFI1 can, when duplicated, promote its activation.
GFI1/GFI1B promote MB formation in vivo
Mouse models of MB have contributed important insights into disease biology19,20. Recently, two Group 3 models have been described21,22. Each of these involves over-expression of Myc with Trp53 loss-of-function – a combination not typically observed in human MBs, as MYC amplification/over-expression (Group 3) and TP53 mutations (WNT and SHH subgroups) occur in different subgroups 5,23.
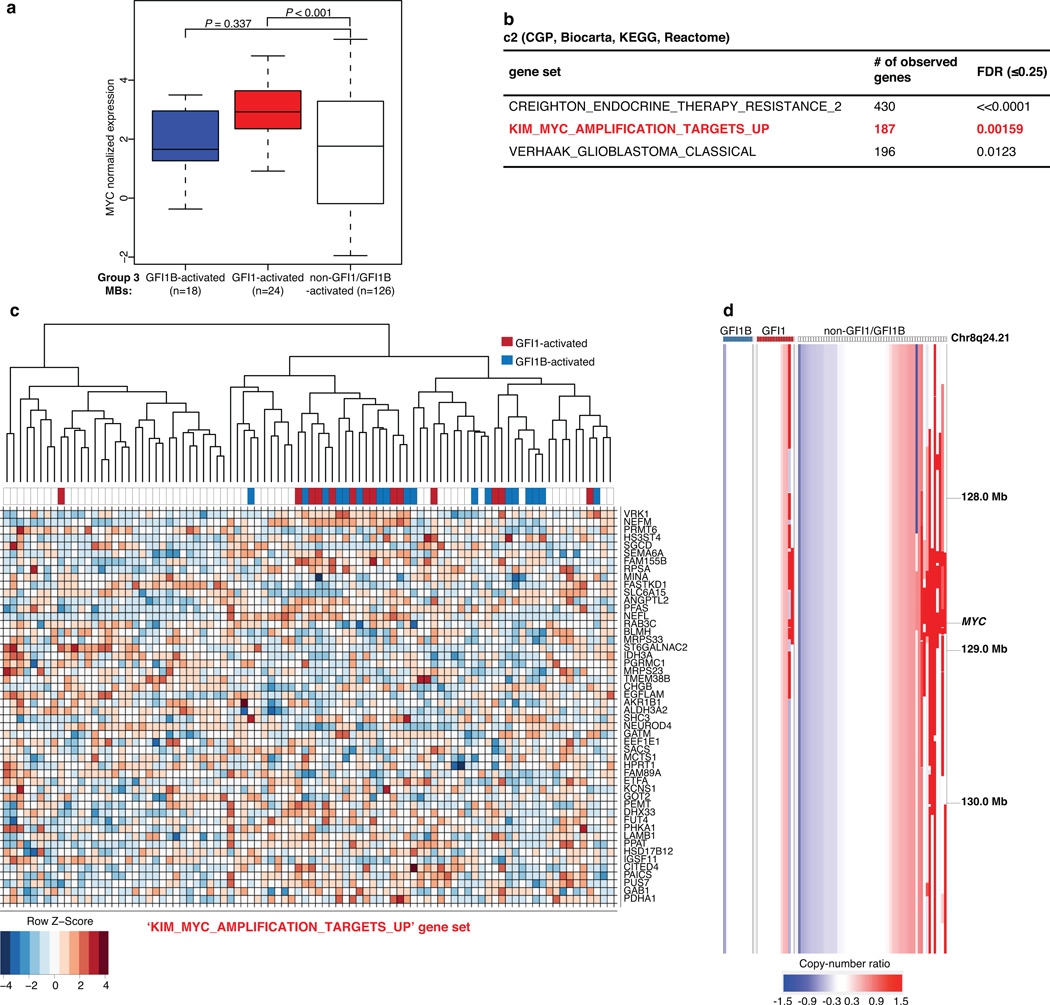
Group 3 MB expression data confirmed significant up-regulation of MYC in GFI1-activated cases versus non-GFI1/GFI1B-activated, subgroup-matched counterparts (Extended Data Fig. 8). Pathway analysis identified MYC target gene sets as being highly enriched in GFI1/GFI1B-activated Group 3 MBs (Extended Data Fig. 8). Additionally, co-occurrence of MYC amplification and GFI1-activation was noted in a subset of Group 3 MBs (Extended Data Fig. 8), further suggesting that GFI1 and MYC may cooperate to promote Group 3 MB. Indeed, Gfi1 and Myc are known to function as synergistic oncogenes and enhance T-cell lymphomagenesis in transgenic mouse models24,25.
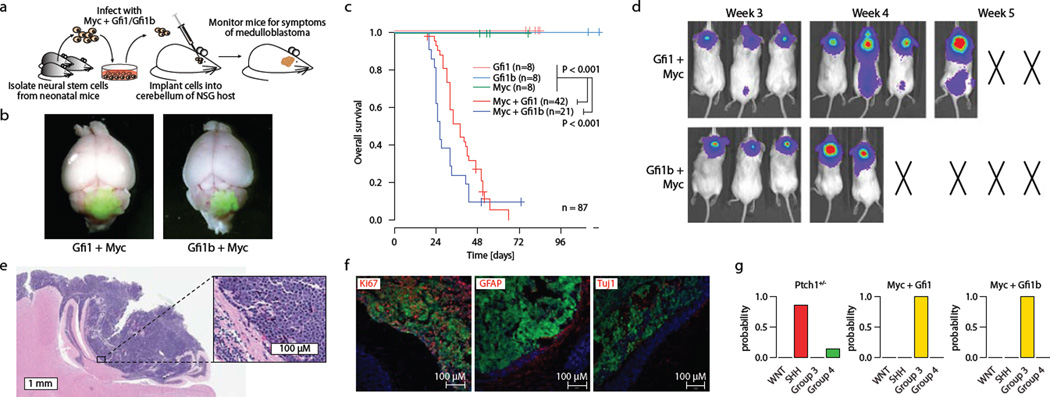
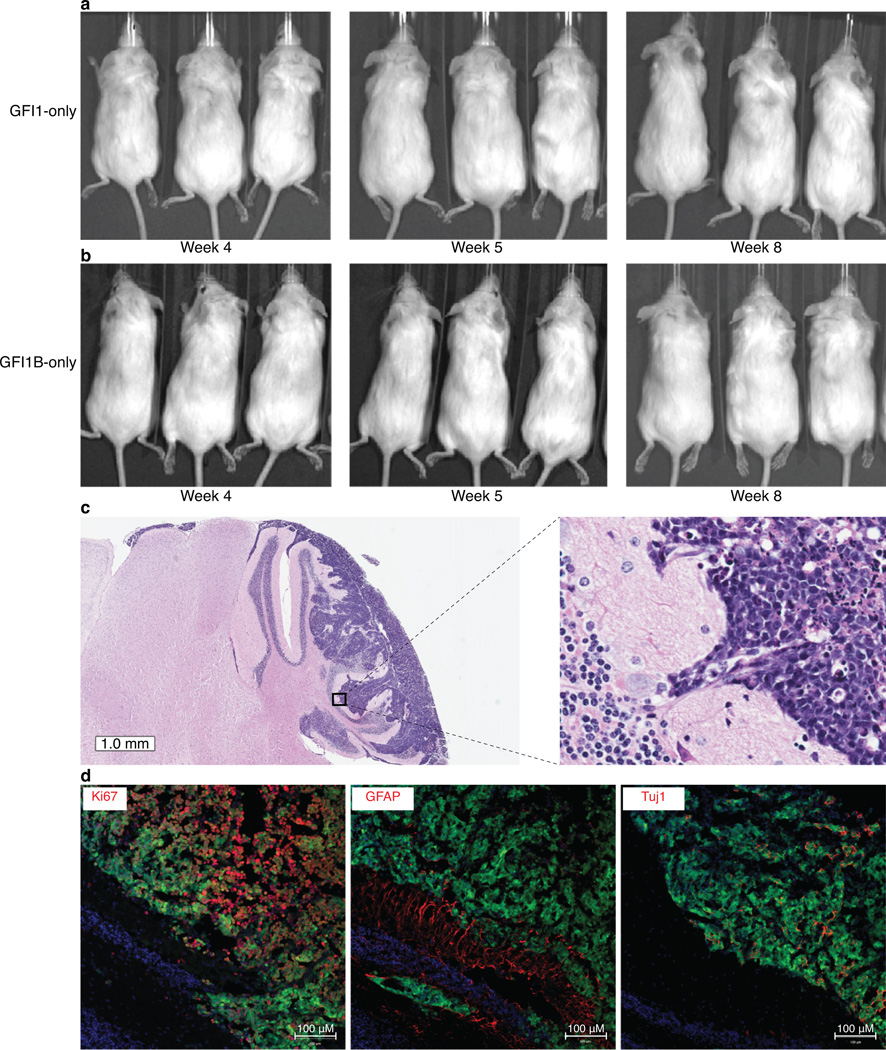
To further evaluate GFI1 and GFI1B as novel MB oncogenes, we utilised an orthotopic transplantation model21 whereby retroviruses encoding Gfi1 or Gfi1b were transduced either alone or in combination with Myc into neural stem cells followed by their transplantation into the cerebella of immunocompromised mice (Fig. 5a). Neither GFI1 nor GFI1B alone was sufficient to promote tumourigenesis in this system (Fig. 5c, Extended Data Fig. 9). When combined with MYC, however – which is likewise insufficient to generate MB on its own in this system21 – both GFI1 (i.e., MYC + GFI1, MG) and Gfi1b (i.e., MYC + GFI1B, MGB) rapidly produced highly aggressive cerebellar tumours in nearly all recipient mice within 4–5 weeks (n=37/42 and 19/21 with median survival time of 38 days and 26 days for MG and MGB, respectively; Fig. 5b–f).
Figure 5. GFI1 and GFI1B cooperate with MYC to promote MB in mice.
(a) Strategy for evaluating Gfi1/Gfi1b as putative MB oncogenes. (b) Whole-mount images of GFP-expressing MG (MYC + GFI1) and MGB (MYC + GFI1B) tumours. (c) Survival curves for animals receiving 1×10⁵ cells infected with viruses carrying the indicated transgenes. (d) Bioluminescent imaging of recipient animals at the indicated time points. X’s denote animals necessitating sacrifice prior to reaching the indicated time point. (e) H&E staining of cerebellar sections derived from MG tumour-bearing mice. (h) Immunofluorescence imaging of MG tumours stained with the indicated antibodies. (i) Subgroup probabilities for Ptch1+/−, MG, and MGB models based on cross-species molecular classification.
Cerebellar sections derived from either MG or MGB recipient animals showed large masses of infiltrating tumour cells with marked cellular pleomorphism, morphologically consistent with large cell, anaplastic (LCA) MB (Fig. 5e, Extended Data Fig. 9). LCA histology is significantly more prevalent in Group 3 MB (~20–25% of cases) than in other MB subgroups6,7. Metastatic dissemination was also noted in 30–50% of MG and MGB tumour-bearing mice (Fig. 5d and data not shown), paralleling the high frequency of metastasis seen in Group 3 MB patients6,7. Moreover, immunofluorescence microscopy confirmed that MG and MGB tumours are highly proliferative and express neuronal but not glial lineage markers (Fig. 5f, Extended Data Fig. 9), consistent with a MB-like immunophenotype. Transcriptional profiling and subsequent multidimensional scaling analysis demonstrated a notable similarity between the GFI1- and GFI1B-driven models and confirmed an expression signature consistent with human Group 3 MB counterparts, suggesting these models recapitulate molecular characteristics of the human disease (Fig. 5j, Extended Data Fig. 9).
Discussion
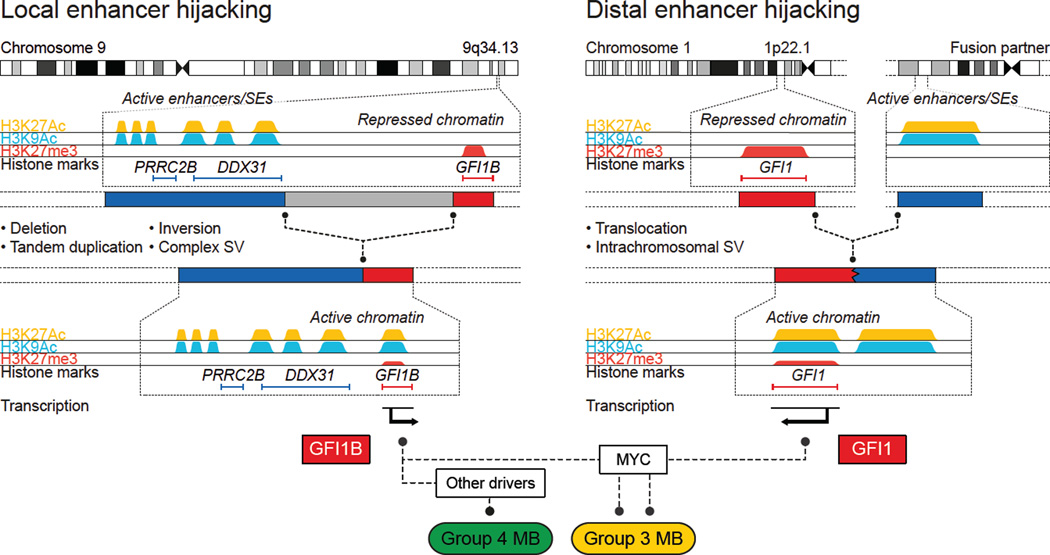
MB sequencing studies have highlighted the intertumoural molecular heterogeneity underpinning this malignancy, revealing very few recurrently mutated driver genes, especially in Group 3 and Group 45. Herein, we have identified somatic genomic rearrangements in association with mutually exclusive GFI1 and GFI1B activation in approximately one third of Group 3 MBs – now qualifying these oncogenes as the most prevalent drivers in this subgroup (Fig. 6). Moreover, 5–10% of Group 4 MBs harbour analogous SV associated with GFI1/GFI1B activation, reinforcing the notion that these subgroups share some biological similarities6,7.
Figure 6. Summary of inferred mechanisms underlying GFI1/GFI1B activation in MB.
Predominant mechanisms of SV and corresponding genomic redistribution of strong enhancers, including SEs, observed in GFI1/GFI1B-activated MBs. Activation of GFI1/GFI1B occurs in a mutually exclusive manner in either Group 3 or Group 4 and both oncogenes can cooperate with MYC to promote MB pathogenesis.
The verification of diverse SVs in nearly all GFI1/GFI1B-activated MBs analysed in this study has implications for future cancer genome studies. Conventional approaches for identifying genes recurrently targeted by SV in cancer usually focus on minimal common regions of aberration and require that putative gene targets are (at least partially) included within these altered regions9. In contrast to the high-level amplifications known to target MYC, MYCN, and other recognised MB oncogenes 3,8 – GFI1 and GFI1B are not amplified in MB. Observations extracted from the current study revealed that (i) a considerable proportion of SVs leading to GFI1/GFI1B activation do not actually include the target gene itself and (ii) multiple distinct classes of SV including duplication, deletion, inversion, and other complex rearrangements can converge on activation of a single target, often without associated gene-level copy-number change. Our findings suggest that similar mechanisms leading to gene deregulation (i.e., activation of oncogenic drivers) might have thus far been overlooked in other cancers.
SV-dependent redistribution of GFI1 and GFI1B from regions of transcriptionally silent chromatin to regions populated with active enhancers, such as SEs (Fig. 6), underscores the growing diversity of our appreciation for the interplay between the cancer genome and epigenome26–28. GFI1/GFI1B activation seemingly does not rely on specific epigenetic deregulation but rather implicates a form of ‘enhancer hijacking’ whereby oncogene activation hinges on the appropriation of a physiologically active epigenetic state from proximal or distant loci, including those mapping to other chromosomes. This concept of merging oncogenes with active regulatory elements has long been observed in lymphoid malignancies, where translocations are known to relocate MYC, BCL2, and other oncogenes adjacent to highly active promoter or enhancer loci, most commonly those belonging to the immunoglobulin genes (i.e., IgH/IgL loci) or T cell receptors (i.e., TCR-α/β loci)29. To the best of our knowledge, this is the first report to substantiate such a phenomenon in brain tumours.
In summary, we have discovered a series of highly variable genomic rearrangements leading to oncogene activation in a significant proportion of cases from poorly understood MB subgroups, implicating GFI1 and GFI1B as novel oncogenic drivers worthy of pursuit as candidates for molecularly targeted therapy. The patterns of rearrangement associated with GFI1/GFI1B activation described herein have broad-reaching implications for cancer genomics, and warrant the implementation of similar efforts to revisit existing sequencing data using analytical approaches that extend beyond the coding genome. Based on our observations, it is tempting to speculate that similar ‘enhancer hijacking’ may be equally prevalent in other solid cancers.
Methods summary
All patient material included in this study was collected after receiving informed consent from the patients and their families. MB samples were collected at first resection, prior to adjuvant chemo- or radiotherapy. Full details on the sequencing cohorts included in this report are summarised in Supplemental Table 1. MB subgroups were assigned using gene expression array data, a custom nanoString CodeSet, DNA methylation profiling, or a combination of the above, as previously described7,30, 31. WGS and long-range paired-end mapping were performed as described2,3. WGBS and DNA methylation analysis was conducted as described by Hovestadt et al (In Press). Chromatin extraction, immunoprecipitation, and library preparation for ChIP-seq studies was performed using proprietary methods at Active Motif (Carlsbad, CA). H3K27Ac and H3K9Ac peaks were called using BayesPeak32. SEs were inferred using the ROSE algorithm with default parameters as described28. Affymetrix expression array profiling of human and mouse tumour RNAs was performed at core facilities within the Amsterdam Medical Centre (Amsterdam, Netherlands), German Cancer Research Center (Heidelberg, Germany), and The Hospital for Sick Children (Toronto, Canada). Mouse studies were conducted at the Sanford-Burnham Medical Research Institute and Sanford Consortium for Regenerative Medicine Animal Facilities in accordance with national regulations using procedures approved by the Institutional Animal Care and Use Committees at Sanford-Burnham and the University of California San Diego. A complete description of the materials and methods is provided in the Online Methods section.
Online Methods
General statistical methods
All statistical tests were performed in the R Statistical Environment (R version 3.0.0) unless otherwise specified. The Kolmogorov-Smirnov test was used to compare candidate gene expression in chr9q34 SV cases to non-SV cases. Differential expression of GFI1 and GFI1B across MB subgroups was calculated using ANOVA. Enrichment of underlying locus-specific SVs in GFI1/GFI1B-expressing cases was calculated using Fisher’s Exact Test. Mutual exclusivity of GFI1 and GFI1B expression in Group 3 and Group 4 MBs was determined using Fisher’s Exact Test. Survival analyses were performed in GraphPad Prism 5 using the Log-rank (Mantel-Cox) test to compare survival differences between groups.
Sample collection and preparation
An Institutional Review Board ethical vote (Ethics Committee of the Medical Faculty of Heidelberg) was obtained according to ICGC guidelines (www.icgc.org), along with informed consent for all participants. No patient underwent chemotherapy or radiotherapy prior to surgical removal of the primary tumour. Tumour tissues were subjected to neuropathological review for confirmation of histology and for tumour cell content >80%. Analytes were isolated as previously described2. Cells were cultured at 37°C with 5% CO2. D425_Med MB cells (D425; a kind gift from Professor Darrell D. Bigner, Duke University) were cultured in DMEM with 10% FCS (Life Technologies) and regularly authenticated and tested for mycoplasma (Multiplexion, Heidelberg, Germany). Validation samples for WGS were obtained in accordance with the Research Ethics Board at The Hospital for Sick Children (Toronto, Canada)
High-throughput sequencing data generation
Short-insert paired-end sequencing
Samples were processed and libraries sequenced as previously described2.
MB and germline WGS data4 generated by the Pediatric Cancer Genome Project (http://explore.pediatriccancergenomeproiect.org/) was accessed from The European Genome-phenome Archive (Study ID # EGAS00001000347). The original alignments of this WGS data were performed against either reference genome hg18 or hg19. For comparability with our data, the alignment files in hg18 have been converted to FASTQ files using Picard tools [http://picard.sourceforge.net] providing the ‘SamToFastq’ option. For the alignment of the FASTQ files, the same reference genome as utilized in the creation of the original hg19 BAM files has been used along with BWA for alignment and Picard for merging and duplicate read filtering.
Long-range paired-end sequencing data generation
Long-range (or ‘Mate-pair’) DNA library preparation was carried out as previously described2 or using the newer Nextera Mate Pair Sample Preparation Kit (Illumina). In brief, 4 µg of high molecular weight genomic DNA were fragmented by the Tagmentation reaction in 400 ul, followed by the strand displacement and AMPure XP (Agencourt) cleanup reaction. Samples were size selected to 4–6 kb with a gel step following the Gel-Plus path of the protocol. 300–550 ng of size-selected DNA were circularized in 400 ul for 16 hours at 30°C. The library was then constructed after an exonuclease digestion step to get rid of remaining linear DNA, fragmentation to 300–700 bp with a Covaris S2 instrument (LGC Genomics), binding to streptavidin beads and Illumina Truseq adapter ligation. Final library was obtained after PCR for 1min @ 98°C, followed by 9 cycles of 30sec @ 98°C, 30sec @ 60°C, lmin @ 72°C and a final 5min @ 72°C step. Deep sequencing was carried out with the Illumina HiSeq2000 (2×101bp) instrument to reach an average physical coverage of 20–30×.
ChIP sequencing
Chromatin extraction, immunoprecipitation, and library preparation for ChIP-seq were performed at Active Motif (Carlsbad, CA) according to proprietary methods. Briefly, 15ug of chromatin were used as input for ChIP with ChIP-grade antibodies recognizing H3K27Ac (AM#39133, Active Motif), H3K9Ac (AM#39918, Active Motif), or H3K27me3 (#07–449, Millipore). Libraries were sequenced on the Illumina HiSeq 2000 platform using 2×101 cycles according to the manufacturer’s instructions.
Whole-genome bisulphite sequencing
Whole-genome bisulphite library preparation was carried out as recently described33, with modifications to a previously published protocol34. In brief, 5µg of genomic DNA were sheared using a Covaris device (Covaris Inc.). After adapter ligation, DNA fragments with insert lengths of 200–250 bp were isolated using an E-Gel electrophoresis system (Life Technologies) and bisulphite converted using the EZ DNA Methylation kit (Zymo Research). PCR amplification of the fragments was performed in six parallel reactions per sample using the FastStart High Fidelity PCR kit (Roche). Library aliquots were then pooled per sample and sequenced on an Illumina HiSeq 2000 machine.
RNA sequencing
RNA quality control was performed using the 2100 Bioanalyzer platform (Agilent). RNA sequencing libraries were prepared using the TruSeq stranded protocol with Ribo-Zero Gold (Illumina) and sequenced on the Illumina HiSeq 2000 platform with 2×51 cycles according to the manufacturer’s instructions.
High-throughput sequencing data analysis
Whole-genome sequencing
Short-insert WGS data was analyzed as previously described2. Long-range paired-end sequencing reads were aligned to the hg19 assembly of the human reference genome using the Illumina-provided alignment software (ELAND, version 2).
Structural variant discovery and filtering
Deletions, tandem duplications, inversion, translocations, as well as complex rearrangements resulting in the corresponding paired-end signatures were inferred using DELLY v0.0.1135. We considered all those predictions as somatic that were not present in a set of 1,000 Genomes Project (1000GP; http://1000genomes.org)36 samples corresponding to germline samples taken from normal healthy individuals. Specifically, we used DELLY to infer variants in 1,106 healthy samples belonging to phase 2 and phase 3 of the 1000GP. Furthermore, we inferred variants in the germline samples belonging to the studied tumours. For a given tumour sample, we considered all those variants as somatic that were present neither in any of the 1000GP samples nor in any of the additional germline samples. Two SVs were considered as identical if their start and end coordinates differed by less than 5.0 kb (approximate insert size of a long-range paired-end library) and if their reciprocal overlap was larger than 50%. Variants that were present in the control samples were either true germline variants or represented artifacts caused by misalignment of reads (e.g., due to inaccuracies within the human reference genome). To consider a variant prediction as high confident we further required at least four supporting read pairs with a minimum median mapping quality of 20 for each event to exclude false positive predictions caused by randomly mapping low quality reads.
Region identification
We divided the human reference genome into overlapping 1 Mb windows (100 kb offset). For each window, we counted the number of samples with at least one SV breakpoint in the given region (based on short-insert as well as long-insert paired-end sequencing data). Only focal high-confident SV predictions were used in this analysis (20 kb – 10 Mb in size). Windows affected in at least five samples were investigated manually.
Copy-number analysis
We determined the number of sequencing reads per non-overlapping genomic window of size 250 bp (high-coverage paired-end data) or 1,000 bp (low-coverage long-range paired-end data) for tumour samples with chr9q34 or chr1p22 SV and their corresponding controls. Tumour values were normalised by the ratio of read counts between tumour and controls within a 500 kb region. Subsequently, for each window, the log2 ratio between normalised tumour and control counts was determined. These values were averaged along a sliding window of 5 kb (short-insert paired-end data) or 10 kb (long-range paired-end data). For tumour samples without a matching control sample, the control of ICGC_MB230 was used.
ChIP sequencing
Histone ChIP-seq data for H3K27Ac, H3K9Ac, and H3K27me3 was processed by the Illumina analysis pipeline (version 1.8.3) and aligned to the Human Reference Genome (assembly hg19, GRCh37) using BWA version 0.5.9-r1637. Putative PCR duplicates were filtered using Picard MarkDuplicates [http://picard.sourceforge.net]. For downstream analyses, we generated whole-genome coverage tracks with reads normalised to all properly paired reads (RPM, paired-end reads/fragments per million). We used igvtools version 2.2.2 [http://www.broadinstitute.org/igv/igvtools] and the non- default parameter --pairs and a window size of 25. For peak-calling of histone marks, ChIP-seq data for each histone modification (H3K27Ac or H3K9Ac), was used to generate individual BED files for analyzed samples using BEDTools38. Individual BED files were then combined for each histone modification and peaks were called using the Bioconductor BayesPeak package in R32. SEs were identified using the ROSE algorithm with default parameters (stitching distance of 12,500 bp and promoter exclusion region of ±2,000 bp around TSS)28. Briefly, peaks called via BayesPeak were used as constituent enhancers to run the algorithm and SEs were called by ranking of H3K27Ac signal at stitched constituent enhancers.
Whole-genome bisulphite sequencing
WGBS sequencing data was analysed using methylCtools (Hovestadt et al., manuscript in preparation). In brief, methylCtools builds upon BWA and adds functionality for aligning bisulphite treated DNA to a reference genome in a similar manner as described previously39. Sequencing reads were adapter-trimmed using SeqPrep [https://github.com/jstiohn/SeqPrep] and translated to a fully C-to-T converted state. Alignments were performed against a single index of both in silico bisulphite-converted strands of the human reference genome (hg19, NCBI build 37.1) using BWA version 0.6.1-r10437 and the non-default parameters -q 20 -s. Previously translated bases were translated back to their original state, and reads mapping antisense to the respective reference strand were removed. Putative PCR duplicates were filtered using Picard MarkDuplicates [http://picard.sourceforge.net]. Non-conversion rates were estimated on the basis of lambda phage genome spike-ins. Single base pair methylation ratios (beta-values) were determined by quantifying evidence for methylated (unconverted) and unmethylated (converted) cytosines at all CpG positions. Only properly paired or singleton reads with mapping quality of ≥1 and bases with Phred-scaled quality score of ≥20 were considered. To account for population variability, we filtered CpGs for which more than 25% of reads at a given position (on either strand) were not supportive of this CpG being in fact a CpG in the sample being analysed. Subsequently, information from both strands was combined and CpGs with coverage less than five reads were set as NA.
RNA sequencing
Demultiplexed FASTQ files were generated using the Bcl2FastQ conversion software (Illumina, version 1.8.4). The resulting sequencing reads were aligned to the human genome reference build hg19 (version human_g1k_v37 – 1,000 Genomes Project Phase 1) using BWA version 0.5.9-r1637 with default parameters. Only the chromosomes 1–22, X, Y and M were used for the mapping. Read coverage plots were prepared using the UCSC Genome Browser showing the number of aligned reads for each genomic position per million mapped reads (RPM) with mapping quality MAPQ>1. The sequencing reads were also used as input for the TopHat2-Fusion algorithm40 for detection of gene fusion breakpoints.
Allelic analysis
Germline SNPs were determined using Samtools and BCFtools. For each SNP, the number of reads in the tumour DNA-, RNA-, and ChIP-Seq data supporting the alternative or the reference allele were counted using Samtools mpileup. Only bases with phred score >20 were considered. Only heterozygous SNPs covered by at least 4 sequencing reads in each data set were included in the final summary.
PCR and Sanger sequencing validation of structural variants
PCR experiments were performed as follows: 10 ng of genomic DNA were used with the SequalPrep Long PCR Kit (Invitrogen) in 20 µl volumes using the following PCR conditions in a MJ Mini thermocycler (BioRad): 94C for 3 min, followed by 10 cycles of 94C for 10 s, 62C for 30 s and 68C for 6 min and 25 cycles of 94C for 10 s, 60C for 30 s and 68C for 7 min, followed by a final cycle of 72C for 10 min. PCR products were analyzed on a 1% agarose gel stained with Sybr Safe Dye (Invitrogen). Gel extracted bands using the NucleoSpin Gel and PCR Clean-up Kit (Macherey-Nagel) were capillary sequenced at GATC Biotech AG to analyse SV breakpoints.
Expression array processing and data analysis
General array processing
For gene expression array profiling of human MBs and normal cerebellar controls, high-quality RNAs were processed and hybridized to either (i) the Affymetrix Gene 1.1 ST array at The Centre for Applied Genomics (TCAG, Toronto, Canada) or (ii) the Affymetrix U133 Plus2.0 expression array at the Microarray Department of the University of Amsterdam (Amsterdam, the Netherlands). Sample library preparation, hybridisation, and quality control were performed according to protocols recommended by the manufacturer. The CEL files were quantile normalised using Expression Console (v1.1.2; Affymetrix, USA) and signal estimates determined using the RMA algorithm.
Mouse MBs, non-neoplastic cerebellar stem cells (NSCs), and normal mouse cerebella were analyzed using the Affymetrix Mouse Genome 430 2.0 expression array according to the manufacturer’s instructions at the DKFZ Genomics and Proteomics Core Facility (Heidelberg, Germany). The CEL files were quantile normalised using Expression Console (v1.1.2; Affymetrix, USA) and signal estimates determined using the RMA algorithm.
Merging of expression array platforms
Gene expression array data generated using the Affymetrix Gene 1.1 ST array and U133 Plus2.0 array platforms was merged in order to generate a combined series that would facilitate more streamlined downstream analyses. For each platform, a contrast value per gene was calculated by subtracting the mean expression of that gene across all samples hybridized on that platform from each individual sample (see formula below), and the resulting contrast values of the two platforms were then combined.
ContrastgeneA in SampleX = GeneA expression in SampleX - mean (GeneA expression)
This method minimised possible batch effects existing between the two array platforms and allowed for downstream analyses containing the combined series.
Identification of GFI1- and GFI1B-activated medulloblastomas
After combining the gene expression data for the two expression array platforms, for both GFI1 and GFI1B, expression values were modeled by fitting two normal distributions to the data using the R package ‘mclust’41. With a P value cut-off of P<.0001, threshold expressions for GFI1 and GFI1B were identified as contrast scores of 0.64 and 0.65, respectively. Samples having expression greater than or equal to the thresholds were called as GFI1- or GFI1B-activated.
Pathway analysis
MB expression array profiles (Affymetrix Gene 1.1 ST) were used to fit a linear model for each gene using Group 3 status, GFI1 expression, and GFI1B expression as covariates. The R package ‘limma’ was used to perform these fits. The average rank of the statistical significance of the GFI1 and GFI1B coefficients was used to perform a Mann-Whitney U test for a given collection of genes (the null hypothesis being that the genes in a gene set are not ranked any higher than those which are not). In cases where multiple probes matched a single gene, the higher-ranking probe was used. The gene sets contained in the c2-c6 collections from the Molecular Signatures Database (MSigDB) were tested42. The P values obtained for each gene set in a collection underwent a Benjamini-Hochberg correction to correct for multiple testing.
Cross-species comparisons of human and mouse medulloblastomas
Human MB samples were analyzed on the Affymetrix U133Plus2 platform and normalized by the MAS5 algorithm. Mouse tumours were analyzed on the Affymetrix Mouse Genome 430 2.0 platform and similarly normalized by MAS5 using the ‘affy’ (v1.38) package within the R Statistical Environment (v 3.0.2). Human and mouse expression profiles were matched by homologs using official gene symbols and filtered for genes that exhibit conserved expression across 32 matched human and mouse tissues43 as determined by Pearson correlation tests with multiple hypotheses correction using the Benjamini-Hochberg false discovery rate method (FDR < 0.1). Mouse adult cerebellum, fetal cerebellum and Ptch1+/− MB samples were matched against the most similar human adult cerebellum, fetal cerebellum and SHH MB samples, respectively, by Pearson correlation of expression profiles. Subsequently, these matched sample pairs were designated as replicate samples for cross-platform calibration by the Linear Cross-Platform Integration of Microarray Data (LTR) algorithm44 as implemented in the ‘LTR’ package (v 1.0.0).
Following gene filtering and expression calibration, the human and mouse expression profiles were combined and analyzed by multidimensional scaling. The first two dimensions were disregarded, as expression differences between human and mouse dominated them. The third dimension was identified as the MB subgroup spectrum, since the coordinate values discriminate samples from different human MB subgroups. Using this molecular subgroup spectrum, mouse samples were classified using a Bayesian classifier initialized with a uniform prior. The posterior probabilities were calculated as the normalized product of the prior and the likelihood of Gaussian distribution parameters with mean and variance estimates from each of the human MB subgroups.
Luciferase enhancer assays
Candidate enhancer regions were amplified by PCR using the primer sets listed below and cloned into the pGL4.24[luc2P/minP] Vector (Promega) containing a multiple cloning region for insertion of a response element of interest upstream of a minimal promoter and the luciferase reporter gene, luc2P.

For evaluation of enhancer activity, D425 Group 3 MB cells were plated on 6-well plates. At 50% confluence, cells were transfected in triplicate with 2.25 ug of the pGL4.24 reporters carrying the DDX31 DNA fragments plus 0.25ug of phRL-TK encoding Renilla luciferase. Two days post-transfection, the cells were harvested, followed by measurement of luciferase activities using the Dual-Glo Luciferase Assay System (Promega). As a control, the pGL4.24 empty vector was included for calibration of activity obtained with the experimental constructs. The luminescence of the Firefly Luciferase was normalized to the Renilla Luciferase signal obtained from the phRL-TK vector and data was presented as the mean delta-fold activity (Firefly Luciferase/Renilla Luciferase) of experimental transfectants compared to the pGL4.24 empty vector transfectants.
Immunohistochemical and FISH analysis of human medulloblastoma samples
Immunohistochemistry (IHC) and FISH were performed on FFPE MB sections as previously described7. Monoclonal GFI1 (clone 3G8, Sigma) and polyclonal GFI1B (HPA007012, Sigma) antibodies were used at working dilutions of 1:100 with an incubation time of 1 hour @ 32°C using the Ventana protocol cc1.
Mouse models
Animals
C57BL/6 mice (males and females) were used as a source of cerebellar stem cells and immunocompromised (NOD-scid IL2Rgammanull, NSG) female mice were used as transplantation hosts. Mice were bred and maintained at the Sanford Burnham and Sanford Consortium Animal Facilities. Experiments were performed in accordance with national regulations using procedures approved by the Institutional Animal Care and Use Committees at SBMRI and the University of California San Diego. No a priori calculations related to sample size were performed. No specific randomization or blinding was performed.
Isolation of cerebellar stem cells
Cerebellar stem cells were isolated as previously described. Briefly, neonatal (p4-p6) cerebella from wildtype C57BL/6 mice were dissected out and enzymatically dissociated into single cell suspension. Cells were subjected to Percoll fractionation (GE Healthcare Life Sciences #17-0891-02) and stained (anti-mouse CD133 PE, eBioscience #12-4301-82) and sorted for the Promininl+ (Proml+) population (approximately 3–4% of cells).
Retroviral constructs
Retroviruses employed in this study included, MSCV-c-Myc T58A-IRES-GFP21, MSCV-Gfi1-IRES-GFP, MSCV-Gfi1-IRES-Luc, MSCV-Gfi1b-IRES-GFP, and MSCV-Gfi1b-IRES-Luc. To create the Gfi1 and Gfi1b viral constructs, cDNAs were PCR-amplified and cloned into MSCV-IRES-GFP and MSCV-IRES-Luc. Gfi1 and Gfi1b were PCR-amplified from pCMV6-Gfi1 (#MC208542, OriGene) and pCMV6-Gfi1b (MC201880, OriGene), respectively, and EcoRI and XhoI restriction sites were added to the cDNA ends.
Gfi1 PCR primers
Forward 5'-3': GAA TTC ACC ATG CCG CGC TCA TTC CTG GTC
Reverse 5'-3': CTC GAG TCA TTT GAG TCC ATG CTG ACT CTC.
Gfi1b PCR primers
Forward 5'-3': GAA TTC ACC ATG CCA CGG TCC TTT CTA GTG
Reverse 5'-3': CTC GAG TCA CTT GAG ATT GTGTTG ACT CTC.
The PCR-amplified products were blunt-end-ligated into pJET1.2 (CloneJET PCR Cloning Kit, Thermo Scientific #K1231) and then cut with EcoRI and XhoI. The sticky-ended fragments were then ligated into the EcoRI/XhoI-digested MSCV-IRES-GFP and MSCV-IRES-Luc vectors.
Orthotopic transplantation and tumour formation
Prior to transplantation, cerebellar stem cells (Proml+ cells) were infected with retroviruses encoding MycT58A and Gfi1- or Gfi1b for 20 hours. Next, 1×10⁵ transduced cells were re-suspended in Neurocult NSC Basal medium (Stem Cell Technologies, cat #05700) with Neurocult NSC Proliferation Supplement (Stem Cell Technologies, cat #05701) and injected into the cerebella of NSG mice (6–8 weeks old) using a stereotactic frame equipped with mouse adaptor (David Kopf Instruments). Animals were monitored weekly and sacrificed when they showed symptoms of MB. At time of sacrifice, brains were removed for tumour dissection and dissociation or for embedding and sectioning.
Tissue sectioning and staining
Mouse brains were fixed with 4% paraformaldehyde and embedded in either paraffin or O.C.T. Samples for histological analysis were paraffin-embedded, sectioned, and stained with H&E by the Sanford Burnham Histopathology Core Facility. Samples frozen in O.C.T. were sectioned using a Leica CM3050S cryostat. Cryosections were stained overnight with primary antibodies against proliferation (anti-Ki67, Abcam ab15580) and lineage markers (anti-GFAP, Novus Biologicals NB300-141; anti-β3-Tubulin, Cell Signaling #5568) and stained for 1 hour with fluorescent secondary antibodies (Alexa Fluor 568 Donkey Anti-Rabbit IgG, Invitrogen A10042). Sections were then counter-stained with DAPI (Cell Signaling #4083), mounted using Fluoromount G (Southern Biotech #0100-01), and imaged on a confocal (Zeiss LSM700) fluorescent microscope.
In Vivo Bioluminescent Imaging
Mice were anesthetized with 2.5% isoflurane and given intraperitoneal injections of 150 ng/g D-Luciferin (Caliper Life Sciences, cat#12279). Five minutes after injection, animals were imaged using the Xenogen Spectrum (IVIS-200) imaging system (Sanford Burnham and Sanford Consortium Animal Facilities).
Extended Data Figure Legends
Extended Data Figure 1. Recurrent somatic copy-number aberrations target a common region on 9q34.
Affymetrix SNP6 copy-number output for 22 primary MBs from the published8 MAGIC series exhibiting focal somatic copy-number aberrations within the 9q34 region of interest defined by WGS in the current study. Of the affected samples, MB subgroup information was available for 15/22 cases: SHH (n=1*), Group 3 (n=11), and Group 4 (n=3). Close examination of the single non-Group 3/Group 4 MB affected by a focal copy-number event in the region (MB-1318, SHH), revealed that this sample exhibits a homozygous deletion (in the context of broad chr9q deletion) specifically overlapping TSC1 and is therefore unlikely to be related to the events which target GFI1B for transcriptional activation. Indicated coordinates are based on the hg18 reference genome (NCBI Build 36.1) that was used in the original MAGIC study.
Extended Data Figure 2. Non-functional DDX31:GFI1B fusion transcripts detected by RNA-seq.
(a) A complex SV on 9q34 in ICGC_MB9 resulted in expression of DDX31 (exon 19) fused to GFI1B (intron 2, antisense orientation). Note the intronic reads in GFI1B after the fusion breakpoint. (b) 9q34 inversions in ICGC_MB247 resulted in expression of DDX31 (exon 19) fused to GFI1B (exon 2, sense orientation). This fusion transcript included a frameshift, inferred to generate a C-terminal-truncated DDX31 protein and no GFI1B protein from this fused allele.
Extended Data Figure 3. Expression and correlation of 9q34 genes in MB subgroups.
(a–c) Boxplots summarizing expression of BARHL1, DDX31, and GTF3C4 according to MB subgroup. Dataset includes 375 MBs profiled on the Affymetrix U133plus2 array. (d) Pearson correlation analysis showing correlated expression of DDX31 with BARHL1 and GTF3C4 in Group 3 and Group 4 MBs. DDX31 expression is positively correlated with both BARHL1 (r=0.741) and GTF3C4 (r=0.622). (e) PRRC2B expression in MB subgroups. Samples are from the same series summarized in (a–c). (f) Distribution of H3K27Ac ChIP-seq signal at predicted enhancers in Group 3 MBs (data for MAGIC_MB360 is shown). Enhancer regions are plotted in increasing order based on their input-normalized H3K27Ac signal. SEs are defined as the population of enhancers above the inflection point of the curve (horizontal dashed grey line). Positions of the predicted BARHL1/DDX31 and PRRC2B SEs described in the text are highlighted.
Extended Data Figure 4. Frequency and distribution of GFI1/GFI1B activation in MB subgroups.
(a) Stacked bar graph indicates the proportion of GFI1/GFI1B-expressing cases in each of the four MB subgroups, as determined by Affymetrix gene expression profiling of two independent cohorts (n=727). (b) Stacked bar graph indicates the proportion of GFI1/GFI1B-positive cases in each of the four MB subgroups, as determined by IHC performed with α-GFI1 and α-GFI1B antibodies on FFPE sections derived from a MB clinical trial cohort (HIT2000, NCT00303810; n=156). (c–f) Representative positive and negative IHC results for Group 3 MBs stained with α-GFI1 (c, d) and α-GFI1B (e, f) antibodies, respectively.
Extended Data Figure 5. Demographic and clinical characteristics of GFI1/GFI1B-activated Group 3 MB.
(a, b) Unsupervised hierarchical clustering of Group 3 MB samples profiled by Affymetrix gene expression array (a) or Illumina 450K DNA methylation array (b). (c) Patient characteristics, including age, gender, histological subtype (histology), and metastatic status (M-stage) for Group 3 MBs stratified according to GFI1/GFI1B expression status. Both gene expression and IHC cohorts are summarized. (d, e) Overall survival of Group 3 MBs stratified by GFI1/GFI1B expression status for both our gene expression (d) and IHC series (e).
Extended Data Figure 6. Summary of GFI1 SVs detected by WGS in Group 3 MB.
(a) Schematics depicting the six different GFI1 translocations detected by large-insert paired-end sequencing of our GFI1-activated validation series. (b) WGS coverage plots showing SVs affecting the GFI1 locus in GFI1-activated MBs sequenced in our series. (c) Fluorescence in situ hybridization (FISH) analysis of MAGIC_MB1338 validating the unbalanced t(1:9) translocation (shown in (a)) predicted by WGS.
Extended Data Figure 7. Chromatin states proximal to SVs observed in GFI1-activated Group 3 MBs.
(a–d) ChIP-seq (H3K27Ac and H3K9Ac) and WGBS data respectively highlighting the active chromatin and methylation states present in the regions proximal to SV breakpoints identified in GFI1 translocation cases. (e) Schematic summarizing the series of focal tandem duplications observed approximately ~45 kb downstream of GFI1 in Group 3 MBs (n=3; ICGC_MB18 is shown as a representative case). Activating and repressive histone marks overlapping the region of interest are shown for a non-GFI1-activated Group 3 MB (MAGIC_MB360) and the tandem duplication case (ICGC_MB18).
Extended Data Figure 8. Association between GFI1/GFI1B activation and MYC in Group 3 MB.
(a) MYC expression in Group 3 MBs (n=168) according to GFI1/GFI1B activation status. (b) Genesets with significant enrichment in GFI1/GFI1B associated genes from the MSigDB c2 gene set collection. The collection highlighted in red is the only result found that shows a significant enrichment in both GFI1 and GFI1B associated genes and a clear connection to a known pathway. (c) Heatmap of the expression values for the 50 genes in the KIM_MYC_AMPLIFICATION_TARGETS_UP gene set with the most significant association with GFI1 or GFI1B expression (the complete gene set contains 187 profiled genes). Genes are ordered top to bottom from most to least significant. A set of 90 Group 3 MBs included in the analysis are displayed. Sample-wise hierarchical clustering was performed only to enhance the visual organization of the heatmap. (d) Affymetrix SNP6 copy-number output for 82 primary Group 3 MBs from the published MAGIC series, highlighting the incidence of MYC amplification in the context of GFI1/GFI1B-activation. MYC amplification was found at a comparable frequency in both GFI1-activated (n=2/14, 14.3%) and non-GFI1/GFI1B-activated (n=10/57, 17.5%) Group 3 MBs. Indicated coordinates are based on the hg18 (NCBI Build 36.1) reference genome that was used in the original MAGIC study.
Extended Data Figure 9. Phenotypic characteristics of novel Gfi1/Gfi1b orthotopic mouse models.
(a, b) Bioluminescent imaging of animals injected with either Gfi1- (a) or Gfi1b-expressing (b) neural stem cells at the indicated time points. No tumour signal was detectable in these animals. (c) H&E staining of cerebellar sections derived from MGB tumour-bearing mice. (d) Immunofluorescence imaging of cerebellar sections from MGB tumours stained with the indicated antibodies.
Supplementary Material
Acknowledgements
For technical support and expertise we thank: the DKFZ Genomics and Proteomics Core Facility; Bettina Haase, Dinko Pavlinic, and Bianka Baying (EMBL Genomics Core Facility); Malaika Knopf (NCT Heidelberg); the Sanford-Burnham Animal Facility and Cell Imaging, Tissue & Histopathology Shared Resource; and the UCSD Flow Cytometry Core Facility. We also thank Active Motif for the preparation of histone ChIP libraries.
This work was principally supported by the PedBrain Tumor Project contributing to the International Cancer Genome Consortium, funded by the German Cancer Aid (109252) and by the German Federal Ministry of Education and Research (BMBF, grants #01KU1201A, MedSys #0315416C and NGFNplus #01GS0883). Additional support came from the German Cancer Research Center – Heidelberg Center for Personalized Oncology (DKFZ-HIPO), Dutch Cancer Foundations KWF (2010–4713) and KIKA (M.Ko.), the CancerSys grant MYC-NET (German Federal Ministry of Education and Research, BMBF, #0316076A), the European Commission (Health-F2-2010-260791), and the Helmholtz Alliance PCCC (grant no. HA-305). PAN is a Roman Herzog Postdoctoral Fellow funded by the Hertie Foundation and the DKFZ. RWR is the recipient of a Research Leadership Award from the California Institute for Regenerative Medicine (CIRM LA1-01747) and obtained additional support from the National Cancer Institute (5P30CA030199 and R01 CA159859), and the CureSearch National Childhood Cancer Foundation.
Footnotes
Author Contributions
PAN, C.L., T.Z., A.M.S., D.K., L.A.E., W.W., A.W., S.St., L.S., H.S-C., L.L., F.K., J.F., B.R., S.Sc., N.D., S.Wo., T.R., C.C.B., P.v.S., and A.K. performed and/or coordinated experimental or technical work.
PAN, T.Z., S.E., D.J.H.S., V.H., M.Z., S.Z., G.B., N.I, IB., C.D.I., G.Z., J.E., R.Vo., J.K. and J.O.K. performed and/or coordinated data analysis.
M.Re., F.C., S.V., M.Ry., E.T., P.H., E.S., A.D., P.S., J.S., K.Z., D.Su., M.U.S., M.E., H.L.G., G.W.R., A.G, M.M., K.v.H., S.R., T.P., W.S., R.J.G., A.K., and M.D.T. contributed data, provided reagents, or patient materials.
P.A.N., C.L., T.Z., S.E., D.J.H.S., V.H., D.St., D.T.W.J., M.K., S.Z., H-J. W., R.J.G., M.D.T., P.Li. J.O.K., R.W.R., and S.M.P. prepared the initial manuscript and display items.
P.A.N., G.B., S.Wi., B.B., C.L., M-L.Y., U.D.W., C.v.K., R.V., G.R., A.E.K., A.v.D., O.W., R.E., P.Li., J.O.K., R.W.R., and S.M.P. provided project leadership.
P.A.N., J.O.K., R.W.R., and S.M.P. co-conceived and led the study.
Short-read sequencing data have been deposited at the European Genome-Phenome Archive (EGA, http://www.ebi.ac.uk/ega/) hosted by the EBI, under accession number EGAS00001000215. Reprints and permissions information is available at www.nature.com/reprints.
The authors declare no competing financial interests.
Readers are welcome to comment on the online version of this article at www.nature.com/nature.
References
- 1.Ostrom QT, et al. CBTRUS statistical report: Primary brain and central nervous system tumors diagnosed in the United States in 2006–2010. Neuro Oncol. 2013;15(Suppl. 2):ii1–ii56. doi: 10.1093/neuonc/not151. [DOI] [PMC free article] [PubMed] [Google Scholar]
- 2.Jones DT, et al. Dissecting the genomic complexity underlying medulloblastoma. Nature. 2012 doi: 10.1038/nature11284. [DOI] [PMC free article] [PubMed] [Google Scholar]
- 3.Rausch T, et al. Genome sequencing of pediatric medulloblastoma links catastrophic DNA rearrangements with TP53 mutations. Cell. 2012;148:59–71. doi: 10.1016/j.cell.2011.12.013. [DOI] [PMC free article] [PubMed] [Google Scholar]
- 4.Robinson G, et al. Novel mutations target distinct subgroups of medulloblastoma. Nature. 2012 doi: 10.1038/nature11213. [DOI] [PMC free article] [PubMed] [Google Scholar]
- 5.Northcott PA, et al. Medulloblastomics: the end of the beginning. Nat Rev Cancer. 2012;12:818–834. doi: 10.1038/nrc3410. [DOI] [PMC free article] [PubMed] [Google Scholar]
- 6.Cho YJ, et al. Integrative genomic analysis of medulloblastoma identifies a molecular subgroup that drives poor clinical outcome. J Clin Oncol. 2011;29:1424–1430. doi: 10.1200/JCO.2010.28.5148. [DOI] [PMC free article] [PubMed] [Google Scholar]
- 7.Northcott PA, et al. Medulloblastoma comprises four distinct molecular variants. J Clin Oncol. 2011;29:1408–1414. doi: 10.1200/JCO.2009.27.4324. [DOI] [PMC free article] [PubMed] [Google Scholar]
- 8.Northcott PA, et al. Subgroup-specific structural variation across 1,000 medulloblastoma genomes. Nature. 2012;488:49–56. doi: 10.1038/nature11327. [DOI] [PMC free article] [PubMed] [Google Scholar]
- 9.Santarius T, Shipley J, Brewer D, Stratton MR, Cooper CS. A census of amplified and overexpressed human cancer genes. Nat Rev Cancer. 2010;10:59–64. doi: 10.1038/nrc2771. [DOI] [PubMed] [Google Scholar]
- 10.Kim TM, et al. Functional genomic analysis of chromosomal aberrations in a compendium of 8000 cancer genomes. Genome Res. 2013;23:217–227. doi: 10.1101/gr.140301.112. [DOI] [PMC free article] [PubMed] [Google Scholar]
- 11.Bhatia B, et al. Tuberous sclerosis complex suppression in cerebellar development and medulloblastoma: separate regulation of mammalian target of rapamycin activity and p27 Kip1 localization. Cancer Res. 2009;69:7224–7234. doi: 10.1158/0008-5472.CAN-09-1299. [DOI] [PMC free article] [PubMed] [Google Scholar]
- 12.Ernst J, et al. Mapping and analysis of chromatin state dynamics in nine human cell types. Nature. 2011;473:43–49. doi: 10.1038/nature09906. [DOI] [PMC free article] [PubMed] [Google Scholar]
- 13.Whyte WA, et al. Master transcription factors and mediator establish super-enhancers at key cell identity genes. Cell. 2013;153:307–319. doi: 10.1016/j.cell.2013.03.035. [DOI] [PMC free article] [PubMed] [Google Scholar]
- 14.Hock H, et al. Gfi-1 restricts proliferation and preserves functional integrity of haematopoietic stem cells. Nature. 2004;431:1002–1007. doi: 10.1038/nature02994. [DOI] [PubMed] [Google Scholar]
- 15.Person RE, et al. Mutations in proto-oncogene GFI1 cause human neutropenia and target ELA2. Nat Genet. 2003;34:308–312. doi: 10.1038/ng1170. [DOI] [PMC free article] [PubMed] [Google Scholar]
- 16.Saleque S, Cameron S, Orkin SH. The zinc-finger proto-oncogene Gfi-1b is essential for development of the erythroid and megakaryocytic lineages. Genes Dev. 2002;16:301–306. doi: 10.1101/gad.959102. [DOI] [PMC free article] [PubMed] [Google Scholar]
- 17.Gilks CB, Bear SE, Grimes HL, Tsichlis PN. Progression of interleukin-2 (IL-2)-dependent rat T cell lymphoma lines to IL-2-independent growth following activation of a gene (Gfi-1) encoding a novel zinc finger protein. Mol Cell Biol. 1993;13:1759–1768. doi: 10.1128/mcb.13.3.1759. [DOI] [PMC free article] [PubMed] [Google Scholar]
- 18.Scheijen B, Jonkers J, Acton D, Berns A. Characterization of pal-1, a common proviral insertion site in murine leukemia virus-induced lymphomas of c-myc and Pim-1 transgenic mice. J Virol. 1997;71:9–16. doi: 10.1128/jvi.71.1.9-16.1997. [DOI] [PMC free article] [PubMed] [Google Scholar]
- 19.Gibson P, et al. Subtypes of medulloblastoma have distinct developmental origins. Nature. 2010;468:1095–1099. doi: 10.1038/nature09587. [DOI] [PMC free article] [PubMed] [Google Scholar]
- 20.Goodrich LV, Milenkovic L, Higgins KM, Scott MP. Altered neural cell fates and medulloblastoma in mouse patched mutants. Science. 1997;277:1109–1113. doi: 10.1126/science.277.5329.1109. [DOI] [PubMed] [Google Scholar]
- 21.Pei Y, et al. An animal model of MYC-driven medulloblastoma. Cancer Cell. 2012;21:155–167. doi: 10.1016/j.ccr.2011.12.021. [DOI] [PMC free article] [PubMed] [Google Scholar]
- 22.Kawauchi D, et al. A mouse model of the most aggressive subgroup of human medulloblastoma. Cancer Cell. 2012;21:168–180. doi: 10.1016/j.ccr.2011.12.023. [DOI] [PMC free article] [PubMed] [Google Scholar]
- 23.Zhukova N, et al. Subgroup-specific prognostic implications of TP53 mutation in medulloblastoma. J Clin Oncol. 2013;31:2927–2935. doi: 10.1200/JCO.2012.48.5052. [DOI] [PMC free article] [PubMed] [Google Scholar]
- 24.Zornig M, Schmidt T, Karsunky H, Grzeschiczek A, Moroy T. Zinc finger protein GFI-1 cooperates with myc and pim-1 in T-cell lymphomagenesis by reducing the requirements for IL-2. Oncogene. 1996;12:1789–1801. [PubMed] [Google Scholar]
- 25.Schmidt T, et al. Zinc finger protein GFI-1 has low oncogenic potential but cooperates strongly with pirn and myc genes in T-cell lymphomagenesis. Oncogene. 1998;17:2661–2667. doi: 10.1038/sj.onc.1202191. [DOI] [PubMed] [Google Scholar]
- 26.Plass C, et al. Mutations in regulators of the epigenome and their connections to global chromatin patterns in cancer. Nat Rev Genet. 2013;14:765–780. doi: 10.1038/nrg3554. [DOI] [PubMed] [Google Scholar]
- 27.Shen H, Laird PW. Interplay between the cancer genome and epigenome. Cell. 2013;153:38–55. doi: 10.1016/j.cell.2013.03.008. [DOI] [PMC free article] [PubMed] [Google Scholar]
- 28.Hnisz D, et al. Super-enhancers in the control of cell identity and disease. Cell. 2013;155:934–947. doi: 10.1016/j.cell.2013.09.053. [DOI] [PMC free article] [PubMed] [Google Scholar]
- 29.Nambiar M, Kari V, Raghavan SC. Chromosomal translocations in cancer. Biochim Biophys Acta. 2008;1786:139–152. doi: 10.1016/j.bbcan.2008.07.005. [DOI] [PubMed] [Google Scholar]
- 30.Hovestadt V, et al. Robust molecular subgrouping and copy-number profiling of medulloblastoma from small amounts of archival tumour material using high-density DNA methylation arrays. Acta Neuropathol. 2013;125:913–916. doi: 10.1007/s00401-013-1126-5. [DOI] [PMC free article] [PubMed] [Google Scholar]
- 31.Northcott PA, et al. Rapid, reliable, and reproducible molecular subgrouping of clinical medulloblastoma samples. Acta Neuropathol. 2012;123:615–626. doi: 10.1007/s00401-011-0899-7. [DOI] [PMC free article] [PubMed] [Google Scholar]
- 32.Cairns J, et al. BayesPeak--an R package for analysing ChIP-seq data. Bioinformatics. 2011;27:713–714. doi: 10.1093/bioinformatics/btq685. [DOI] [PMC free article] [PubMed] [Google Scholar]
Supplementary References
- 33.Richter J, et al. Recurrent mutation of the ID3 gene in Burkitt lymphoma identified by integrated genome, exome and transcriptome sequencing. Nat Genet. 2012;44:1316–1320. doi: 10.1038/ng.2469. [DOI] [PubMed] [Google Scholar]
- 34.Lister R, et al. Hotspots of aberrant epigenomic reprogramming in human induced pluripotent stem cells. Nature. 2011;471:68–73. doi: 10.1038/nature09798. [DOI] [PMC free article] [PubMed] [Google Scholar]
- 35.Rausch T, et al. DELLY: structural variant discovery by integrated paired-end and split-read analysis. Bioinformatics. 2012;28:i333–i339. doi: 10.1093/bioinformatics/bts378. [DOI] [PMC free article] [PubMed] [Google Scholar]
- 36.Abecasis GR, et al. An integrated map of genetic variation from 1,092 human genomes. Nature. 2012;491:56–65. doi: 10.1038/nature11632. [DOI] [PMC free article] [PubMed] [Google Scholar]
- 37.Li H, Durbin R. Fast and accurate short read alignment with Burrows-Wheeler transform. Bioinformatics. 2009;25:1754–1760. doi: 10.1093/bioinformatics/btp324. [DOI] [PMC free article] [PubMed] [Google Scholar]
- 38.Quinlan AR, Hall IM. BEDTools: a flexible suite of utilities for comparing genomic features. Bioinformatics. 2010;26:841–842. doi: 10.1093/bioinformatics/btq033. [DOI] [PMC free article] [PubMed] [Google Scholar]
- 39.Krueger F, Andrews SR. Bismark: a flexible aligner and methylation caller for Bisulfite-Seq applications. Bioinformatics. 2011;27:1571–1572. doi: 10.1093/bioinformatics/btr167. [DOI] [PMC free article] [PubMed] [Google Scholar]
- 40.Kim D, Salzberg SL. TopHat-Fusion: an algorithm for discovery of novel fusion transcripts. Genome biology. 2011;12:R72. doi: 10.1186/gb-2011-12-8-r72. [DOI] [PMC free article] [PubMed] [Google Scholar]
- 41.Yeung KY, Fraley C, Murua A, Raftery AE, Ruzzo WL. Model-based clustering and data transformations for gene expression data. Bioinformatics. 2001;17:977–987. doi: 10.1093/bioinformatics/17.10.977. [DOI] [PubMed] [Google Scholar]
- 42.Subramanian A, et al. Gene set enrichment analysis: a knowledge-based approach for interpreting genome-wide expression profiles. Proc Natl Acad Sci USA. 2005;102:15545–15550. doi: 10.1073/pnas.0506580102. [DOI] [PMC free article] [PubMed] [Google Scholar]
- 43.Su AI, et al. A gene atlas of the mouse and human protein-encoding transcriptomes. Proc Natl Acad Sci U S A. 2004;101:6062–6067. doi: 10.1073/pnas.0400782101. 0400782101 [pii] [DOI] [PMC free article] [PubMed] [Google Scholar]
- 44.Boutros PC. LTR: Linear Cross-Platform Integration of Microarray Data. Cancer Inform. 2010;9:197–208. doi: 10.4137/cin.s5756. [DOI] [PMC free article] [PubMed] [Google Scholar]
- 45.Lee A, et al. Isolation of neural stem cells from the postnatal cerebellum. Nat Neurosci. 2005;8:723–729. doi: 10.1038/nn1473. [DOI] [PMC free article] [PubMed] [Google Scholar]
Associated Data
This section collects any data citations, data availability statements, or supplementary materials included in this article.


