

Abstract
Ineffective erythropoiesis is observed in many erythroid disorders including β-thalassemia and anemia of chronic disease in which increased production of erythroblasts that fail to mature exacerbate the underlying anemias. As loss of the transcription factor FOXO3 results in erythroblast abnormalities similar to the ones observed in ineffective erythropoiesis, we investigated the underlying mechanisms of the defective Foxo3−/− erythroblast cell cycle and maturation. Here we show that loss of Foxo3 results in overactivation of the JAK2/AKT/mTOR signaling pathway in primary bone marrow erythroblasts partly mediated by redox modulation. We further show that hyperactivation of mTOR signaling interferes with cell cycle progression in Foxo3 mutant erythroblasts. Importantly, inhibition of mTOR signaling, in vivo or in vitro enhances significantly Foxo3 mutant erythroid cell maturation. Similarly, in vivo inhibition of mTOR remarkably improves erythroid cell maturation and anemia in a model of β-thalassemia. Finally we show that FOXO3 and mTOR are likely part of a larger metabolic network in erythroblasts as together they control the expression of an array of metabolic genes some of which are implicated in erythroid disorders. These combined findings indicate that a metabolism-mediated regulatory network centered by FOXO3 and mTOR control the balanced production and maturation of erythroid cells. They also highlight physiological interactions between these proteins in regulating erythroblast energy. Our results indicate that alteration in the function of this network might be implicated in the pathogenesis of ineffective erythropoiesis.
Keywords: Ineffective erythropoiesis, beta-thalassemia, FOXO3, mTOR, glycolysis, JAK2, ROS, glutamine synthetase
Introduction
Erythroid cell maturation requires an exquisite coordination of cell proliferation and differentiation whose imbalance contributes to the pathogenesis of erythroid disorders. This coordination is compromised in many diseases of erythroid cells characterized by anemia and ineffective erythropoiesis including β-thalassemia, malaria and anemia of chronic disease [1, 2]. The importance of redox imbalance in altered erythropoiesis is evident as, depending on its degree of severity, results in subtle to highly defective RBC production [3–7]. The redox state is tightly coupled to cellular metabolism that in mature RBC is strictly limited to glycolysis [8, 9]. Although RBC glycolysis has been extensively studied, less is known about the potential function of metabolic (glycolytic) pathways during erythroblast maturation [8–11].
The redox balance is sustained during erythroid cell maturation, at least in part, by FOXO3 transcriptional regulation of several anti-oxidant enzymes [5, 12, 13]. FOXO3 belongs to the FOXO Forkhead family of winged helix transcription factors. In addition to their anti-oxidant response FOXO factors exert many fundamental biological functions including the regulation of cell cycle, apoptosis, DNA repair and metabolism [14, 15]. The transcriptional activity of FOXOs is negatively regulated by growth factor and cytokine receptor signaling via several protein kinases including AKT [15]. Conversely, FOXO factors are phosphorylated on distinct residues and activated in response to stress stimuli via a distinct set of protein kinases. In addition to phosphorylation, FOXO are regulated by a number of post-translational modifications. FOXO factors in mammals are composed of four highly related members (FOXO1, FOXO3, FOXO4 and FOXO6). Among these FOXO3 is the major active FOXO during erythroid cell maturation [5]. In response to erythropoietin (Epo), FOXO3 is phosphorylated by AKT protein kinase [16–20] that by promoting its cytosolic localization represses FOXO3’s transcriptional activity. FOXO3’s expression, nuclear localization and transcriptional activity increases with erythroblast maturation [5]. At the steady state, Foxo3 is required for erythroid cell formation [5] as loss of Foxo3 results in impaired anti-oxidant response, cell cycle alterations associated with delayed maturation of erythroblast precursors, as well as oxidative stress-mediated reduction of RBC lifespan [5]. These abnormalities lead to decreased RBC production. These combined abnormalities are highly reminiscent of ineffective erythropoiesis in which FOXO3 may be a participant [21] [22]. Nonetheless, the precise mechanism of cell cycle and maturation defects of Foxo3 mutant erythroblasts remains unclear. While the phenotype of Foxo3-deficient erythroid cells is relatively mild, these mice succumb to sudden death when exposed to exogenous oxidative challenge likely due to severe anemia [5], suggesting that Foxo3 has a key function in stress erythropoiesis. Recent work in our laboratory and others’ indicate that in addition to the transcriptional control of anti-oxidant enzymes, Foxo3 is implicated in an array of metabolic functions raising the possibility that Foxo3’s control of anti-oxidant response may be part of a broader metabolic program [23–28] [29] (and Campreciós and Ghaffari, manuscript in preparation).
AKT provides an important signal for erythroid cell generation and maturation [16–18, 30–33]. In addition to Foxo3, AKT regulates mammalian target of rapamycin (mTOR) kinase. mTOR signaling is one of the major regulators of cellular metabolism. mTOR is key to cellular growth (size) and proliferation, is highly sensitive to oxygen and nutrients including amino acids and glucose and has a central function in protein synthesis [34, 35]. mTOR protein kinase exists in two distinct core complexes, mTOR complex I and II (mTORC1 and mTORC2 respectively) which differ in their regulation and functions as well as in their sensitivity to rapamycin. While the physiological function of mTOR signaling during erythroid cell maturation remains unknown [36] [37], conflicting results as to whether use of the mTOR inhibitors in patients [35] is associated with anemias have been reported [38, 39].
Here we investigated mechanisms underlying alterations of Foxo3-deficient erythroid cell cycling. Strikingly, we found that loss of Foxo3 results in overactivation of the JAK2/AKT/mTOR signaling pathway in erythroblasts partly mediated by redox modulation. Activation of mTOR leads to alterations of cycling and differentiation of immature erythroblasts suggesting that activation of a feedback loop upstream of FOXO3 compromises erythroid cell maturation. We further show using in vitro and in vivo approaches that inhibition of mTOR signaling partially alleviates the abnormal maturation of Foxo3-deficient erythroblasts leading to increased red blood cells (RBC) in the peripheral blood. Notably, we show that FOXO3 and mTOR together may be part of a metabolic network during erythroid cell maturation. These findings suggest that hyperactivation of mTOR signaling resulting from loss of FOXO3 function contributes to the blockade of Foxo3−/− erythroblast maturation. In addition, they provide a platform to further delve into redox and metabolic regulation of erythropoiesis.
Methods
Mice
Foxo3+/− mice (129xFBV/n) [40] were backcrossed >10 generations onto C57Bl6 [41] and 10–12 week old C57Bl6 mice were used in all experiments. Protocols were approved by the Institutional Animal Care and Use Committee of Mount Sinai School of Medicine.
Cells
Bone marrow lineage negative cells were separated from mature cells using the EasySep™ mouse hematopoietic progenitor enrichment kit (StemCell Technologies) and differentiated on fibronectin-coated plates for 18 hours with IMDM + 15% FBS supplemented with 2 U/ml Epo, IL-6 (10 ng/ml) and SCF (100 ng/ml) (modified from [32, 33, 42]). Cells were then starved in vitro for 2 hours in IMDM supplemented with 0.1% FCS and further stimulated with Epo (10 U/ml). In some experiments, cells were differentiated in the presence of 100 uM NAC. Fetal liver cultures were performed using a modified protocol of [43]. Briefly, lineage negative cells were isolated from E14.5 fetal livers and plated at < 2×10⁶ cells/ml with erythroid expansion medium consisting of Stem Span SFEM (StemCell Technologies) supplemented with 2 U/ml human recombinant Epo (Amgen), 100 ng/ml SCF (PreproTech), 40 ng/ml insulin-like growth factor-1 (PreproTech), 10−6 M dexamethasone (D2915; Sigma), 0.4% cholesterol mix (Gibco) and 1% penicillin/streptomycin (Gibco). After 48 h cells were washed with PBS and plated at a concentration < 2×10⁶ with either ramapycin (20 nM; Enzo Life Sciences) or vehicle control with erythroid differentiation medium consisting of IMDM supplemented with 2 U/ml Epo, 100 ng/ml SCF, 10% Serum replacement (Invitrogen), 5% Platelet-Derived Serum, glutamine and 10% Protein-Free Hybridoma Media. After another 24 hours, cells were collected and erythroid maturation analyzed by flow cytometry.
Retroviral production and transduction of cells
Retroviral constructs and supernatant production were performed as previously described [32, 33].
Colony-forming Assays
For BFU-E and CFU-E analyses, 1×10⁴ and 3×10³ total bone marrow cells were plated respectively in triplicates as previously described [32].
Flow Cytometry
Bone marrow and fetal liver single cell suspensions were prepared and maintained in IMDM + 15% FBS, washed twice, pre-incubated with 10% rat serum and stained with CD71-FITC, CD44-APC and TER119-PE or -FITC antibodies (BD Biosciences). Gating to distinguish erythroid populations according to their stage of maturation was performed as in [44]. Freshly isolated bone marrow cells stained with CD44-APC and TER119-FITC, were fixed with fix/permeabilization buffer (BD Biosciences) and incubated with 1:100 dilution of anti-pSer473 AKT and pSer235/236 S6 antibodies (Cell Signaling Technology, Cat #9271 and #4858, respectively) followed by incubation with 1:1000 dilution of PE-conjugated secondary antibody (BD Biosciences) to measure intracellular AKT and S6 phosphorylation. Samples were washed and protein phosphorylation was analyzed by flow cytometry. Data was analyzed by FlowJo software (Treestar).
Cell proliferation assay
Mice were injected intraperitoneally with 1 mg of BrdU. One hour later, bone marrow cells were isolated and stained with CD44-APC and TER119-PE antibodies (BD-Pharmingen, CA), then fixed and stained with anti-BrdU-FITC antibody (BD Biosciences) and 7-AAD for flow cytometric analysis of cell proliferation following the manufacturer’s protocol. Similar results were obtained when BrdU was injected 30 minutes before harvesting cells.
N-Acetyl-L-Cysteine (NAC) Treatment
Mice were injected intraperitoneally with 100 mg/kg body weight of N-Acetyl-L-Cysteine (NAC; Sigma, MO) in phosphate buffered saline solution (pH7.4) daily for 2 weeks.
Western Blot Analysis
Cells were starved in 0.1% serum for two hours and then stimulated with Epo (10 U/ml). Lysates were prepared in 1 X RIPA lysis buffer (20 mM Sodium phosphate, 300 mM Sodium Chloride, 4 mM EDTA) containing 2% Sodium deoxycholate, 2% NP-40, 0.2% SDS, 400 μM Sodium orthovanadate, 0.2% β-mercaptoethanol, 2 mM PMSF and 100 mM Sodium fluoride. The buffer was also mixed with protease cocktail inhibitors (Roche; Cat No: 11-697-498-001). The total protein was estimated using Bio-Rad Bradford’s Reagent (Cat #500-0006) following manufacturer’s instructions. Retrovirally-transduced GFP-positive NIH3T3 cells were FACS sorted and cell lysates were prepared in Laemmli sample buffer (Bio-Rad), resolved by SDS polyacrylamide gel electrophoresis (PAGE) and transferred onto PVDF membranes. Given the size and to enhance resolution, mTOR protein was run separately. The following primary antibodies were used for western blotting: anti-pSer473 Akt (#4051), anti-Akt (#9272), anti-pThr389 p70 S6 Kinase (#9205), anti-p70 S6 Kinase (#9202), anti-pSer2448 mTOR (#2971), anti-mTOR (#2972), anti-pTyr1007/1008 Jak2 (#3776), anti-TSC1 (# 6935), anti-p4EBP1 (Thr37/46) (# 2855), 4EBP1 (# 9644), from Cell Signaling Technology, and anti-Glutamine Synthase BD (# 610517); all used at 1:1000 dilutions. Anti-Tubulin: Santa Cruz Biotechnology (#sc-8035) anti-Actin (#sc-1616) from Santa Cruz. Anti-JAK2 (#06-255; Upstate Biotechnology; 1:500). Horseradish peroxidase (HRP)-conjugated secondary antibodies were used at 1:5000 (Santa Cruz).
Rapamycin Treatment
Mice received intraperitoneal administration of 4 mg/kg body weight of rapamycin (Enzo Life Sciences, NY) in PBS + 5% Tween 80 + 5% PEG400 + 4% Ethanol during 5 consecutive days/week for 2 weeks.
Hematological studies
Blood samples were obtained from the cava vein right after sacrificing the mice and collected in EDTA or Heparin. Complete blood counts (CBC) were measured with an Advia 120 analyzer.
Plasma Epo measurement
Plasma Epo concentrations were determined by the Quantikine® ELISA kit for mouse erythropoietin from R&D Biosystems (Minneapolis, MN) according to the manufacturer’s instructions.
RNA isolation and QRT–PCR
Fluidigm - 96.96 Dynamic Array IFC
For fluidigm dynamic array performance, specific target amplification (STA) was performed according to the manufacturer’s protocol (PN 100-3488 B1). Briefly, cDNA was pre-amplified using the TaqMan® PreAmp Master Mix (Applied Biosystems) for the 96 genes of interest. The amplification parameters were as follows: 95°C for 10′, followed by 12 cycles at 95°C for 15″ and 60°C for 4′. After STA, we performed Exonuclease I treatment as recommended by the manufacturer. Briefly, Exonuclease I and Exonuclease I buffer (New England Biolabs) were added to the STA samples, and samples were then incubated for 30′ at 37°C, followed by the enzyme inactivation at 80°C for 15′. Finally, to load the dynamic array IFC, samples were prepared with the SsoFast EvaGreen Supermix with Low ROX (Bio-Rad) and 20x DNA Binding Dye Sample Loading Reagent (Fluidigm). On the other hand, primers were diluted with Assay Loading Reagent (Fluidigm) and DNA Suspension Buffer (Teknova). After priming the 96×96 chip in the IFC Controller MX, samples and primers were loaded into their respective inlets. The chip was then loaded by the IFC Controller MX (BioMark™ HD System). The chip was run following the GE 96×96 PCR+Melt v2.pcl protocol in the Biomark using the Data Collection Software (Fluidigm). Results were obtained with the Fluidigm Real-Time PCR Analysis software (Fluidigm) and further analyzed by the 2−ΔΔCt method. β actin was used as a loading control. Results shown as fold-change relative to Gate I wild type controls. Primer specific sequences are listed in Supplementary Table 2.
Statistical analysis
Fluidigm data was normalized using standard 2−ΔΔCt method using actin readings as an internal standard in each series of PCR reactions. In experiments other than Fluidigm analysis of gene expression, the unpaired one- and two-tail Student’s t-test was used. A p-value < 0.05 was considered to be significant.
Results
Foxo3-mTOR Control Erythroblast Cell Cycling
To examine mechanisms underlying abnormalities of Foxo3 mutant erythroblast cycling and maturation we analyzed Epo-activated signaling pathways in primary mouse Foxo3−/− erythroid precursors. Primary lineage negative (lacking mature erythroid cells) wild type (WT) and Foxo3−/− bone marrow cells cultured under an erythroid differentiation condition for eighteen hours (18 h) [33, 42] produced ~ 60% TER119+ cells (Supplementary Figure 1). These cells were serum starved for 2 h and stimulated with Epo before lysates were analyzed by immunoblotting (Figure 1). As anticipated JAK2 protein tyrosine kinase that is necessary for Epo receptor (EpoR) signaling and its downstream effector AKT, were rapidly phosphorylated in response to Epo [16, 18] (Figure 1). In addition, mTOR protein kinase and its downstream target ribosomal S6 protein kinase 1 (S6K1) were phosphorylated in immature mouse erythroblasts. Epo stimulation of primary Foxo3-null erythroblast precursors also resulted in increased JAK2 phosphorylation as in wild type erythroblasts (Figure 1). This was associated with enhanced phosphorylation of signaling proteins AKT, mTOR and mTOR target S6K1 in Foxo3-null erythroblast precursors at levels markedly higher than the control. Up to one hour after Epo stimulation the AKT/mTOR/S6K1 remained highly phosphorylated in Foxo3-deficient erythroid precursors with a distinct kinetic from that observed in wild type cells. To further assess whether mTOR signaling was activated in Foxo3 mutant erythroblasts, we compared the phosphorylation of another downstream target of mTOR, the eukaryotic initiation factor 4E (eIF4E)-binding protein 1 (4EBP1). mTORC1 phosphorylation and inhibition of 4EBP1 has a more direct impact on mRNA translation [34]. Phosphorylation of 4EBP1 in response to Epo stimulation was increased in primary freshly isolated Foxo3 mutant erythroblasts (TER 119+) (Figure 1B, top panel) serum starved for 2 hours as compared to control cells (quantification, Figure 1B, bottom panel). Detection of pAKT, pS6K1 and p4EBP1 but not pJAK2 at time 0 even in the absence of Epo stimulation in Foxo3 mutant erythroblasts (Figure 1) might indicate constitutive activation of mTOR signaling independent of JAK2. These results suggested that loss of FOXO3 may alter the signaling response to Epo in erythroblasts leading to prolonged activation of AKT/mTOR signaling (Figure 1 see schematic on top).
Figure 1. Jak2-AKT–mTOR signaling pathway is overactivated in cultured Foxo3−/− bone marrow erythroid cells.

(A) Schematic of EpoR-mediated activation of JAK2-AKT-mTOR on the left. Western blot analysis of phosphorylation of signaling proteins. WT and Foxo3−/− lineage-negative bone marrow cells were isolated and cultured under erythroid condition for 18 hours, serum- and cytokine starved for 2 hours and stimulated with Epo (10 U/ml) for the indicated time-points in vitro before preparing the whole cell extract. One representative of two experiments is shown. (B) Schematic of activation of feedback loop JAK2-AKT-mTOR in the absence of FOXO3 on the left. TER 119+ WT and Foxo3−/− erythroblasts were freshly isolated from mice serum- and cytokine starved for 2 hours and stimulated with Epo (10 U/ml) for the indicated time-points in vitro before preparing the whole cell extract to analyze of p4EBP1 (quantification of bands in the bottom panel).
As FOXO3 is a key regulator of oxidative stress, and ROS modulate protein phosphorylation [14, 47] we evaluated whether ROS are implicated in the alteration of EpoR signaling in Foxo3 mutant erythroblasts. In vitro treatment with ROS scavengers N-acetyl-cysteine (NAC) for two hours had a noticeable effect on reducing phosphorylation of JAK2, AKT, mTOR and S6K protein in primary Foxo3 mutant bone marrow erythroblasts (Figure 2, compare lanes 8,9 to 11, 12). These results suggest that ROS contribute to the enhanced phosphorylation of these proteins in Foxo3 mutant erythroblasts in response to Epo. NAC treatment also reduced the levels of JAK2/AKT/mTOR/S6K1 phosphorylation in wild type primary erythroid cells (Figure 2, compare lanes 2,3 to 5,6). Although under these conditions, NAC reduced notably phosphorylated AKT, mTOR and S6K in both wild type and Foxo3 mutant erythroblasts, the effect of NAC on pJAK2 was less pronounced (Figure 2). The phosphorylated form of ribosomal protein S6 (pS6) is a target of S6K1 and a reliable indicator of mTORC1 activity [35]. In agreement with ROS effects on mTORC1 activity, in vivo treatment with NAC reduced the frequency of pS6 expressing cells and the levels of pS6 (Supplementary Figure 2 and data not shown). These results are consistent with the notion that redox state modulates mTOR signaling [48, 49], and suggest that increased ROS mediate at least partially overactivation of mTOR signaling in immature Foxo3−/− erythroblasts in vitro (Figure 1, Supplementary Figure 2).
Figure 2. Overactivation of Jak2-AKT–mTOR signaling pathway in cultured Foxo3−/− bone marrow erythroid cells is partly mediated by ROS.

Western blot analysis of phosphorylation of signaling proteins. WT and Foxo3−/− bone marrow lineage-negative cells were isolated and cultured under erythroid condition for 18 hours in the presence or absence of NAC (100 μM), serum- and cytokine starved for 2 hours and stimulated with Epo (10 U/ml) for the indicated time-points in vitro before preparing the whole cell extract.
We next investigated the function of mTOR signaling in normal erythropoiesis. We used RNA interference to inhibit the expression of S6K1, a direct mTORC1 target [34, 35, 50] in primary erythroid progenitors (Figure 3A). Inhibition of S6K1 in bone marrow cultures using two distinct shRNA sequences resulted in significant reduction of BFU-E and CFU-E-derived erythroid cell colony formation (Figure 3B). The degree of inhibition of erythroid progenitor cell-colony formation was consistent with the relative expression of S6K1 in response to RNA interference targeting in BFU-Es but not in CFU-Es (Figure 3B) suggesting that while mTORC1 activation is required for both BFU-ES and CFU-Es, BFU-Es more than CFU-Es are highly sensitive to levels of mTOR signaling. These results may reflect distinct sensitivity of these progenitors to EpoR signaling [51]. These combined results suggest that mTORC1 signaling is required for in vitro generation of erythroid progenitor cell-derived colonies.
Figure 3. RNA interference inhibition of mTOR signaling reduces bone marrow erythroid colony-formation capacity.

A. Inhibition efficiency of short hairpin RNAs targeting S6 kinase was tested by transducing NIH3T3 cells with the indicated short hairpin RNAs and analyzing S6K1 expression by Western blot. B. Number of bone marrow BFU-E- and CFU-E-derived colonies formed by lineage negative cells transduced with short hairpin RNAs targeting S6 kinase or scrambled control are shown. Results shown are mean ± SEM of triplicates; *P < 0.05; **P < 0.01; ***P < 0.001; Student’s t test.
As mTOR signaling is central to cell growth and proliferation, we asked whether inhibition of mTOR signaling by rapamycin that is a specific inhibitor of mTORC1 [35] has any impact on erythroblast precursor cell cycling. To address this, we used the thymidine analog 5-bromo-2-deoxyuridine (BrdU) that is incorporated in dividing cells in vivo. Mice were treated in vivo with rapamycin for two weeks and injected with BrdU 30–60 minutes before harvesting the bone marrow. Erythroblast cell cycle distribution was analyzed at distinct stages of maturation by flow cytometry examination of BrdU incorporation and the DNA marker 7-aminoactinomycin D (7-AAD). Maturing erythroblasts (proerythroblasts, basophilic erythroblasts and polychromatophilic erythroblasts) expressing similar levels of transferrin receptor CD71 [44] (and data not shown) were distinguished according to their size (forward scatter, FSC) and surface expression of TER119 and CD44 [44] (Figure 4A, FACS plot). The analysis yielded important insights into primary bone marrow erythroblast cycling. A significant fraction (up to 75%) of wild type bone marrow erythroblasts (Gates I to III proerythroblasts, basophilic, polychromatophilic) were in the S phase (Figure 4B). Rapamycin treatment strongly blocked erythroblast cell cycle progression at the G1/S transition phase in immature erythroblasts (Gates I and II, proerythroblasts and basophilic erythroblasts respectively) and reduced the fraction of proerythroblasts (Gate I) in the S phase. In addition, rapamycin treatment strongly reduced the fraction of basophilic erythroblasts (Gate II) that were in the G2/M transition without significant effects on cells at later stages of maturation (Gates III and IV). In contrast to its effect on proerythroblasts, rapamycin treatment resulted in an increase, rather than a decrease in the fraction of basophilic erythroblasts (Gate II) that were in the S phase (Figure 4B). These results indicate that mTOR signaling is required for normal cell cycle progression of immature (Gates I and II) erythroblasts.
Figure 4. In vivo rapamycin treatment inhibits cell cycle progression in bone marrow immature erythroblasts.

A. Flow cytometry strategy to distinguish four different bone marrow erythroid populations with increasing degree of maturation (Gates I to IV) according to their TER119 and CD44 cell surface expression and forward scatter (FSC) properties after fixation and permeabilization. Cell cycle analysis (B) and phosphorylated S6 (C) were analyzed by flow cytometry in each erythroid precursor population from WT and Foxo3−/− mice treated with rapamycin (4 mg/kg*day) or control vehicle for two weeks. In B each graph represents a distinct population and numbers within each graph represent percentage of cells in G0/G1, S and G2/M phases of cell cycle for each population. One representative of two independent experiments is shown (n = 3 mice in each group, mean ± SEM; *P < 0.05; **P < 0.01; ***P < 0.001 between vehicle- and rapamycin-treated; #P < 0.05; ##P < 0.01; ###P < 0.001 between WT and Foxo3−/−, Student’s t test).
Immature Foxo3 mutant erythroblasts exhibit cell cycle defects associated with a failure to fully mature [5]. As a consequence, the rate of Foxo3 mutant erythroblast maturation is decreased. We evaluated whether the overactivation of mTOR signaling in Foxo3 mutant erythroblasts contributes to their cell cycle alteration and defective maturation. BrdU analysis of Foxo3 mutant erythroblasts confirmed Foxo3 mutant erythroblast cell cycle alterations [5] (Figures 4A, 4B). Relative to controls, a reduced fraction of early Foxo3 mutant erythroblasts (Gates I) was in the S phase of cell cycle as previously observed [5]. In addition to a slight increase in the fraction of immature Foxo3 mutant precursors (Gates I and II) in G0/G1 and a slight increase in the S phase (Gate II), a noticeable fraction of these cells was blocked at the G2/M transition (Figure 4B). Rapamycin treatment improved significantly the G2 to M transition of Foxo3 mutant erythroblasts (Figure 4B, Gate I) suggesting that the G2/M block is mediated in part by the overactivation of mTOR signaling in Foxo3 mutant erythroblasts. As observed in control cells, the in vivo treatment with rapamycin enhanced the fraction of Foxo3 mutant cells (Gate I) in G0/G1. The effects of rapamycin on wild type and Foxo3 mutant cell cycle were highly similar at later stages of erythroblast maturation (Figure 4B, lower panels).
As anticipated, the effect of rapamycin in early precursors (Gates I and II) mediated the inhibition of mTORC1 signaling as shown by reduced phosphorylation of S6 at distinct stages of erythroblast maturation (Figure 4C). In contrast, rapamycin treatment did not significantly reduce the frequency of pAKT-expressing erythroblasts or levels of pAKT (data not shown) suggesting that the AKT activator mTORC2 [35] might not be involved in these effects. Together these results suggested the effects of rapamycin in early erythroblasts (Gates I and II) are likely mediated by mTORC1.
Rapamycin Treatment Increases RBC Production in Foxo3−/− ice in vivo
In vivo treatment with rapamycin increased significantly RBC numbers and hemoglobin concentration in Foxo3−/− peripheral blood without modulating significantly the total number of erythroid (TER119+) cells (Table 1, Figures 5A, 5B). Importantly, rapamycin treatment tipped the balanced production of erythroid cells towards terminal maturation (Figures 5C and 5D). A picture emerging from these findings is that by increasing the fraction of cells in G1, rapamycin may block cell cycle progression in immature erythroblasts (proerythroblasts, Gate I), reduce the fraction of cells in the S phase, and induce cell cycle exit in immature Foxo3 mutant erythroblasts. In agreement with this interpretation, the ratio of mature to immature erythroblasts in the bone marrow also increased in response to rapamycin treatment (Figures 5C, 5D).
Table 1.
Peripheral blood erythrocyte parameters
| WT vehicle | WT rapamycin | Foxo3−/− vehicle | Foxo3−/− rapamycin | Th3/+ vehicle | Th3/+ rapamycin | |
|---|---|---|---|---|---|---|
| RBC, x106 | 10.4 ± 0.3 | 10.9 ± 0.2 | 9.0 ± 0.1# | 9.8 ± 0.4* | 7.5 ± 0.2# | 8.4 ± 0.2* |
| HGB, g/l | 15.0 ± 0.3 | 15.4 ± 0.3* | 14.8 ± 0.1 | 16.0 ± 0.7* | 7.9 ± 0.3# | 9.2 ± 0.3* |
| HCT | 54.6 ± 1.6 | 56.5 ± 1.9 | 52.8 ± 0.9 | 55.7 ± 2.4 | 32.2 ± 1.3# | 36.4 ± 1.3* |
| MCV, fL | 52.8 ± 1.2 | 52.5 ± 1.6 | 58.5 ± 0.8# | 56.8 ± 0.9 | 42.9 ± 0.8# | 43.2 ± 0.7 |
| MCH, pg | 14.6 ± 0.2 | 14.9 ± 0.2 | 16.4 ± 0.2# | 16.2 ± 0.4 | 10.3 ± 0.3# | 10.5 ± 0.2 |
| MCHC, g/l | 27.4 ± 0.5 | 28.1 ± 0.5 | 28.0 ± 0.3 | 28.6 ± 0.3 | 25.0 ± 0.8# | 25.2 ± 0.7 |
| Retic, % | 3.6 ± 0.3 | 3.8 ± 0.5 | 6.6 ± 0.5# | 7.4 ± 0.4 | 25.8 ± 1.9# | 28.2 ± 2.2 |
| n = 9 | n = 8 | n = 10 | n = 9 | n = 9 | n = 10 |
Mice treated with rapamycin or vehicle control for two weeks.
P < 0.05 between vehicle- and rapamycin-treated;
P < 0.05 between WT and Foxo3−/− or Th3/+.
Figure 5. In vivo rapamycin treatment increases erythroid cell maturation.

Flow cytometric analysis of bone marrow erythroid cell distribution in wild type and Foxo3−/− mice treated with rapamycin (4 mg/kg*day) or control vehicle for two weeks. A. Schematic of flow cytometry analysis of five distinct erythroid populations according to their TER119 and CD44 surface expression and FSC properties. B. Percentage of TER119+ cells within the bone marrow. C. Distribution of TER119+ cells in each of the five gates shown in A. D. Ratio of mature cells (Gates IV and V combined) relative to the total TER119+ erythroid population. *P < 0.05 between vehicle- and rapamycin-treated; #P < 0.05 between WT and Foxo3−/− (n = 12, mean ± SEM; Student’s t test). Veh: vehicle, Rapa: rapamycin.
The effect of rapamycin on maturation may be due to its intrinsic effect in erythroblasts, or extrinsic due to its effect on bone marrow microenvironment [52, 53]. To distinguish between these alternatives, we isolated E14.5 fetal livers that are site of definitive erythropoiesis and followed the ex vivo differentiation of erythroblasts in the presence or absence of rapamycin. This approach enabled us to monitor precisely stages of erythroblast maturation in response to treatment. Addition of rapamycin to erythroblasts that were all at the proerythroblast stage reduced the frequency of immature (in Gate I) in favor of mature erythroblasts (in Gate III) similar to the effect seen in in vivo experiments (Supplemental Figure 3). These findings further support the notion that overactivation of mTOR signaling in immature Foxo3 mutant erythroblasts reduces their rate of maturation.
Elevated erythropoietin (Epo) is associated with the state of ineffective erythropoiesis and is likely to take part in abnormally enhanced signaling in immature erythroblasts [54, 55]. We argued that if the abnormal erythropoiesis in Foxo3 mutant mice is similar to ineffective erythropoiesis, then circulating Epo levels should be increased in Foxo3−/− mice. In addition, rapamycin treatment should result in reduced Epo levels in Foxo3 mutant peripheral blood. Consistent with an ineffective erythropoiesis phenotype, circulating Epo levels were significantly increased in Foxo3 mutant peripheral blood (Supplemental Figure 4). In vivo treatment with rapamycin reduced the increased levels of circulating Epo in Foxo3 mutant peripheral blood (Supplemental Figure 4) but did not significantly modulate the levels of Epo in wild type mice. These results further supported the concept that the abnormal Foxo3−/− erythropoiesis has overlapping features with ineffective erythropoiesis. They also raised the potential that rapamycin might have a beneficial effect on ineffective erythropoiesis.
Together, these results (Figures 4 and 5, Supplementary Figure 3, Table 1) suggest that rapamycin enhances erythroid maturation by inducing cell cycle exit of immature erythroblasts resulting in increased RBC production. These findings reflect the amplitude of dynamic changes that are detected specifically in immature erythroblasts (proerythroblasts) as compared to cells at later stages of maturation as previously reported [56, 57].
Foxo3-mTOR Control Erythroblast Metabolic Gene Expression in vivo
ROS elimination is maintained in part by sustained generation of reduced glutathione as a result of glucose metabolism and a functional pentose phosphate pathway (Figure 6A). Given the function of mTOR protein kinase in cellular metabolism [34, 35] and its sensitivity to redox modulation [48], in particular in erythroblast precursors (Figure 2, Supplementary Figure 2) we explored the possibility that the impact on erythroid cell production might be mediated by mTOR’s influence on erythroblast metabolism. Using Fluidigm microfluidics technology that enables monitoring the expression of 96 genes in 96 samples all at once (equivalent of 9216 realtime PCR), we interrogated the expression of an array of metabolic genes (Figure 6). Wild type and Foxo3 mutant mice were treated for two weeks with rapamycin or control vehicle and RNA from erythroblasts at distinct stages of maturation was isolated and subjected to Fluidigm QRT-PCR analysis (Figure 6). These experiments led to several interesting observations. First, in agreement with earlier observations [10, 11], the transcript of the majority of metabolic genes surveyed in wild type erythroblasts was at least as highly expressed in early immature erythroblasts (proerythroblasts, Gate I) as it was in maturing erythroblasts (orthochromatic erythroblast, Gate IV). Strikingly, we found the expression of many metabolic genes specifically implicated in glucose metabolism was highly altered (mostly reduced) in Foxo3 mutant erythroblasts at different stages of maturation, specifically in immature erythroblasts (Figure 6B). Expression of several of these genes in Foxo3 mutant erythroblasts was sensitive to rapamycin treatment (Figure 6B). Specifically, in vivo treatment with rapamycin normalized and/or significantly improved the transcript level of several genes including pyruvate kinase M2 (Pkm2), aldolase A encoding fructose-bisphosphate aldolase (AldoA), Enolase 1 α (EnoA) (Eno1/EnoA), glyceraldehyde-3-phosphate dehydrogenase (Gapdh) and Lactate Dehydrogenase (Ldh) B (LdhB) in Foxo3 mutant immature erythroblasts (Gate I and II cells, Figure 6B). These results indicate that altered expression of many metabolic specifically glycolytic transcripts in Foxo3 mutant immature erythroblasts is likely due to either decreased transcription (due to lack of FOXO3), or enhanced activation of mTOR signaling (or likely both) in Foxo3 mutant erythroblasts.
Figure 6. Alteration of transcripts of metabolic enzymes in Foxo3−/− immature erythroblasts.


A. Schematic of glycolytic pathway and its interaction with tricarboxylic acid (TCA) cycle and pentose phosphate pathway. B. QRT-PCR expression analysis by Fluidigm microfluidics technology of metabolic genes in bone marrow Gates I to IV erythroblasts from WT and Foxo3−/− mice treated with rapamycin (4 mg/kg*day) or control vehicle for two weeks. Quantification of target genes is relative to β actin. Results are mean ± SEM of 3 cDNAs, each generated from one mouse. *P < 0.05 between vehicle- and rapamycin-treated; #P < 0.05 between WT and Foxo3−/−.
In addition to the redox state, some of the direct targets of FOXO3 [58, 59] like Rictor, Tsc1 and glutamine synthetase (GS) [23] are implicated in the activation of mTOR. Rictor is part of the mTORC2 complex [60, 61]. Rictor transcripts were slightly but significantly reduced in Foxo3 mutant erythroblast (Figure 7A) supporting a potential decreased assembly of mTORC2 in favor of mTORC1 complex in erythroblasts [60] [62]. While transcripts for Tsc1 that is an upstream negative regulator of mTOR signaling [63] were highly reduced in Foxo3 mutant erythroblasts (Figure 7A), TSC1 protein was not significantly altered (Figure 7B, quantification in the right panel) suggesting that reduction of TSC1 transcript expression was unlikely to mediate activation of mTOR in Foxo3 mutant erythroblasts. On the other hand the transcript for Glutamine Synthetase (GS) that is a negative regulator of mTOR [23] was highly and significantly reduced in Foxo3 mutant erythroblasts at all stages of maturation, including in early precursors (Gates I and II) (Figure 6B). GS protein expression was also significantly reduced in freshly isolated TER 119+ Foxo3 mutant erythroblasts (Figure 7C). These findings raise the possibility that reduced expression of GS might be implicated in mTORC1 activation in Foxo3 mutant erythroblasts.
Figure 7. Glutamine Synthetase protein is decreased in Foxo3 mutant erythroblasts.

A. QRT-PCR expression analysis in freshly isolated erythroblasts at distinct stages of maturation. B. Western blot and band quantification (right panel) of TSC1 in freshly isolated bone marrow TER 119+ erythroblasts from two distinct mice for each genotype. C. Western blot analysis of glutamine syntethase in freshly isolated bone marrow TER 119+ erythroblasts from four distinct mice for each genotype. Band quantification in the right. Results shown are mean ± SEM of triplicates; #P < 0.05; ***P < 0.001; Student’s t test.
Increased proliferation of immature erythroblasts that are unable to fully mature, as seen in Foxo3 mutant erythroblasts (Figures 4–5, Supplementary Figures 3, 5) characterizes ineffective erythropoiesis observed in many erythroid disorders including β-thalassemia [52, 55]. In β-thalassemia, the generation of erythroid cells is hampered by a number of intricate mechanisms triggered partly by redox imbalance that together lead to an exacerbated erythropoiesis that fails to produce sufficient numbers of mature functional RBC [54, 64]. Given that rapamycin treatment improved the ineffective erythropoiesis of Foxo3 mutant mice, we evaluated the potential effect of rapamycin on β-thalassemic erythropoiesis. Strikingly, a two-week in vivo treatment with rapamycin increased the number of RBC (*p < 0.05, Table 1), hematocrit (36.4% ± 1.3% in rapamycin treated mice versus 32.2% ± 1.3% in mice treated with control vehicle) and specifically hemoglobin by over 1g/dl in the peripheral blood of a model of β-thalassemia (intermedia Hbbth3/+, Th3/+) [55]. These findings suggest that activation of mTOR signaling in erythroblasts may contribute to the β-thalassemic phenotype. The effects of rapamycin on bone marrow and spleen β-thalassemic erythroblast cell cycling was at best modest (data not shown) despite its effect on Foxo3 mutant erythroblast cycling (Figure 4) suggesting additional mechanisms are involved. Nonetheless, consistent with the notion that Foxo3 mutant and β-thalassemic erythropoiesis may share common features, there was a remarkable similarity between alteration of metabolic gene expression in β-thalassemic and Foxo3 mutant erythroblasts (Figure 6B). In particular, expression of Pkm2, Gpi1, EnoA-Eno1, G6pd1, Pgk1, LdhA, LdhB, Idh1 and Idh2 was similarly altered in β-thalassemic and Foxo3 mutant erythroblasts. While rapamycin treatment increased expression of β major in β-thalassemic erythroid cells (Figure 8), the effect of rapamycin on metabolic genes was restricted to increasing the transcript expression of Pdk1 and Idh1 in early and late stages of β-thalassemic erythroblast maturation respectively (Figure 6B).
Figure 8. In vivo rapamycin treatment improves β globin expression in β-thalassemia erythroblasts.
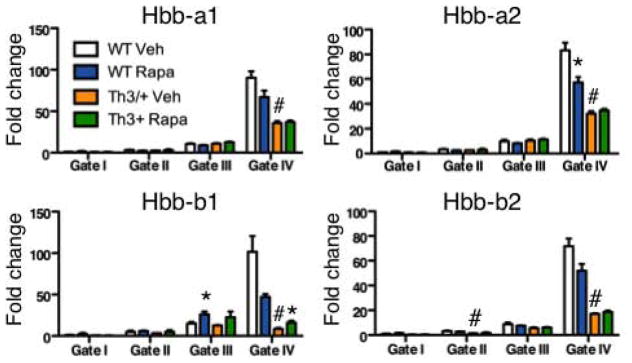
WT and Th3/+ mice treated with rapamycin (4 mg/kg*day) or control vehicle for two weeks. QRT-PCR expression analysis of globin genes in WT and Th3/+ bone marrow erythroblasts from Gates I to IV. QRT-PCR expression analysis was performed using Fluidigm microfluidics technology and quantification of target genes is relative to β actin. Results are mean ± SEM of 3 cDNAs, each generated from one mouse. Veh: vehicle, Rapa: Rapamycin.
Discussion
Defective proliferation of Foxo3 mutant erythroblasts that fail to mature [5] is reminiscent of proliferation and maturation defects leading to ineffective erythropoiesis [54]. Here we showed that defects of Foxo3 mutant erythroblast maturation are mediated in part by hyperactivation of mTOR signaling In immature erythroblasts. These defects lead specifically to a G2/M block in Foxo3 mutant erythroblast cycling. Our results suggest that physiological cooperation of mTOR signaling with FOXO3 is key to the control of cell cycle progression of immature erythroblasts and their rate of maturation in vivo (see Model, Figure 9). We have previously shown that FOXO3 is required for erythroblast cell cycling [5]. The defects in the G2/M progression of FOXO3 mutant erythroblasts isolated from C57Bl6 mice shown here are similar to what we observed in Foxo3 mutant hematopoietic stem cells [41]. However, we failed to detect the G2/M block in a heterogeneous population of erythroblasts isolated from mice on a mixed genetic background (FVB x 129). Although our data does not implicate directly redox modulations in mTOR activation in primary immature erythroblasts in vivo, in contrast to our observations in primitive primary Foxo3 mutant myeloid progenitors [45] overall our findings support a model in which a feedback loop that is in part mediated by a redox switch amplified by loss of FOXO3 activates mTOR signaling in primary erythroblasts. Together these results indicate that the outcome of FOXO3/mTOR interactions may be cell context-dependent [45]. Activation of mTOR in primitive primary Foxo3 mutant myeloid progenitors [45] result in increased cell cycle whereas in Foxo3 mutant immature erythroblasts mTOR activation leads to relative cell cycle delay (Figure 4).
Figure 9. Proposed Model for FOXO3/ROS/mTOR regulation of erythroblast maturation.
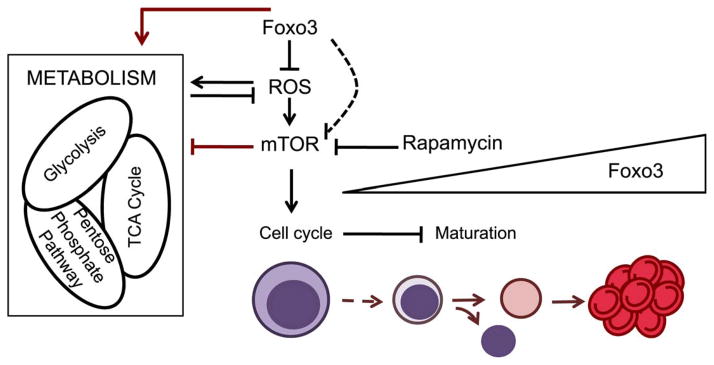
During erythroid differentiation FOXO3 becomes nuclear and active, keeping ROS levels under control through transcriptional regulation of antioxidant enzymes and certain metabolic enzymes. The absence of FOXO3 leads to increased ROS levels that further activate mTOR, which in turn influences glycolytic enzymes and erythroblast cell cycling leading to decrease in erythroblast maturation. Red arrows indicate the main findings described in this article.
Erythroblasts have a remarkable capacity for proliferation and as such are likely to be especially sensitive to metabolic perturbations [43]. FOXO3 may have a function in regulating key metabolic genes (Figure 6) in erythroblasts in agreement with recent studies in neural stem and progenitor cells [65]. Defective expression of metabolic genes may contribute to the accumulation of ROS in Foxo3 mutant erythrocytes resulting in hemolytic anemia and ROS-mediated reduction of RBC lifespan observed in Foxo3−/− mice [5]. It would be interesting to investigate whether in addition to oxidative stress (Figure 2) [5], reduction of glutamine synthetase expression (Figures 6B, 7C) contributes to the overactivation of mTOR signaling of Foxo3 mutant erythroblasts in vitro and/or in vivo [23].
One of the most unexpected findings was the increased production of mature RBC in response to rapamycin treatment in β-thalassemic mice. β-thalassemia arises as a consequence of mutations of β globin gene and precipitation of excess unmatched α globin, resulting in an increase in the pool of free iron that triggers enhanced redox reactions and damage to RBC membrane. These changes ultimately leads to excessive compensatory proliferation of erythroid precursors that fail to mature [2, 55, 66, 67]. Consistent with the therapeutic effect of JAK2 protein tyrosine kinase inhibitors [55], our results implicate mTOR signaling in the ineffective β-thalassemic erythropoiesis. It is noteworthy that rapamycin induces γ-globin mRNA and fetal hemoglobin (HbF) production in cultured human erythroid progenitors from β-thalassemic patients [68]. It will be important to investigate mechanisms whereby rapamycin ameliorates β-thalassemic anemia and explore potential effects on protein translation, iron flux [69] and immune response [35].
One of the noticeable findings in these studies was ROS-mediated phosphorylation of JAK2 in primary mouse erythroblasts. JAK2 protein tyrosine kinase, an essential component of EpoR signaling is known to generate ROS upon stimulation and be redox modulated, a property that is relevant to myeloproliferation [70]. However whether oxidation activates or inhibits JAK2 has been debated [71–74]. While the mechanism of JAK2 hyperphosphorylation in Foxo3 mutant erythroblasts is unclear, reduced expression of Lnk (SH2B3), a negative regulator of JAK2 phosphorylation, in Foxo3 mutant erythroblasts might be implicated (Supplementary Figure 6) [45].
Collectively, these studies support the notion that activation of mTOR signaling as a result of loss of FOXO3 function [45] might be implicated in the pathogenesis of ineffective erythropoiesis as seen in Foxo3 mutant mice. Future studies should elucidate whether and how metabolic abnormalities associated with overactivation of mTOR signaling contribute to erythroblast cell cycle defects.
Supplementary Material
Acknowledgments
We thank Brigitte Izac for technical help, Dr. Jane Little (Case Western Reserve University School of Medicine) for critical reading of the manuscript and The Flow Cytometry Shared Research Facility at Icahn School of Medicine at Mount Sinai School. G.C. was partially supported by the Spanish Ministry of Education. JB was supported by RO1 HL094283 training grant to MB. This work was supported in part by the National Institutes of Health grants RO1 DK077174, RO1 HL116365 (Co-PI), a Roche foundation award, a Black Family Stem Cell Institute award and a Myeloproliferative Neoplasm Foundation (MPN) award to SG.
Footnotes
Authors’ contributions
XZ, designed experiments, performed experiments, analyzed data and participated in writing the paper
GC, designed experiments, performed experiments, analyzed data and participated in writing the paper
SY, PR, SKM, JB, RL designed experiments, performed experiments, analyzed data
VDE, performed experiments,
MHB, facilitated the set up of the in vitro assay
CB, analyzed data and participated in discussions of the data and editing
SR, participated in discussions of the data and editing
DP, analyzed data
SG, designed experiments, analyzed data and wrote the paper
The authors do not have any conflict of interest to declare
References
- 1.McDevitt MA, Xie J, Gordeuk V, et al. The anemia of malaria infection: role of inflammatory cytokines. Current hematology reports. 2004;3:97–106. [PubMed] [Google Scholar]
- 2.Rivella S. Ineffective erythropoiesis and thalassemias. Curr Opin Hematol. 2009;16:187–194. doi: 10.1097/MOH.0b013e32832990a4. [DOI] [PMC free article] [PubMed] [Google Scholar]
- 3.Neumann CA, Krause DS, Carman CV, et al. Essential role for the peroxiredoxin Prdx1 in erythrocyte antioxidant defence and tumour suppression. Nature. 2003;424:561–565. doi: 10.1038/nature01819. [DOI] [PubMed] [Google Scholar]
- 4.Friedman JS, Rebel VI, Derby R, et al. Absence of mitochondrial superoxide dismutase results in a murine hemolytic anemia responsive to therapy with a catalytic antioxidant. J Exp Med. 2001;193:925–934. doi: 10.1084/jem.193.8.925. [DOI] [PMC free article] [PubMed] [Google Scholar]
- 5.Marinkovic D, Zhang X, Yalcin S, et al. Foxo3 is required for the regulation of oxidative stress in erythropoiesis. J Clin Invest. 2007;117:2133–2144. doi: 10.1172/JCI31807. [DOI] [PMC free article] [PubMed] [Google Scholar]
- 6.Yu D, dos Santos CO, Zhao G, et al. miR-451 protects against erythroid oxidant stress by repressing 14-3-3zeta. Genes Dev. 2010;24:1620–1633. doi: 10.1101/gad.1942110. [DOI] [PMC free article] [PubMed] [Google Scholar]
- 7.Kong Y, Zhou S, Kihm AJ, et al. Loss of alpha-hemoglobin-stabilizing protein impairs erythropoiesis and exacerbates beta-thalassemia. J Clin Invest. 2004;114:1457–1466. doi: 10.1172/JCI21982. [DOI] [PMC free article] [PubMed] [Google Scholar]
- 8.Valentine WN. Metabolism of human erythrocytes. Studies in health and disease. Archives of internal medicine. 1975;135:1307–1313. [PubMed] [Google Scholar]
- 9.Bossi D, Giardina B. Red cell physiology. Molecular aspects of medicine. 1996;17:117–128. doi: 10.1016/0098-2997(96)88343-9. [DOI] [PubMed] [Google Scholar]
- 10.Nijhof W, Wierenga PK, Staal GE, et al. Changes in activities and isozyme patterns of glycolytic enzymes during erythroid differentiation in vitro. Blood. 1984;64:607–613. [PubMed] [Google Scholar]
- 11.Kim HD, Koury MJ, Lee SJ, et al. Metabolic adaptation during erythropoietin-mediated terminal differentiation of mouse erythroid cells. Blood. 1991;77:387–392. [PubMed] [Google Scholar]
- 12.Nemoto S, Finkel T. Redox regulation of forkhead proteins through a p66shc-dependent signaling pathway. Science. 2002;295:2450–2452. doi: 10.1126/science.1069004. [DOI] [PubMed] [Google Scholar]
- 13.Kops GJ, Dansen TB, Polderman PE, et al. Forkhead transcription factor FOXO3a protects quiescent cells from oxidative stress. Nature. 2002;419:316–321. doi: 10.1038/nature01036. [DOI] [PubMed] [Google Scholar]
- 14.Zhang X, Rielland M, Yalcin S, et al. Regulation and function of FoxO transcription factors in normal and cancer stem cells: what have we learned? Curr Drug Targets. 2011;12:1267–1283. doi: 10.2174/138945011796150325. [DOI] [PubMed] [Google Scholar]
- 15.van den Berg MC, Burgering BM. Integrating Opposing Signals Toward Forkhead Box O. Antioxid Redox Signal. 2010 doi: 10.1089/ars.2010.3415. [DOI] [PubMed] [Google Scholar]
- 16.Kashii Y, Uchida M, Kirito K, et al. A member of Forkhead family transcription factor, FKHRL1, is one of the downstream molecules of phosphatidylinositol 3-kinase-Akt activation pathway in erythropoietin signal transduction. Blood. 2000;96:941–949. [PubMed] [Google Scholar]
- 17.Uddin S, Kottegoda S, Stigger D, et al. Activation of the Akt/FKHRL1 pathway mediates the antiapoptotic effects of erythropoietin in primary human erythroid progenitors. Biochem Biophys Res Commun. 2000;275:16–19. doi: 10.1006/bbrc.2000.3266. [DOI] [PubMed] [Google Scholar]
- 18.Ghaffari S, Jagani Z, Kitidis C, et al. Cytokines and BCR-ABL mediate suppression of TRAIL-induced apoptosis through inhibition of forkhead FOXO3a transcription factor. Proc Natl Acad Sci U S A. 2003;100:6523–6528. doi: 10.1073/pnas.0731871100. [DOI] [PMC free article] [PubMed] [Google Scholar]
- 19.Bakker WJ, Blazquez-Domingo M, Kolbus A, et al. FoxO3a regulates erythroid differentiation and induces BTG1, an activator of protein arginine methyl transferase 1. J Cell Biol. 2004;164:175–184. doi: 10.1083/jcb.200307056. [DOI] [PMC free article] [PubMed] [Google Scholar]
- 20.Bakker WJ, van Dijk TB, Parren-van Amelsvoort M, et al. Differential regulation of Foxo3a target genes in erythropoiesis. Mol Cell Biol. 2007;27:3839–3854. doi: 10.1128/MCB.01662-06. [DOI] [PMC free article] [PubMed] [Google Scholar]
- 21.Franco SS, De Falco L, Ghaffari S, et al. Resveratrol accelerates erythroid maturation by activation of FoxO3 and ameliorates anemia in beta-thalassemic mice. Haematologica. 2014;99:267–275. doi: 10.3324/haematol.2013.090076. [DOI] [PMC free article] [PubMed] [Google Scholar]
- 22.Pourfarzad F, von Lindern M, Azarkeivan A, et al. Hydroxyurea responsiveness in beta-thalassemic patients is determined by the stress response adaptation of erythroid progenitors and their differentiation propensity. Haematologica. 2013;98:696–704. doi: 10.3324/haematol.2012.074492. [DOI] [PMC free article] [PubMed] [Google Scholar]
- 23.van der Vos KE, Eliasson P, Proikas-Cezanne T, et al. Modulation of glutamine metabolism by the PI(3)K-PKB-FOXO network regulates autophagy. Nat Cell Biol. 2012;14:829–837. doi: 10.1038/ncb2536. [DOI] [PubMed] [Google Scholar]
- 24.Rimmele P, d’Esamard V, Fatih K, et al. Metabolic cross talk between Foxo3 and mTOR is essential for hematopoietic stem cell function. Blood. 2012;120:a856. [Google Scholar]
- 25.Warr MR, Binnewies M, Flach J, et al. FOXO3A directs a protective autophagy program in haematopoietic stem cells. Nature. 2013 doi: 10.1038/nature11895. [DOI] [PMC free article] [PubMed] [Google Scholar]
- 26.Sandri M, Sandri C, Gilbert A, et al. Foxo transcription factors induce the atrophy-related ubiquitin ligase atrogin-1 and cause skeletal muscle atrophy. Cell. 2004;117:399–412. doi: 10.1016/s0092-8674(04)00400-3. [DOI] [PMC free article] [PubMed] [Google Scholar]
- 27.Yeo H, Lyssiotis CA, Zhang Y, et al. FoxO3 coordinates metabolic pathways to maintain redox balance in neural stem cells. EMBO J. 2013;32:2589–2602. doi: 10.1038/emboj.2013.186. [DOI] [PMC free article] [PubMed] [Google Scholar]
- 28.Camprecios G, Barminko J, Bernitz J, et al. Steady State Differences In Metabolic Properties Of Bone Marrow Versus Spleen Erythroid Cells. Blood. 2013;122:943a. [Google Scholar]
- 29.Rimmele P, Bigarella C, Liang R, et al. Aging-Like Phenotype and Defective Lineage Specification in SIRT1-deficient Hematopoietic Stem and Progenitor Cells. Stem Cell Reports. 2014;3:1–16. doi: 10.1016/j.stemcr.2014.04.015. (In press) [DOI] [PMC free article] [PubMed] [Google Scholar]
- 30.Kadri Z, Maouche-Chretien L, Rooke HM, et al. Phosphatidylinositol 3-kinase/Akt induced by erythropoietin renders the erythroid differentiation factor GATA-1 competent for TIMP-1 gene transactivation. Mol Cell Biol. 2005;25:7412–7422. doi: 10.1128/MCB.25.17.7412-7422.2005. [DOI] [PMC free article] [PubMed] [Google Scholar]
- 31.Hammerman PS, Fox CJ, Birnbaum MJ, et al. Pim and Akt oncogenes are independent regulators of hematopoietic cell growth and survival. Blood. 2005;105:4477–4483. doi: 10.1182/blood-2004-09-3706. [DOI] [PMC free article] [PubMed] [Google Scholar]
- 32.Ghaffari S, Kitidis C, Zhao W, et al. AKT induces erythroid-cell maturation of JAK2-deficient fetal liver progenitor cells and is required for Epo regulation of erythroid-cell differentiation. Blood. 2006;107:1888–1891. doi: 10.1182/blood-2005-06-2304. [DOI] [PMC free article] [PubMed] [Google Scholar]
- 33.Zhao W, Kitidis C, Fleming MD, et al. Erythropoietin stimulates phosphorylation and activation of GATA-1 via the PI3-kinase/AKT signaling pathway. Blood. 2006;107:907–915. doi: 10.1182/blood-2005-06-2516. [DOI] [PMC free article] [PubMed] [Google Scholar]
- 34.Howell JJ, Manning BD. mTOR couples cellular nutrient sensing to organismal metabolic homeostasis. Trends Endocrinol Metab. 2011;22:94–102. doi: 10.1016/j.tem.2010.12.003. [DOI] [PMC free article] [PubMed] [Google Scholar]
- 35.Zoncu R, Efeyan A, Sabatini DM. mTOR: from growth signal integration to cancer, diabetes and ageing. Nat Rev Mol Cell Biol. 2011;12:21–35. doi: 10.1038/nrm3025. [DOI] [PMC free article] [PubMed] [Google Scholar]
- 36.Grech G, Blazquez-Domingo M, Kolbus A, et al. Igbp1 is part of a positive feedback loop in stem cell factor-dependent, selective mRNA translation initiation inhibiting erythroid differentiation. Blood. 2008;112:2750–2760. doi: 10.1182/blood-2008-01-133140. [DOI] [PubMed] [Google Scholar]
- 37.Geslain R, Uddin S, Liu H, et al. Distinct functions of erythropoietin and stem cell factor are linked to activation of mTOR kinase signaling pathway in human erythroid progenitors. Cytokine. 2013;61:329–335. doi: 10.1016/j.cyto.2012.10.017. [DOI] [PubMed] [Google Scholar]
- 38.Diekmann F, Rovira J, Diaz-Ricart M, et al. mTOR inhibition and erythropoiesis: microcytosis or anaemia? Nephrol Dial Transplant. 2012;27:537–541. doi: 10.1093/ndt/gfr318. [DOI] [PubMed] [Google Scholar]
- 39.Fishbane S, Cohen DJ, Coyne DW, et al. Posttransplant anemia: the role of sirolimus. Kidney Int. 2009;76:376–382. doi: 10.1038/ki.2009.231. [DOI] [PubMed] [Google Scholar]
- 40.Castrillon DH, Miao L, Kollipara R, et al. Suppression of ovarian follicle activation in mice by the transcription factor Foxo3a. Science. 2003;301:215–218. doi: 10.1126/science.1086336. [DOI] [PubMed] [Google Scholar]
- 41.Yalcin S, Zhang X, Luciano JP, et al. Foxo3 Is Essential for the Regulation of Ataxia Telangiectasia Mutated and Oxidative Stress-mediated Homeostasis of Hematopoietic Stem Cells. J Biol Chem. 2008;283:25692–25705. doi: 10.1074/jbc.M800517200. [DOI] [PubMed] [Google Scholar]
- 42.Ghaffari S, Kitidis C, Fleming MD, et al. Erythropoiesis in the absence of janus-kinase 2: BCR-ABL induces red cell formation in JAK2(−/−) hematopoietic progenitors. Blood. 2001;98:2948–2957. doi: 10.1182/blood.v98.10.2948. [DOI] [PubMed] [Google Scholar]
- 43.England SJ, McGrath KE, Frame JM, et al. Immature erythroblasts with extensive ex vivo self-renewal capacity emerge from the early mammalian fetus. Blood. 2011;117:2708–2717. doi: 10.1182/blood-2010-07-299743. [DOI] [PMC free article] [PubMed] [Google Scholar]
- 44.Chen K, Liu J, Heck S, et al. Resolving the distinct stages in erythroid differentiation based on dynamic changes in membrane protein expression during erythropoiesis. Proc Natl Acad Sci U S A. 2009;106:17413–17418. doi: 10.1073/pnas.0909296106. [DOI] [PMC free article] [PubMed] [Google Scholar]
- 45.Yalcin S, Marinkovic D, Mungamuri SK, et al. ROS-mediated amplification of AKT/mTOR signalling pathway leads to myeloproliferative syndrome in Foxo3(−/−) mice. EMBO J. 2010;29:4118–4131. doi: 10.1038/emboj.2010.292. [DOI] [PMC free article] [PubMed] [Google Scholar]
- 46.Zhang X, Yalcin S, Lee DF, et al. FOXO1 is an essential regulator of pluripotency in human embryonic stem cells. Nat Cell Biol. 2011;13:1092–1099. doi: 10.1038/ncb2293. [DOI] [PMC free article] [PubMed] [Google Scholar]
- 47.Liang R, Ghaffari S. Stem Cells, Redox Signaling, and Stem Cell Aging. Antioxid Redox Signal. 2014 doi: 10.1089/ars.2013.5300. [DOI] [PMC free article] [PubMed] [Google Scholar]
- 48.Sarbassov DD, Sabatini DM. Redox regulation of the nutrient-sensitive raptor-mTOR pathway and complex. J Biol Chem. 2005;280:39505–39509. doi: 10.1074/jbc.M506096200. [DOI] [PubMed] [Google Scholar]
- 49.Yoshida S, Hong S, Suzuki T, et al. Redox regulates mammalian target of rapamycin complex 1 (mTORC1) activity by modulating the TSC1/TSC2-Rheb GTPase pathway. J Biol Chem. 2011;286:32651–32660. doi: 10.1074/jbc.M111.238014. [DOI] [PMC free article] [PubMed] [Google Scholar]
- 50.Ma XM, Blenis J. Molecular mechanisms of mTOR-mediated translational control. Nat Rev Mol Cell Biol. 2009;10:307–318. doi: 10.1038/nrm2672. [DOI] [PubMed] [Google Scholar]
- 51.Gregory CJ. Erythropoietin sensitivity as a differentiation marker in the hemopoietic system: studies of three erythropoietic colony responses in culture. J Cell Physiol. 1976;89:289–301. doi: 10.1002/jcp.1040890212. [DOI] [PubMed] [Google Scholar]
- 52.Ramos P, Casu C, Gardenghi S, et al. Macrophages support pathological erythropoiesis in polycythemia vera and beta-thalassemia. Nat Med. 2013 doi: 10.1038/nm.3126. [DOI] [PMC free article] [PubMed] [Google Scholar]
- 53.Hashimoto D, Chow A, Noizat C, et al. Tissue-resident macrophages self-maintain locally throughout adult life with minimal contribution from circulating monocytes. Immunity. 2013;38:792–804. doi: 10.1016/j.immuni.2013.04.004. [DOI] [PMC free article] [PubMed] [Google Scholar]
- 54.Rivella S. The role of ineffective erythropoiesis in non-transfusion-dependent thalassemia. Blood Rev. 2012;26 (Suppl 1):S12–15. doi: 10.1016/S0268-960X(12)70005-X. [DOI] [PMC free article] [PubMed] [Google Scholar]
- 55.Libani IV, Guy EC, Melchiori L, et al. Decreased differentiation of erythroid cells exacerbates ineffective erythropoiesis in beta-thalassemia. Blood. 2008;112:875–885. doi: 10.1182/blood-2007-12-126938. [DOI] [PMC free article] [PubMed] [Google Scholar]
- 56.Peslak SA, Wenger J, Bemis JC, et al. EPO-mediated expansion of late-stage erythroid progenitors in the bone marrow initiates recovery from sublethal radiation stress. Blood. 2012;120:2501–2511. doi: 10.1182/blood-2011-11-394304. [DOI] [PMC free article] [PubMed] [Google Scholar]
- 57.Dev A, Fang J, Sathyanarayana P, et al. During EPO or anemia challenge, erythroid progenitor cells transit through a selectively expandable proerythroblast pool. Blood. 2010;116:5334–5346. doi: 10.1182/blood-2009-12-258947. [DOI] [PMC free article] [PubMed] [Google Scholar]
- 58.Chen CC, Jeon SM, Bhaskar PT, et al. FoxOs inhibit mTORC1 and activate Akt by inducing the expression of Sestrin3 and Rictor. Dev Cell. 2010;18:592–604. doi: 10.1016/j.devcel.2010.03.008. [DOI] [PMC free article] [PubMed] [Google Scholar]
- 59.Khatri S, Yepiskoposyan H, Gallo CA, et al. FOXO3a regulates glycolysis via transcriptional control of tumor suppressor TSC1. J Biol Chem. 2010;285:15960–15965. doi: 10.1074/jbc.M110.121871. [DOI] [PMC free article] [PubMed] [Google Scholar]
- 60.Sarbassov DD, Ali SM, Kim DH, et al. Rictor, a novel binding partner of mTOR, defines a rapamycin-insensitive and raptor-independent pathway that regulates the cytoskeleton. Curr Biol. 2004;14:1296–1302. doi: 10.1016/j.cub.2004.06.054. [DOI] [PubMed] [Google Scholar]
- 61.Guertin DA, Stevens DM, Thoreen CC, et al. Ablation in mice of the mTORC components raptor, rictor, or mLST8 reveals that mTORC2 is required for signaling to Akt-FOXO and PKCalpha, but not S6K1. Dev Cell. 2006;11:859–871. doi: 10.1016/j.devcel.2006.10.007. [DOI] [PubMed] [Google Scholar]
- 62.Sarbassov DD, Guertin DA, Ali SM, et al. Phosphorylation and regulation of Akt/PKB by the rictor-mTOR complex. Science. 2005;307:1098–1101. doi: 10.1126/science.1106148. [DOI] [PubMed] [Google Scholar]
- 63.Efeyan A, Zoncu R, Sabatini DM. Amino acids and mTORC1: from lysosomes to disease. Trends in molecular medicine. 2012;18:524–533. doi: 10.1016/j.molmed.2012.05.007. [DOI] [PMC free article] [PubMed] [Google Scholar]
- 64.Thein SL. Genetic modifiers of beta-thalassemia. Haematologica. 2005;90:649–660. [PubMed] [Google Scholar]
- 65.Yeo H, Lyssiotis CA, Zhang Y, et al. FoxO3 coordinates metabolic pathways to maintain redox balance in neural stem cells. EMBO J. 2013 doi: 10.1038/emboj.2013.186. [DOI] [PMC free article] [PubMed] [Google Scholar]
- 66.Shinar E, Rachmilewitz EA. Oxidative denaturation of red blood cells in thalassemia. Semin Hematol. 1990;27:70–82. [PubMed] [Google Scholar]
- 67.Scott MD, Eaton JW. Thalassaemic erythrocytes: cellular suicide arising from iron and glutathione-dependent oxidation reactions? Br J Haematol. 1995;91:811–819. doi: 10.1111/j.1365-2141.1995.tb05394.x. [DOI] [PubMed] [Google Scholar]
- 68.Fibach E, Bianchi N, Borgatti M, et al. Effects of rapamycin on accumulation of alpha-, beta- and gamma-globin mRNAs in erythroid precursor cells from beta-thalassaemia patients. Eur J Haematol. 2006;77:437–441. doi: 10.1111/j.1600-0609.2006.00731.x. [DOI] [PubMed] [Google Scholar]
- 69.Bayeva M, Khechaduri A, Puig S, et al. mTOR regulates cellular iron homeostasis through tristetraprolin. Cell Metab. 2012;16:645–657. doi: 10.1016/j.cmet.2012.10.001. [DOI] [PMC free article] [PubMed] [Google Scholar]
- 70.Marty C, Lacout C, Droin N, et al. A role for reactive oxygen species in JAK2 V617F myeloproliferative neoplasm progression. Leukemia. 2013;27:2187–2195. doi: 10.1038/leu.2013.102. [DOI] [PubMed] [Google Scholar]
- 71.Duhe RJ, Evans GA, Erwin RA, et al. Nitric oxide and thiol redox regulation of Janus kinase activity. Proc Natl Acad Sci U S A. 1998;95:126–131. doi: 10.1073/pnas.95.1.126. [DOI] [PMC free article] [PubMed] [Google Scholar]
- 72.Maziere C, Conte MA, Maziere JC. Activation of JAK2 by the oxidative stress generated with oxidized low-density lipoprotein. Free Radic Biol Med. 2001;31:1334–1340. doi: 10.1016/s0891-5849(01)00649-9. [DOI] [PubMed] [Google Scholar]
- 73.Nieborowska-Skorska M, Kopinski PK, Ray R, et al. Rac2-MRC-cIII-generated ROS cause genomic instability in chronic myeloid leukemia stem cells and primitive progenitors. Blood. 2012;119:4253–4263. doi: 10.1182/blood-2011-10-385658. [DOI] [PMC free article] [PubMed] [Google Scholar]
- 74.Walz C, Crowley BJ, Hudon HE, et al. Activated JAK2 with the V617F point mutation promotes G1/S-phase transition. J Biol Chem. 2006 doi: 10.1074/jbc.M600064200. [DOI] [PubMed] [Google Scholar]
Associated Data
This section collects any data citations, data availability statements, or supplementary materials included in this article.