

Abstract
Hearing loss is one of the most common sensorineural defects in humans. Autosomal-recessive nonsyndromic hearing loss (ARNSHL) is the most frequent form among inherited forms of deafness and accounts for greater than 70% of the cases. Due to extreme genetic heterogeneity of ARNSHL, many known loci have to be screened to find linkage to deafness genes or before proceeding to a genome wide analysis to identify a new locus for the disorder. Microsatellite based homozygosity mapping is an excellent option but throughput is low as it yields genotype information at only one locus per reaction. This makes screening a large number of loci very laborious and expensive. Here we describe a protocol to reduce the time and costs of microsatellite based screening. It involves selecting microsatellite markers close to the known deafness genes thereby decreasing the number of markers required to screen for each locus and multiplexing the PCR reactions. Furthermore, primers for some known microsatellites were redesigned for multiplexing and finally a protocol of genotyping with fluorescently labeled universal M13 primers was incorporated in the strategy.
Keywords: Microsatellite genotyping, multiplex, hearing loss, M13 genotyping protocol
INTRODUCTION
Alarge number of genes are anticipated to be responsible for controlling the anatomic and physiological function of the ear (Friedman and Griffith, 2003). Phenotypically, hearing impairment is classified as syndromic and non-syndromic. Non-syndromic forms of deafness transmitted as a recessive trait are the most common cause of hereditary hearing loss (Cohen and Gorlin, 1995). Recessive deafness is more prevalent in endogamous and isolated populations (Friedman and Griffith, 2003) and Pakistan represents a treasure for molecular dissection of hearing disorder because 60% of marriages are consanguineous in which approximately 80% are between first cousins (Hussain and Bittles, 1998). About 66 loci and 38 genes are known which cause autosomal recessive non-syndromic hearing loss (http://hereditaryhearingloss.org last updated 8 September, 2011). Many of these loci were first mapped in Pakistani families.
Microsatellites, also known as simple sequence repeats (SSRs) or short tandem repeats (STRs), remain a popular marker type in population genetic studies. They consist of motifs of two to six nucleotides tandemly repeated several times that have a characteristic mutational behavior (Kelkar et al., 2010). As a consequence of their elevated mutation rates, STRs are typically highly polymorphic: different individuals exhibit variations manifested as repeat number differences. Fluorescently labeled microsatellite markers have various applications such as DNA fingerprinting, paternal analyses, genetic mapping or genetic structure analyses.
Before proceeding to identify new loci for hearing loss, it is important to exclude known genes which cause deafness. This is usually accomplished by direct sequencing of GJB2 and exclusion of other loci using homozygosity mapping with STR markers. Homozygosity mapping is applied by genotyping two or three fluorescently labeled microsatellite markers per locus. Individual microsatellite markers are first amplified, then markers of non-overlapping sizes or dyes are pooled together and run on automated capillary electrophoresis equipment where fragments are separated and read by a laser beam. As the number of loci to be screened for non-syndromic recessive deafness is very high, the process is costly, especially for small budget laboratories. A method which could effectively screen for all deafness loci of interest in a cost effective manner would offer significant savings to such laboratories. In our genetic study we screen 38 known genes for hearing loss and 6 genes mutations in which cause autosomal recessive syndromic hearing loss and for which phenotypes are often misdiagnosed as non-syndromic. These loci and their respective genes are summarized in Table I. We have developed a screening protocol which cuts down the number of PCR reactions by approximately 40% and reduces 25% of the running costs of electrophoresis.
Table I.
Loci screened: 38 ARNSHL genes and 6 autosomal recessive syndromic hearing loss genes included in this study. Two loci DFNB32 and USH1H for which genes are unknown were also included in this study since severe hearing loss is associated with DFNB32, while some patients with USH1H may inadvertently be included in our study if they have atypical manifestation of USH1.
| Locus | Gene |
|---|---|
| DFNB1A | GJB2 |
| DFNB2 | MYO7A |
| DFNB3 | MYO15A |
| DFNB4/PDS | SLC26A4 |
| DFNB6 | TMIE |
| DFNB7/11 | TMC1 |
| DFNB8/10 | TMPRSS3 |
| DFNB9 | OTOF |
| DFNB12 | CDH23 |
| DFNB15/72/95 | GIPC3 |
| DFNB16 | STRC |
| DFNB18 | USH1C |
| DFNB21 | TECTA |
| DFNB22 | OTOA |
| DFNB23 | PCDH15 |
| DFNB25 | GRXCR1 |
| DFNB28 | TRIOBP |
| DFNB29 | CLDN14 |
| DFNB30 | MYO3A |
| DFNB31 | WHRN |
| DFNB32 | Unknown |
| DFNB35 | ESRRB |
| DFNB36 | ESPN |
| DFNB37 | MYO6 |
| DFNB39 | HGF |
| DFNB42 | ILDR1 |
| DFNB49 | MARVELD2 |
| DFNB53 | COL11A2 |
| DFNB59 | PJVK |
| DFNB61 | SLC26A5 |
| DFNB63 | LRTOMT/COMT2 |
| DFNB66/67 | LHFPL5 |
| DFNB74 | MSRB3 |
| DFNB77 | LOXHD1 |
| DFNB79 | TPRN |
| DFNB84 | PTPRQ |
| DFNB91 | SERPINB6 |
| NA | GJB3 |
| ARSHL Loci and Genes | |
| USH1G | SANS |
| USH1H | Unknown |
| USH2A | USH2A |
| USH2C | VLGR1 |
| USH3 | USH3A |
| NA | PDZD7 |
NA, not applicable.
MATERIALS AND METHODS
Genomic DNA extraction and quantification
Ten families segregating moderate to severe or progressive ARNSHL were selected. 5–10 ml of blood sample was drawn from all affected and unaffected members of the families after obtaining Institutional Review Board approval and written informed consent from the participants. Genomic DNA was extracted using a non-organic method (Grimberg et al., 1989). DNA samples were quantified and diluted to working concentration of 25 ng/μl.
Primers
All primers were either designed using primer3 software http://frodo.wi.mit.edu/primer3/ or were kindly provided by Laboratory of Molecular Genetics, National Institute of Deafness and Other Communication Disorders, National Institute of Health, USA. Primers were labeled with any of the four fluorescent dye labels i.e., FAM, VIC, NED, and PET. In some cases HEX fluorescent dye was used as well. Most of the selected STR markers contain dinucleotide repeat motifs while a few have tetranucleotide repeat motifs. We designed new primers for some previously described STR markers with size ranges of 300 – 470 bp. We also redesigned primers for a few other markers in 100–300 bp range for better co-amplifications. Both these practices considerably increased the number of markers that could be multiplexed or pooled together. STR markers were chosen upstream and downstream of each gene in close proximity in order to minimize the number of STR markers required to be genotyped per locus. Recently, we have started ordering forward primers tailed with universal M13 sequence at 5′ end instead of a fluorescent dye label (Schuelke, 2000). The label is incorporated during PCR through the use of a separate universal M13 primer, which has one of the four fluorescent dye-labels; this dramatically reduces the costs as each primer for the marker does not have to be individually fluorescently labeled and only one synthesis of four fluorescently labeled M13 universal primers is sufficient for many thousands of reactions. This M13 genotyping strategy is summarized in Figure 1. Sequences of the designed primers are provided in Table II.
Fig. 1.

M13 genotyping protocol: A) Incorporation of forward primer with the M13 tail into the PCR products. Reverse complement of M13 tail is the target for incorporation of fluorescently labeled M13 universal primer. Sufficient template is available for subsequent cycles after a few PCR cycles carried out at higher annealing temperatures. B) During the subsequent cycles a lowered annealing temperature of 55 °C allows incorporation of fluorescently labeled M13 universal primer into the amplicon. The final product is thus fluorescently labeled which can be analyzed using a laser detection system.
Table II.
Primer Sequences. “c” stands for custom i.e., self-designed, commercially synthesized primers and “ M” for M13 tailed primers. 19 bp M13 universal sequence (5′-CACGACGTTGTAAAACGAC) is written along with the marker specific forward primer sequences.
| Marker | Forward Primer | Reverse Primer |
|---|---|---|
| D21S1411c | TGTGTGTCCTTCCAGGCTTT | GTGGATAGAGAGATAGAACGGATAGAA |
| D16S3046c | AATAAACTGCGTGCGCTCAT | GTAATTTCATGGACCCCCTATTG |
| D17S1301c | ATGTGTATAACAAAATTCCTATGATGG | GGGTGACAGAGCAAGGTTCT |
| D15S968c | CAGTGCTTACCTGGGTCCAT | GCTCTATATTGGGGCCAAGC |
| D14S983c | ATTGGACTGGTTAGCCTCAGTG | GCATCAACTGGCTTCCAATC |
| D14S61c | CGGAGTCAATATGCTCTGGA | GGCGTATCAGAGAGGAAGGTT |
| D2S1245c | TGAAAGCTGGTGAATAAAGGG | GCCACTACAGCTTGCTTGC |
| USH1GU1 | AGCAAGCCCTTCTGCTCTCT | GCCAAAGTGGGAAGATCACT |
| D2S324c | GCACAAACTTTACATGCACACA | CCGATGTCTGGCATATCCTC |
| D9S158c | CATAAAGTAGGCAAAGCGGAAA | GTCCGTTGCCTCTGAAGATGT |
| C21SA2 | CGT TGTTGGCCTTCAGAT TT | GCT GTG AGG CCA GAG AGA AA |
| M D17S2207c | CACGACGTTGTAAAACGACCAGTGTTTACTGAGGCCTTTCTG | CGGTTGACGGAGTGAGACTG |
| M D15S988c | CACGACGTTGTAAAACGACGGATGAAAACATCTGGTTCAAA | TTCGGTTTAAGAATGATTGTTCC |
| D21S167c | ACCAGCTTCAAACGTGCAG | GCATCAGTGCTCTGTTTGGTT |
| D10S1775c | CCTCCCCTAGTTAATGGATGT | GATTTTCACAGGTATTGCTGAGT |
| M D15S967c | CACGACGTTGTAAAACGACTCAAGGTGAGACACCACAGG | CATACAGGACCCCAGGAAGA |
| D10S1643c | CCTTAATCACATAAGCCAATTTCTGA | CCACTTCTCAGTGCCAAAATCT |
| M D4S2369c | CACGACGTTGTAAAACGACTGGCATGAGCAACCTTACAG | CTCCAGACTGGGCGATAGAG |
| USH3Acc | CGTTACTTAATGCCATATCCCTA | TCAGGCCCAGGGTACTTT |
| D15S1025c | CACGACGTTGTAAAACGACATGCCCTTGCTGATGTTTTC | GCAAGGTGCAGAACAATATGC |
| M D12S2074cFN | CACGACGTTGTAAAACGACAGGTGGTCTGTAGGCTACGTG | CCAAACCCCAAACCATACAT |
| D11S4138c | CCAGGGTTAGTGTGGGAGAG | GGTCAGACTGAGGTGAGAAGG |
| D10S606c | AAGACATCGCAACATGGACA | TTGTTTGAACCTGGGAGACG |
| D11S911c | CTCTTCTCATGCTTGACCATTT | CCTTCTGAACAATTGCCACAT |
| M D12S1708c | CACGACGTTGTAAAACGACGGAAGCATGCCTTTTGAAAT | ACAGACATGCACCACCACAC |
| M C6SU1 | CACGACGTTGTAAAACGACGTGCCAGGAACCAAGGACTA | GAGGCTGAGGCACAAGAATC |
| M C6SD1 | CACGACGTTGTAAAACGACCCAGAGCTGAGAAAGAACAAA | GCCTGAGTGACAGAGTGAGACT |
| D9S1837c | CAGAAATGGCAGCTGGTGT | GTTCATGATGGTGGTCTCTGG |
| D9S1876c | TAGTGGTTACCATTTACCCAAGA | AAGATGTACCCAGAGAAGTCTCG |
| D11S4186c | CCAGATTATTCTCCCAATCTATCG | GCACGTGCTGTGCAGTGTA |
| M D4S3357c | CACGACGTTGTAAAACGACTGCTTCAAAGAGGAATTGATGA | GGCTGATTAGTATGCCATTGGA |
| D10S1759c | ACCTACTCCCTGCACAACTGG | GAATGGGCACGCTCACAC |
| D11S1314c | AAGGCAGGAAATGTGACCTC | GGTTGCACTTAGACATGCACA |
| D5S618c | TGATTGAAGGATGCCAAATTAC | GGTGACCAAGGCTTCACAG |
| GATA123E07c | TCAGTGATGGCATAGCTAGATAGAA | TTTTGAGGTCTATCCATGTTGG |
| D10S89c | CTGAAGGCTTCTGGAGCA | GGCATAAGTTAAGAACACTAGTGACA |
| D7S2504c | AGGCCACCACAATGTCAGTT | GCAATGAGAGATGCTTGGAATA |
| D10S197c | CCTCAAGTGGCATTGTGAAA | GTTGCAGTGAGCTGAGATCG |
| M D1S441c | CACGACGTTGTAAAACGACTAATTGCACCACTGCACTCC | TTAAAGATTAGCCGAGCATGG |
| D1S2629c | TCCAACAGCAGATAAGTGGATG | CCAATTCCATTCATGTTACTGTCA |
| D16S403c | GAGCCTCAGGCCTTTATGA | GTTTTCTCCCTGGGACATTT |
| D11S902c | CCCGGCTGTGAATATACTTAATG | CCAACAGCAATGGGAAGTT |
| D5S815c | CTTGTGTAGCAAATTACAGCTTACA | TCTGCCATGATTGTTAAGTTTCC |
| D7S2448c | CCTGGAATCACAGCCTCATAA | GTTCCCCAGGCTCCAACT |
| D10S546c | GACTCCAGCCTTTCACACCT | GGCAAAGTTGATGCTGCTTA |
| D11S4139c | TCTTTGATTTGCTGGAAGATGC | GTCACACGTGCACACACTCTTAC |
| D9S1824c | CTTCCTCTCTGGTCTCCCTGT | GCTCCCCTGGATTTCCTAA |
| D1S229c | TGGTATGGACTCCAGTCAGG | GGCACACAATTGTCCCTACA |
| D2S174c | TTAGAGCACACATGGTCACTCC | GCTCCAGAAGTGGCTACAGG |
| D6S1031c | CAGCACTCACATGCTTATCCTTT | GAATCCGTCTCACAGGCTCA |
| D6S456c | CAGCACTCACATGCTTATCCTTT | GAATCCGTCTCACAGGCTCA |
| M D12S1686c | CACGACGTTGTAAAACGACATTGGAGGACCCACAGTCAG | ATGCTTCTGCTTGACCTGCT |
| M C3SB42A | CACGACGTTGTAAAACGACTTGAGGTCTGTGAGTGGCTTC | GAGGTTGAAGTGAGCGGAGA |
| D1S2870c | ATAGGTGTGAGCCACTGCAC | GCCTGGGCAGATACTTAGGA |
| D2S2223c | CCTCCCTTGATTGCTTTGAA | CCTGAAATGTTTGGCGATTT |
| GATA129G03c | TCAGATTATGTTCTCATACAGCCTTT | GAAACTGGGCAGAGGCATAG |
| M D1S417c | CACGACGTTGTAAAACGACCTGAGGTCTGATCCCTCTGG | AGGCTGTACCATTTAGGTTCG |
| M D1S2652c | CACGACGTTGTAAAACGACCCAATGAGACCAAGCAGGAT | GAAAATGGCACATGTTGTGG |
| M C19SA2 | CACGACGTTGTAAAACGACTCTCATTGGGGTCCTTCTTG | GGGCAACAAGAGCGAAACT |
| M C19SA3 | CACGACGTTGTAAAACGACTCCATCCTTGCCTTAACACC | GAGGCAGAGGTTCCTGTGAG |
| D6S1618c | CCATGGCATCTGTCCTTCC | GCTCACACTGGCTTCTCCTT |
| D10S1265c | AGAATGGCCAGTACAAACAATC | GTAATTTCCATTGCTGACAGG |
| M D12S75c | CACGACGTTGTAAAACGACGAAGCAGAAGCTGCCAGAAT | CCTACCTTGATCCGACCTGA |
| M D3S4019c | CACGACGTTGTAAAACGACGGTGGTGGGCGCCTGTAGT | ACCCAGAAAGGGGTCCCAAG |
| D22S272c | AATGCCTTCAGCATGGACCT | GGCATACAGGAGCCTAGACAGG |
| GATA64B01c | TGCCTAATTTTCCTGTATTGTTCC | AATTAGCTGGGTGTGGTGGT |
| M D1S475c | CACGACGTTGTAAAACGACATGGTTACGTGAGCCCAGTC | CACTCCCCTTCAGACTGCTG |
| D6S1285c | AAAGCACTCTGAACACAGATAATGTAA | TTTGGCCTAGCTCTTTCACC |
| M D7S660c | CACGACGTTGTAAAACGACTTCCAATAGGCCAACACTGG | GAAACATAATATCCAACATGGTGAC |
| M D7S802c | CACGACGTTGTAAAACGACATGCAGAGAAACCTTGTGAGA | ACATAGGCCCCCAATCTCTT |
| D22S1045c | TGCAGGCCTCTTAGGATCTG | GTGTGACCTCAGGCAAGTCC |
Validation of each STR by simplex PCR
The STR markers used in this study were validated in simplex PCR reactions. These were well amplified and produced reproducible genotypes. The simplex reaction composition and other conditions are described in Table III.
Table III.
PCR composition. Comparison of the usual PCR reagents quantities per 10μl volume of standard simplex vs. multiplex PCR reaction with or without M13 tailed primers. The fluorescently labeled universal M13 primer was only added when using 5′-M13 universal sequence tailed forward primers for each marker.
| Reagents | μl/simplex | μl/multiplex | Final concentration |
|---|---|---|---|
| 10X PCR Buffer | 1 | 1 | 1X |
| 2.5 mM dNTPs (Fermentas) | 0.8 | 0.8 | 200 μM each |
| 5U/μl Taq (Fermentas) | 0.075–0.1 | 0.075–0.1 | 0.375–0.5 U |
| 5–10 μM primers | 0.24–0.48 | 0.24–0.48 | 0.24 μM each |
| 10 μM Labeled M13 primer | 0–0.24 | 0–0.24 | 0–0.24 μM |
| 25 mM MgCl2 | 0.8 | 0.8 | 2 mM |
| DNA | 50ng | 50ng | 50ng |
| Water | To 10μl | To 10μl | To 10μl |
Multiplexing of STR markers
All markers to be screened were divided into 8 pools. Markers for prevalent deafness loci and those of special interest were placed in the first few pools and so on. Each pool contained markers with four dye labels and all size ranges. Two markers of same fluorescent label and differing in size by at least 50–70 bp were multiplexed in a single reaction.
Multiplex PCR
Most of the multiplex reactions were optimized with laboratory prepared 10X PCR buffer containing 450 mM Tris pH=9. 45 μM disodium-EDTA, 110 mM (NH4)2SO4, 67 mM B-mercaptoethanol, and 1100μg/ml BSA (Jeffreys et al., 1990). For few STR markers Fermentas 10X Ammonium Sulfate buffer (200mM (NH4)2SO4, 750mM Tris pH=8.8, Tween 20 0.1%) was used. Reaction composition is summarized in Table III.
Touchdown PCR protocols were used to amplify STR markers. This involved progressively reducing annealing temperature in successive annealing cycles, so that the optimal annealing temperature of every primer pair was matched at some point during PCR. For our study a temperature decrease of 1°C/cycle from 65°C −55°C worked for most of the multiplex primer sets. The exceptions are indicated in Table IV. Most reactions were optimized on 2720 Thermal Cycler-(Applied Biosystems). Some simplex reactions were optimized on Mycycler (Bio-Rad) or Mastercycler (Eppendorf). The touchdown PCR profile used is graphically represented in Figure 2.
Table IV.
Pools of STR Markers. The marker labels are placed as prefixes and “M” is acronym for universal M13 sequence tailed primers. The self-designed primers and LMG, NIH provided primers can be distinguished in the table by “c” (custom) suffixes for the self-designed ones. The “+” sign is placed between two markers multiplexed together.
| Pool 1 |
| FAM D1S248+D9S1838 |
| FAM SN18–27 |
| FAM D1S3723R2* |
| VIC D21S1411c+D7S2459 |
| VIC D16S3046c+D21S1225 |
| NED D17S1301c |
| NED D15S968c |
| NED B16Set2** |
| NED D7S496* |
| PET D14S983c+ D14S61c |
| PET D2S1245c |
| Pool 2 |
| FAM D1S495+USH1GU1 |
| NED D17S2206+M D2S324c |
| VIC D9S158c+HEX C21SA2 |
| M HEX D17S2207c |
| PET D21S167c+M D15S988c |
| FAM D11S4107+ D7S2420 |
| NED D21S1252 |
| Pool 3 |
| FAM SN1–141.48B+D1S2730 |
| FAM D10S1775c+M D1S967c |
| NED D10S1643c+B16SET4 |
| M HEX D4S2369c |
| VIC USH3ACc+ M D15S1025c |
| M PET D12S2074cfn |
| Pool 4 |
| PET D11S1438c+D10S606c |
| PET D11S911c |
| FAM D5S637+M D12S1708c |
| FAM D9S1837c +M C6SU1 |
| NED D9S1876c+D11S4186c |
| NED D11S925 |
| VIC D10S1759c+M HEX |
| D4S3357c |
| VIC D11S1314c |
| M HEX C6SD1*** |
| Pool 5 |
| FAM D5S1463+SN18–36 |
| NED OTOA55U+D5S618c |
| VIC GATA123E07c |
| VIC D10S89c+D7S2504c |
| PET D10S197c*** |
| FAM D5S629 |
| M FAM D1S441c**** |
| Pool 6 |
| NED D1S2629c+D16S403c |
| FAM D11S902c+D5S815c |
| NED D7S2448c+D10S546c |
| FAM D11S4139c |
| VIC D9S1824c+D1S2827 |
| PET D1S229c+D3S1594 |
| Pool 7 |
| VIC D6S1560+D2S174c |
| VIC D6S1031c+D6S456c |
| FAM D3S1767+M D12S1686c |
| M FAM C3SB42A***** |
| FAM D1S2870c |
| NED D2S2223c+GATA129G03c |
| M PET D1S417c |
| M PET D1S2652c |
| M NED C19SA2+C19SA3 |
| Pool 8 |
| FAM D6S1686c+D10S1265c |
| M FAM D12S75c+ D3S4019c |
| VIC D1S3774+D22S272c |
| VIC GATA64B01c****** |
| NED D3S3582+M D1S475c |
| PET D6S1285c+M D7S660c |
| PET D22S1045c +M D7S802c |
An asterisk sign marks exceptional conditions required for amplification.
65–53 touchdown, (NH4)2SO4 Buffer, MyCycler-(Bio-Rad),
70–55 touchdown, 3.5Mm MgCl2, MyCycler-(Bio-Rad,),
68–55touchdown 1.5mM MgCl2, Mastercycler (Eppendorf),
65–57touchdown, MyCycler-(Bio-Rad,),
65–53touchdown, 1.5mM MgCl2,
(NH4)2SO4 Buffer, Mastercycler (Eppendorf).
Fig. 2.

Touchdown PCR profile.
Agarsose gel electrophoresis
Successful amplification of the markers after multiplex and simplex reactions was checked by running on 1.5% agarose gel.
Pooling
A total of 101 STR markers, ranging in size from 80–470 and labeled with five flourochromes (FAM, PET, VIC, HEX, NED) were divided into 8 pseudo-multiplex pools with on average 12 markers per pool. Double volume of PET and NED was pooled as compared to other two labels. Additionally, a bit higher volume (0.5–1μl) for multiplex reactions was pooled as compared to simplex PCR reaction. LIZ 500 was used as an inlane size standard.
Electrophoresis and data analysis
Pooled markers were electrophoresed on ABI Genetic Analyzer 310 or 3730 (Applied Biosystems) and the data was analyzed using Genemapper v3.2. The allele calling was done by using allele size calling and binning functions of the program.
RESULTS AND DISCUSSION
All markers in a pool were multiplexed in combinations of two and those were selected that could be easily visualized on an agarose gel. Uniformly and equally amplified combinations of markers with a size difference of 50 –100 bp were considered best. A total of 101 markers were optimized into 37 multiplex and 24 simplex reactions saving 40% of the reaction costs. All families were successfully screened using this strategy. The marker combinations multiplexed and pooled together are summarized in Table IV along with dye labels and reaction conditions. The combinations which showed unequal and irreproducible amplification were discarded and simplex PCR reactions were used for their amplification. Markers which required exceptional amplification conditions were also not multiplexed. We plan to design new primers for these STR markers so that they can be included in multiplex reactions in order to further lower the genotyping costs.
Primers tailed with M13 universal sequence did equally well both in multiplex and simplex PCR reactions. M13 markers have been previously reported to not amplify well, requiring additional amplification cycles or producing more stutter peaks when genotyped (de Arruda et al., 2010; Guichoux et al., 2011). We did not encounter any of these problems when we used universal M13 sequence tailed primers (Fig. 3). This technique is cost-effective because the cost of direct fluorescent primer labeling is typically five to ten times higher than the cost of the synthesis of an unlabelled primer (Hayden et al., 2008).
Fig. 3.
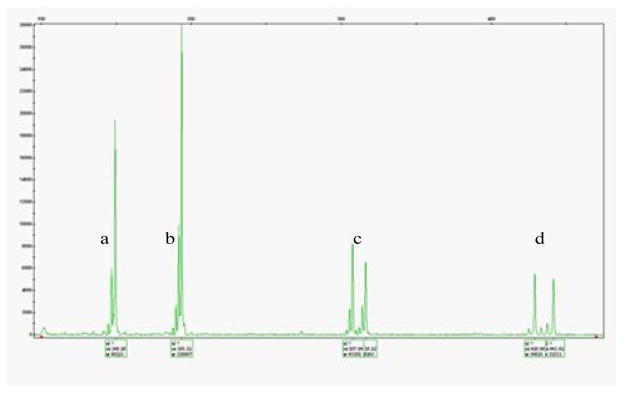
Electropherogram. The X-axis indicates a size scale (in base pair). The Y-axis indicates height scale corresponding to the fluorescent intensities of detected peaks. Allelic peaks a, b, c, d correspond to VIC D10S89c, D10S1759c, D7S2504c and M13F D4S3357c respectively which were amplified in two multiplex reactions b+d (VIC D10S1759c+M D4S3357c) and a+c (VIC D10S89c+ D7S2504c). Two reactions were pooled together in this run.
The fact that allelic range size often reaches up to 50 bp or 100 bp and that amplicons measuring over 300 bp are rarely used (Hill et al., 2009; Chen et al., 2010) places an upper limit on the number of markers that can be pooled together for running. However, we designed primers for amplicons ranging in size from 80 bp-470 bp which considerably expanded the number of markers placed in the pools, reducing 25% of the capillary electrophoresis costs.
Although, we have multiplexed two markers per reaction, there is potential for improvement in the whole genotyping process. Improvements can be easily achieved by multiplexing more markers together and by using additional fluorochromes. New primers can also be designed for high throughput using multiplex primer designing software like Multiplex Manager (Hooley and Greets, 2009). Rapid automated alternatives are now available which can sequence all known genes for deafness using a solution – based sequence capture, followed by massively parallel sequencing (called OtoSCOPE), but these are currently expensive costing about $ 1500 per sample (http://www.healthcare.uiowa.edu/labs/morl/Gene_List_Complete.htm). Until the costs for the screenings are reduced considerably, it will be useful to first rule out common deafness loci with some cheaper protocol before utilizing these sophisticated and expensive technologies.
Acknowledgments
We are grateful to Dr. Thomas B Friedman for his kind support in providing many primers and also to Dr. Christine Klein for providing M13 (NED, VIC, PET) labeled universal oligonucleotides. We also thank them for review of the manuscript. We thank Ms. Rasheeda Bashir for validation of markers by simplex PCR and Ms. Barbara Zweisler for assistance. This research was supported by Grant number R01TW007608 from the Fogarty International Center and National Institute of Deafness and other Communication Disorders, National Institutes of Health, USA.
References
- CHEN JW, UBOH CE, SOMA LR, LI XQ, GUAN FY, YOU YW, LIU Y. Identification of racehorse and sample contamination by novel 24-Plex STR system. Forensic Sci Int-Gen. 2010;4:158–167. doi: 10.1016/j.fsigen.2009.08.001. [DOI] [PubMed] [Google Scholar]
- COHEN MM, GORLIN RJ. Epidemiology, etiology, and genetic patterns in hereditary hearing loss and its syndromes. Oxford University Press; Oxford: 1995. pp. 9–21. [Google Scholar]
- De ARRUDA M, GONÇALVES E, SCHNEIDER M, Da COSTA, Da SILVA A, MORIELLE-VERSUTE E. An alternative genotyping method using dye-labeled universal primer to reduce unspecific amplifications. Mol Biol Rep. 2010;37:2031–2036. doi: 10.1007/s11033-009-9655-7. [DOI] [PubMed] [Google Scholar]
- FRIEDMAN TB, GRIFFITH AJ. Human nonsyndromic sensorineural deafness. Annu Rev Genom Hum G. 2003;4:341–402. doi: 10.1146/annurev.genom.4.070802.110347. [DOI] [PubMed] [Google Scholar]
- GRIMBERG S, NAWOSCHIK L, BELLUSCIO R, MCKEE A, TURCK A, EISENBERGET A. A simple and efficient non-organic procedure for the isolation of genomic DNA from blood. Nucl Acids Res. 1989;17:83–90. doi: 10.1093/nar/17.20.8390. [DOI] [PMC free article] [PubMed] [Google Scholar]
- GUICHOUX E, LAGACHE L, WAGNER S, LÉGER P, LEPAIS O, LEPOITTEVIN C, MALAUSA T, REVANDEL E, SALIN F, PETIT RJ. Current trends in microsatellite genotyping. Mol Ecol Res. 2011;11:591–611. doi: 10.1111/j.1755-0998.2011.03014.x. [DOI] [PubMed] [Google Scholar]
- HAYDEN MJ, NGUYEN TM, WATERMAN A, CHALMERS KJ. Multiplex-ready PCR: A new method for multiplexed SSR and SNP genotyping. BMC Genomics. 2008;9:80. doi: 10.1186/1471-2164-9-80. [DOI] [PMC free article] [PubMed] [Google Scholar]
- HILL CR, BUTLER JM, VALLONE PM. A 26plex autosomal STR assay to aid human identity testing. J Forensic Sci. 2009;54:1008–1015. doi: 10.1111/j.1556-4029.2009.01110.x. [DOI] [PubMed] [Google Scholar]
- HOLLELEY CE, GEERTS PG. Multiplex manager 1.0: A cross-platform computer program that plans and optimizes multiplex PCR. BioTechniques. 2009;46:511–517. doi: 10.2144/000113156. [DOI] [PubMed] [Google Scholar]
- HUSSAIN R, BITTLES AH. The prevalence and demographic characteristics of consanguineous marriages in Pakistan. J Biosoc Sci. 1998;30:261–75. doi: 10.1017/s0021932098002612. [DOI] [PubMed] [Google Scholar]
- JEFFREYS AJ, NEUMANN R, WILSON V. Repeat Unit sequence variation in minisatellites: A novel source of DNA polymorphism for studying variation and mutation by single molecule analysis. Cell. 1990;60:473–485. doi: 10.1016/0092-8674(90)90598-9. [DOI] [PubMed] [Google Scholar]
- KELKAR YD, STRUBCZEWSKI N, HILE SE, CHIAROMONTE F, ECKERT KA, MAKOVA KD. What is a microsatellite: A computational and experimental definition based upon repeat mutational behavior at A/T and GT/AC repeats. Genome Biol Evol. 2010;2:620–635. doi: 10.1093/gbe/evq046. [DOI] [PMC free article] [PubMed] [Google Scholar]
- SCHUELKE M. An economic method for the fluorescent labeling of PCR fragments. Nature Biotech. 2000;18:233–234. doi: 10.1038/72708. [DOI] [PubMed] [Google Scholar]