

Abstract
Determination of quantitative thermodynamic and kinetic frameworks for ribozymes derived from the Azoarcus group I intron and comparisons to their well-studied analogs from the Tetrahymena group I intron reveal similarities and differences between these RNAs. The guanosine (G) substrate binds to the Azoarcus and Tetrahymena ribozymes with similar equilibrium binding constants and similar very slow association rate constants. These and additional literature observations support a model in which the free ribozyme is not conformationally competent to bind G and in which the probability of assuming the binding-competent state is determined by tertiary interactions of peripheral elements. As proposed previously, the slow binding of guanosine may play a role in the specificity of group I intron self-splicing, and slow binding may be used analogously in other biological processes. The internal equilibrium between ribozyme-bound substrates and products is similar for these ribozymes, but the Azoarcus ribozyme does not display the coupling in the binding of substrates that is observed with the Tetrahymena ribozyme, suggesting that local preorganization of the active site and rearrangements within the active site upon substrate binding are different for these ribozymes. Our results also confirm the much greater tertiary binding energy of the 5′-splice site analog with the Azoarcus ribozyme, binding energy that presumably compensates for the fewer base-pairing interactions to allow the 5′-exon intermediate in self splicing to remain bound subsequent to 5′-exon cleavage and prior to exon ligation. Most generally, these frameworks provide a foundation for design and interpretation of experiments investigating fundamental properties of these and other structured RNAs.
Keywords: Group I intron, ribozyme, catalytic framework, noncoding RNA
INTRODUCTION
Over the past two decades, group I introns have served as versatile and powerful model systems for revealing fundamental properties of RNA. The most-studied reaction comes from shortened ribozyme constructs derived from the self-splicing group I intron from Tetrahymena thermophila (Hougland et al. 2006). Knowledge gained from in-depth kinetic and thermodynamic characterization of the Tetrahymena ribozyme laid the foundation for further dissection of ribozyme structure and function, facilitated RNA folding studies, revealed new general properties of RNA, and allowed demonstration of the fundamental interconnection of binding and rate enhancement in enzymatic catalysis (e.g., Narlikar et al. 1995, 1997; Zarrinkar and Williamson 1996; Narlikar and Herschlag 1998; Karbstein and Herschlag 2003; Doudna and Lorsch 2005; Hougland et al. 2006; Bhaskaran and Russell 2007; Wan et al. 2009; Solomatin et al. 2010; Benz-Moy and Herschlag 2011). The advances in our understanding of RNA function garnered by careful study of the catalytic cycle of the Tetrahymena ribozyme highlight the power and necessity of in-depth analysis (Cech et al. 1992; Herschlag and Cech 1996; Hougland et al. 2006).
All group I ribozymes share a highly conserved catalytic core and catalyze analogous phosphoryl-transfer reactions in which an exogenous guanosine nucleophile attacks at a specific G•U wobble pair in an oligonucleotide substrate that is analogous to the 5′-splice site (Scheme 1; Michel and Westhof 1990; Hougland et al. 2006). Different classes of group I introns have distinct interactions and domains that surround the catalytic core (Michel and Westhof 1990; Zhou et al. 2008). For example, the catalytic core of the Tetrahymena intron is encircled by peripheral domains that connect to one another via five long-range tertiary contacts, while the smaller Azoarcus intron has a simpler tertiary architecture with fewer peripheral domains and only two long-range contacts (Fig. 1; Tanner and Cech 1996; Adams et al. 2004a,b; Zhou et al. 2008). Prior work revealed similar binding thermodynamics of the guanosine nucleophile by ribozymes derived from these group I introns, as well as significant differences in the binding of oligonucleotide substrate mimics of their respective 5′-splice sites (Kuo et al. 1999; Kuo and Piccirilli 2001).
SCHEME 1.

Reactions catalyzed by a (A) self-splicing group I intron and (B) group I ribozyme.
FIGURE 1.

Comparison of the ribozymes used in this work. (A) The secondary structure of the Azoarcus group I intron and its self-splicing reaction. The exogenous guanosine nucleophile, ΩG (which specifies the 3′-splice junction), and the guanosine binding site are all shown in purple. The 5′ exon is shown in blue, the 3′ exon is shown in green, and the intron is shown in black. (B) The secondary structure for the ribozymes used in this study. The numbers −1 and +1 define the nucleotides immediately 5′ and 3′ of the cleavage site, respectively. (Left) The L-9A ribozyme. Formation of base pairs with the IGS results in the formation of the P1 duplex. (Center and right) The L-6A ribozyme, containing a three nucleotide 5′ extension (5′GGG3′). The additional sequence present in the L-6A ribozyme extends the IGS and is termed the IGS extension (IGSext) and is shown in red. The IGS and the IGS extension together are referred to as the extended IGS. (Right) Formation of base pairs with the IGS extension results in formation of the P1 extension (P1ext), highlighted in red. Together the P1 and P1 extension (red) are called the extended P1 duplex. (C) The secondary structure for the Tetrahymena L-21T ribozyme (left), L-16T ribozyme (center), and the L-16T ribozyme with an oligonucleotide substrate (S) that forms the base pairs in the P1 extension (right). Definitions as given in B for the Azoarcus ribozymes.
Here we build on the existing knowledge of the Azoarcus ribozyme and establish a quantitative framework for its reaction. This work provides new insights into this reaction and lays the foundation for future in-depth and comparative studies that can help reveal strategies for molecular recognition by RNA, principles of how RNA establishes a functional structure and active site architecture, and a deepened understanding of the energetics of RNA catalysis.
RESULTS AND DISCUSSION
In this work, we develop a kinetic and thermodynamic description for the Azoarcus ribozyme. Specifically, we present three frameworks for two variants of the Azoarcus ribozyme (one with two different substrates), and we compare and contrast these frameworks to the previously established frameworks for analogous variants of the Tetrahymena ribozyme (Karbstein et al. 2002, 2007).
The L-9 Azoarcus (L-9A) ribozyme begins with the guanosine residue that forms the conserved G•U wobble of the 5′ splice site, 10 nucleotides from the 5′ end of the spliced intron (Fig. 1B). This ribozyme catalyzes a transesterification reaction analogous to the first step of self-splicing (Scheme 1). The ribozyme binds an exogenous guanosine (G), which serves as the nucleophile to attach a 5′-splice site analog (CAUPAAAAA) to yield GPAAAAA and a 5′-exon analog (CAU). The L-9A ribozyme lacks a 5′-extension of the IGS, present in the self-splicing intron that has the potential to form a longer helix during the first step of self-splicing, as well as another helix in the second step of self-splicing (Supplemental Fig. 5). To understand the kinetic and thermodynamic contributions from the IGS extension and the helices it forms, we have also employed an IGS-extended ribozyme. This construct, termed the L-6 Azoarcus (L-6A) ribozyme, has a three nucleotide extension (5′GGG3′), referred to as the IGS extension herein (Fig. 1B). Analogously, the L-16 Tetrahymena (L-16T) ribozyme has a five-nucleotide extension (5′GGUUU3′) relative to the L-21 Tetrahymena (L-21T) ribozyme, which begins with the guanosine residue that forms the conserved G•U wobble of the 5′ splice site (Fig. 1C).1
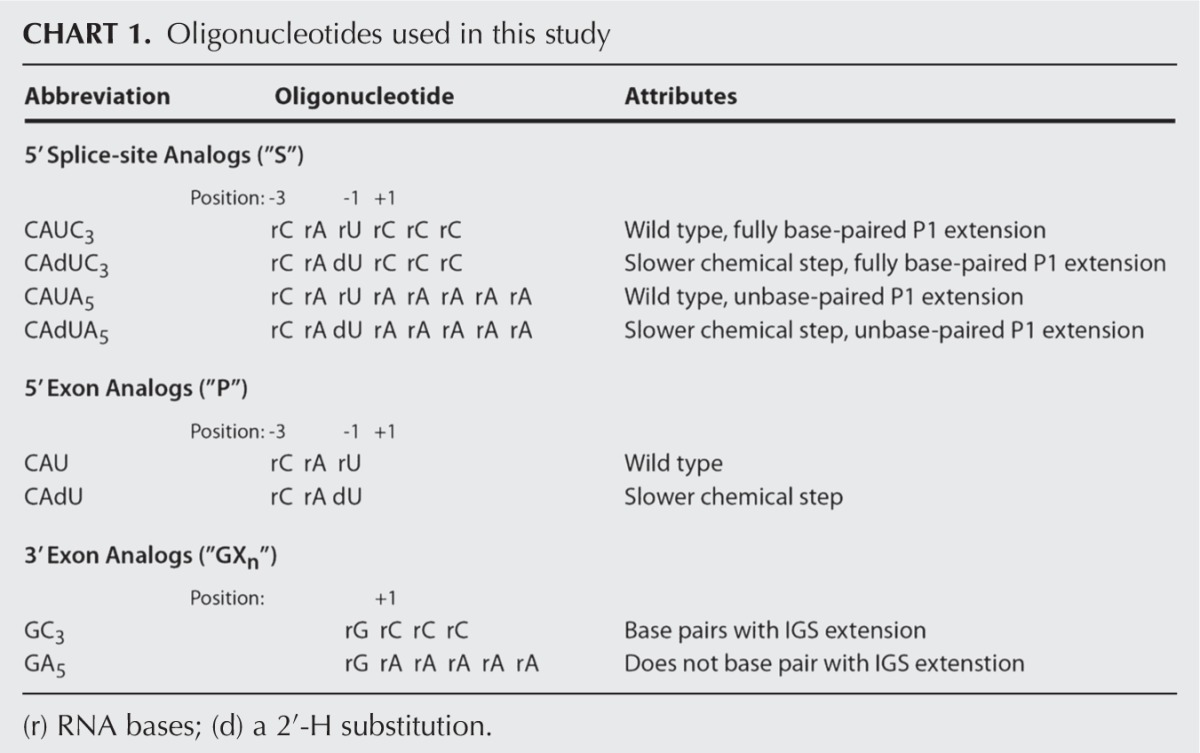
Binding of oligonucleotide substrates (S) or products (P) to the ribozyme leads to the formation of the P1 helix. Bound oligonucleotide substrates or products that base-pair with the extended IGS in the L-16T and L-6A ribozymes result in the formation of the P1 extension, a helix formed with the 5′-most residues of the IGS and 3′ residues of S or P. The P1 and P1 extension together are referred to herein as the extended P1 (Fig. 1B,C). Rate and equilibrium constants for individual steps in the reaction of the L-6A ribozyme were obtained with substrates and products that either can or cannot form the base pairs with the extended IGS (Chart 1), giving two frameworks for this ribozyme. By comparing these frameworks with that of the L-9A ribozyme, we isolate the effects from the IGS extension and formation of the extended P1 on each step of the reaction.
CHART 1.
Oligonucleotides used in this study
The individual rate and equilibrium constants obtained herein for the Azoarcus ribozymes and previously for the Tetrahymena ribozymes (Karbstein et al. 2002, 2007) are summarized in the frameworks of Figures 2 and 3. Below we describe the new frameworks and highlight similarities and differences between the ribozymes from these different sources.
FIGURE 2.

Kinetic and thermodynamic frameworks of the Azoarcus ribozyme at 30°C in 15 mM MgCl2 and pH 6.2. The ribozymes and substrates are defined in Figure 1B,C. Numbers in square brackets describe the rate of the chemical step for oligonucleotide substrates/products with a 2′-H substitution at the −1U position at pH 7.9. Numbers in parentheses are calculated from Kd = koff/kon, and two measured values. (A) Definition of the rate and equilibrium constants used in the text. Association rate constants (k1, k2, k4, k7, and k8) are reported in M−1 min−1; all other rate constants are reported in units of min−1. The internal (Kint) and external (Kext) equilibrium constants are unitless. (B) L-9A ribozyme with CAUA5. (C) L-6A Azoarcus ribozyme with CAUA5. (D) L-6A Azoarcus ribozyme with CAUC3.
FIGURE 3.

Kinetic and thermodynamic frameworks for the Tetrahymena ribozyme at 30°C in 10 mM MgCl2 2 and pH 6.2 (Karbstein et al. 2002, 2007). Numbers in square brackets describe the rate of the chemical step for oligonucleotide substrates/products with a 2′-H substitution at the −1U position at pH 7.9. (A) Definition of the rate and equilibrium constants used in the text. Association rate constants (k1, k2, k4, k7, and k8) are reported in M−1 min−1; all other rate constants are reported in units of min−1. The internal (Kint) and external (Kext) equilibrium constants are unitless. (B) L-21T Tetrahymena ribozyme with CCCUCTA. (C) L-16T Tetrahymena ribozyme with CCCUCTA. (D) L-16T Tetrahymena ribozyme with CCCUCTA3C2. UCG, a G analog that can form the P9.0 duplex with the ribozyme, was used in place of G; aside from tighter binding of UCG relative to G, no quantitative differences on other steps of the framework are observed.
Guanosine binding
Similar binding of G to the Azoarcus and Tetrahymena ribozymes
Equilibrium constants for binding of G to the L-9A and L-6A ribozymes and the L-21T and L-16T with bound S are within fourfold ( 200, 128, and 59 μM for binding to the L-9A, L-6A, L-21T, and L-16T ribozymes, respectively) (Table 1; Figs. 2, 3; Supplemental Fig. 1). The rate constants for association of G are likewise similar for the L-9A and L-21T ribozymes (
 and 3 × 10⁵ M−1 min−1, respectively) (Fig. 4A). These observed guanosine association rate constants are ∼105-fold slower than diffusion and 103- to 104-fold slower than typically observed for association of small molecule ligands with proteins (Fersht 1999). Prior work on the L-21T ribozyme provided evidence that the slow guanosine association rate results from limited preorganization of the guanosine binding site (Karbstein and Herschlag 2003), a feature that appears to be shared in the Azoarcus ribozyme.
TABLE 1.
Binding of G and UCG to the Tetrahymena and Azoarcus ribozymes
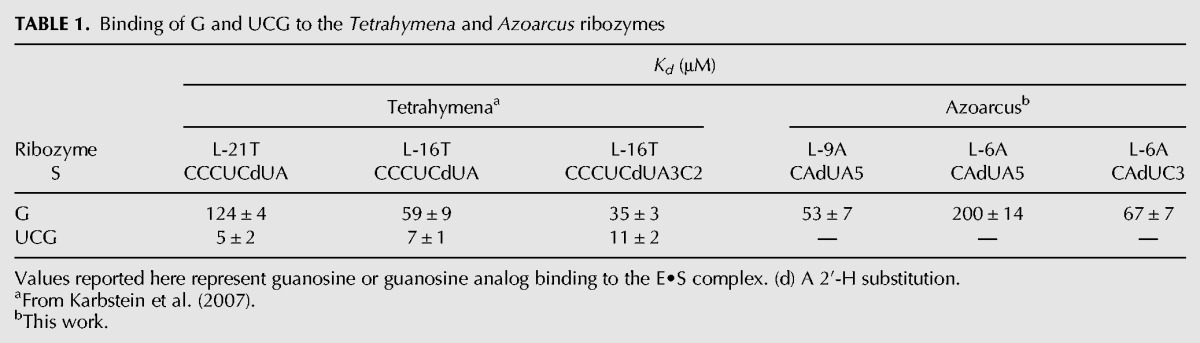
FIGURE 4.

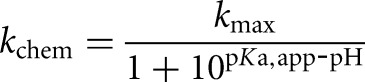
Guanosine binding to the L-9A and L-6A ribozymes. (A) pH dependence of (kc/KM)G for the L-10A ribozyme (open symbols) and the L-6A ribozyme (closed symbols). (kc/KM)G describes the reaction of E•CAUA5 + G → products. Data were fit to Equation 4 to obtain the maximal values for (kc/KM)G of 1.5 ± 0.1 × 10⁵ M−1 min−1 and 0.27 ± 0.04 × 10⁵ M−1 min−1 and apparent pKa values of 7.5 ± 0.1 and 7.6 ± 0.2 for the L-9A and L-6A ribozymes, respectively. The reaction requires the loss of a proton from the 3′-OH group, so the chemical step has a log-linear pH dependence until the pH exceeds the pKa of this group. The observation that the reaction with a substrate with a slower chemical step increases log-linearly throughout this pH range (Fig. 7, below) suggests that the pKa observed here reflects a change in rate-limiting step (Herschlag and Khosla 1994; Karbstein and Herschlag 2003). Conditions: [E] = 500 nM, [G] = 0–15 μM, trace *S (CAUA5). (B) Equilibrium dissociation constants for G binding to the three ribozyme variants used in this study with (gray bars) and without (white bars) bound S.
These results suggest an overall conservation in guanosine binding to these ribozymes, as does the <1 Å RMSD between X-ray structural model of the G-occupied guanosine binding sites of the Azoarcus and Tetrahymena ribozymes (Adams et al. 2004a,b; Vicens and Cech 2006). Nevertheless, additional results reveal some species-specific differences.
Guanosine binding has also been measured for the Anabaena and Twort ribozymes under similar conditions. The Anabaena group I ribozyme binds G with an apparent dissociation constant of ∼1 mM (15 mM Mg2+, pH 7.5, 30°C) (Kuo and Cech 1996), ∼20-fold weaker than the L-9A ribozyme, whereas the binding of G to the Twort group I ribozyme is ∼10-fold tighter than to the L-9A ribozyme ( 10 mM Mg2+, 25 mM Tris-Cl, pH 6.5, 37°C) (Kim 2008). Under the conditions of these experiments the measured values are expected to represent true dissociation constants (see Herschlag and Khosla 1994; Karbstein et al. 2002 for discussion), so it appears that guanosine affinity ranges at least 100-fold in different group I ribozymes.
Despite the >10-fold tighter G binding in the Twort ribozyme relative to the Azoarcus and Tetrahymena ribozymes, the G binding site in the crystal structure of the Twort ribozyme overlays well with the G binding sites of the Tetrahymena and Azoarcus ribozymes, with an RMSD of <1 Å (Adams et al. 2004a,b; Golden et al. 2005; Vicens and Cech 2006). The differences in G affinities may thus arise from differences in the unbound G binding sites in these ribozymes, for which no atomic-level structural information is available, and/or from differences not resolved in these structural models. As noted above, the very slow association of G, and additional results, led to a model in which substantial local rearrangement is required for the G binding site to be aligned to allow productive binding (Karbstein and Herschlag 2003). Thus, if the Twort site were more preorganized—or more likely to transiently adopt the productive conformation—its G association rate constant and affinity for G would increase, and the converse could hold for the weaker-binding Anabaena ribozyme. Consistent with this model, the guanosine association rate constant for the Twort ribozyme was reported to be 6.2 × 10⁶ M−1 min−1 (Kim 2008), ∼10-fold faster than that of the Azoarcus and Tetrahymena ribozymes. Also consistent with this model, slowed G association is responsible for the observed weaker G binding to a L-21T variant with a mutation in a remote tertiary interaction (Benz-Moy and Herschlag 2011). Together these observations suggest that local structural context in group I ribozymes can influence G binding by affecting the ability of the guanosine binding site to adopt a binding-competent conformation. Further comparative functional studies, combined with mutational, biophysical, and structural analysis, may help reveal the underlying dynamic behaviors that lead to these differences and the structural features that help establish an effective G binding site.
The effect of the IGS extension on G binding in the Azoarcus and Tetrahymena ribozymes
The L-6A ribozyme, when bound to an oligonucleotide substrate that cannot form the P1 extension, binds G three- to fourfold weaker than the L-9A ribozyme ( and 53 μM, respectively). When a substrate that allows the formation of the P1 extension is used, the guanosine affinity for the L-6A ribozyme is the same within error as that of the L-9A ribozyme (
 and 67 μM for binding to the L-9A and L-6A ribozymes, respectively) (Fig. 4B). These data suggest that the unpaired nucleotides in the IGS extension block the G binding site, either directly or indirectly. Consistent with a blocking model, G association is fivefold slower for the L-6A ribozyme in the absence of the base-pairing that forms the P1 extension, relative to the L-9A ribozyme (KonG = 2.7 × 10⁴ and 1.5 × 10⁵ M−1 min−1 for binding to the L-6A and L-9A ribozymes, respectively) (Fig. 4B).
In contrast, the IGS extension has no effect on G binding to either the free or S-bound Tetrahymena ribozyme, a difference that may arise from differences in these ribozymes’ overall architectures. In the Tetrahymena ribozyme, the IGS is connected to the core through a single stranded junction. In the absence of S, the 5′-end of the Tetrahymena IGS cross-links well outside the catalytic core (Wang et al. 1993; Narlikar and Herschlag 1996), suggesting that the IGS preferentially samples conformations outside the active site when S is not bound. The Azoarcus ribozyme lacks this single-stranded junction and the P1 helix is directly connected to the P2 helix, which is directed toward the catalytic core. When S is absent from the active site this arrangement potentially leads to a more conformationally restricted IGS that is poised to block the G binding site via fortuitous interactions.
A deleterious impact on G binding to the Tetrahymena ribozyme is observed for a “dangling” 3′ U residue of S when the P1 helix is docked in active site (Liao et al. 2001; Karbstein et al. 2007), and this effect may be analogous to the observed inhibitory effect of the unpaired IGS extension or resulting unpaired 3′-tail of CAUA5 on the S-bound L-6A Azoarcus ribozyme. Fortuitous interactions may be common when residues are positioned within RNA “pockets,” especially given the relatively simple hydrogen bonding and stacking recognition patterns in RNA (e.g., Peracchi et al. 1996; Karbstein et al. 2007).
Oligonucleotide substrate and product binding
Strong tertiary stabilization for S and P binding to the Azoarcus ribozyme
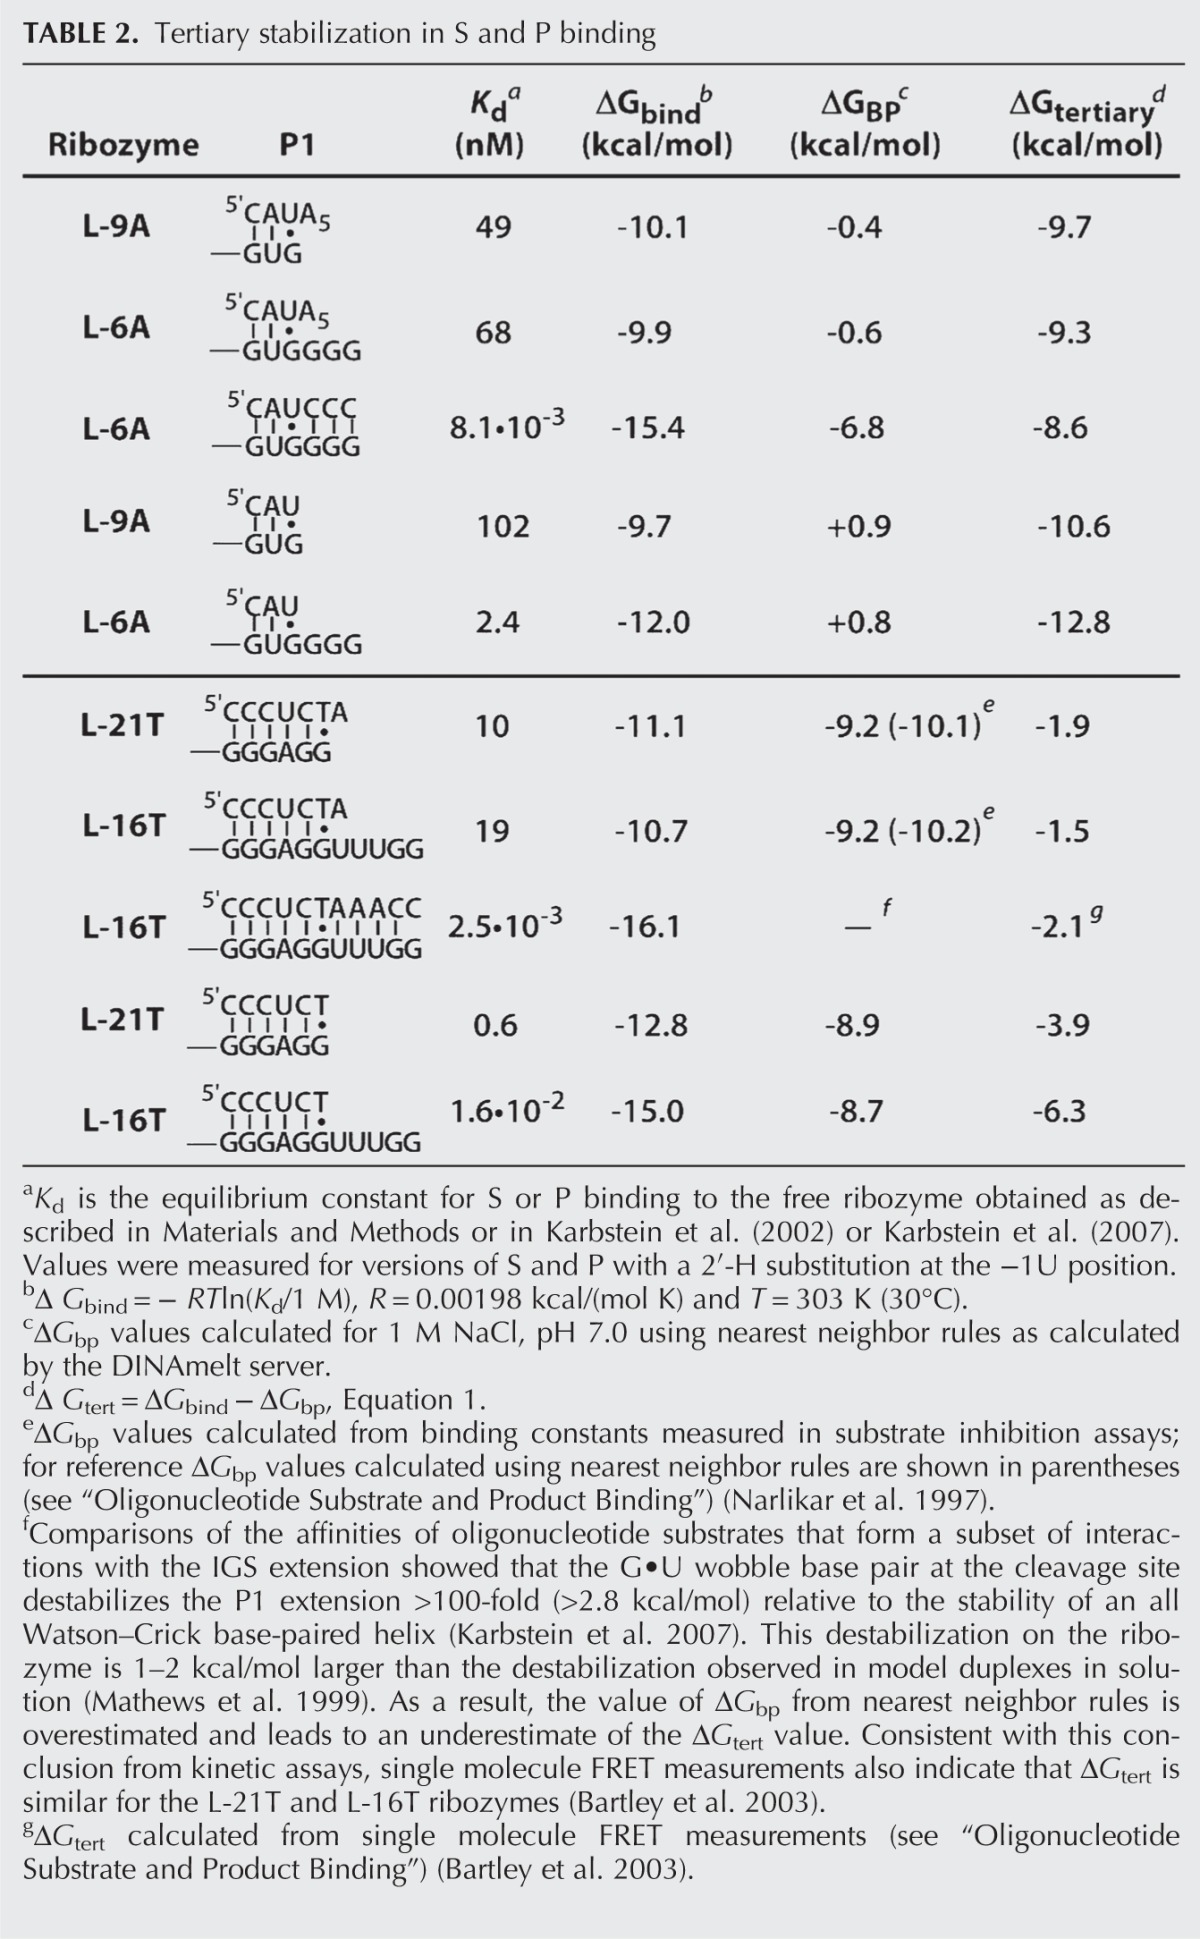
The binding of S and P to group I ribozymes involves both base-pairing and specific tertiary interactions made with the ribozyme core. Thus, the observed binding energy, ΔGbind, can be considered as the sum of the stabilization arising from base-pairing (ΔGbp) and tertiary (ΔGtert) interactions (Equation 1).
| (1) |
The energetic contribution to binding expected from base-pairing can be approximated using nearest neighbor rules (Xia et al. 1998; Mathews et al. 1999) This value, ΔGbp, when combined with the observed binding energy, ΔGbind, obtained from the measured dissociation constant for binding, can give the tertiary stabilization in S and P binding, ΔGtert, according to Equation 1.
For ribozymes derived from the Tetrahymena group I intron, the L-21T and L-16T ribozymes, tertiary stabilization ranges from −1.5 to −6.3 kcal/mol for S and P binding (Table 2), indicating that the overall binding affinity for S and P is up to 104-fold stronger than expected for base-pairing alone. For the Azoarcus ribozymes, this calculated tertiary stabilization is far greater, and binding of their oligonucleotide substrates and products (S and P) is 106–109-fold stronger than expected for simple base-pairing in solution, giving ΔGtert values of −9 to −13 kcal/mol (Table 2; Supplemental Figs. 2, 3; Kuo et al. 1999). Multiple models could account for the stronger tertiary stabilization in the Azoarcus ribozyme, including more or stronger individual tertiary interactions with the core than in the Tetrahymena ribozyme, stacking interactions between the P1 and P2 helices, and/or preformed IGS-catalytic core interactions that preposition the Azoarcus ribozyme IGS for S (or P) binding. The frameworks developed herein will help guide tests of these models.
TABLE 2.
Tertiary stabilization in S and P binding
(kc/KM)S and (kc/KM)P are smaller for the Azoarcus ribozyme than the Tetrahymena ribozyme
The second-order rate constant for the reaction E•G + S → products, (kc/KM)S for the L-21T and L-16T ribozymes is ∼108 M−1 min−1 and reflects the process of P1 duplex formation between the IGS and S, i.e., konG (Herschlag and Cech 1990a,b; Herschlag et al. 1991; Bevilacqua et al. 1992; Narlikar et al. 1999).3 Similar (kc/KM)P values, representing konP, are observed for the reverse reaction (Karbstein and Herschlag 2003).
The second-order rate constants (kc/KM)S and (kc/KM)P for the Azoarcus ribozymes are 10- to 100-fold smaller than for the Tetrahymena ribozyme (Figs. 2, 3). These values could be smaller because P1 duplex formation is slower for the Azoarcus P1 duplex than for the Tetrahymena P1 duplex or because a subsequent slower step, either P1 tertiary contact formation or the chemical step, limits the rate for the Azoarcus ribozyme.
To test whether the subsequent chemical step is rate-limiting for reaction of S or P with the L-9A and L-6A ribozymes, we measured the pH dependence of (kc/KM)S and (kc/KM)P. Previous work has shown that the chemical step of the group I ribozyme reaction has a log-linear pH dependence with a slope of one from pH 5 to 9 (Herschlag and Khosla 1994). In contrast, both duplex and tertiary contact formation with the Tetrahymena ribozyme are pH-independent in this range (Narlikar et al. 1999).
The values of (kc/KM)S and (kc/KM)P for the Azoarcus ribozymes are independent of pH in the range of pH 6.5–8, consistent with a nonchemical rate-limiting step (Fig. 5). This step could be slower P1 duplex formation than measured for the Tetrahymena ribozyme, the formation of tertiary contacts with the core of the ribozyme, or an additional unidentified reaction step. With the L-6A ribozyme, the version of S that can base-pair to form the 3′ extension of P1 binds ∼10-fold faster than the version of S that cannot form these base pairs (i.e., CCC versus AAAAA) (Figs. 2, 3). Thus, an additional, lower energy pathway is available when the P1-extension base pairs can form, suggesting that these base pairs are formed prior to those in the rest of P1, and that the formation of the short P1 duplex in Azoarcus is particularly slow.
FIGURE 5.

pH dependences to establish conditions with rate-limiting binding of S and P. (A) pH dependence of (kc/KM)S for the L-9A ribozyme (circles) and the L-6A ribozyme (S = CAUA5, diamonds; S = CAUC3, squares). Data were fit to Equation 4 to obtain the maximal values for (kc/KM)S of 0.46 ± 0.05 × 10⁷ M−1 min−1, 0.22 ± 0.02 × 10⁷ M−1 min−1, and 3.7 ± 0.3 × 10⁷ M−1 min−1 and apparent pKa values of 6.3 ± 0.4, 6.7 ± 0.2 and 6.3 ± 0.2 for the L-9A with CAUA5, L-6A with CAUA5 and L-6A with CAUC3, respectively. The reaction requires the loss of a proton from the 3′-OH group, so the chemical step has a log-linear pH dependence until the pH exceeds the pKa of this group. The observation that the reaction with a substrate with a slower chemical step increases log-linearly throughout this pH range (Fig. 7, below) suggests that the pKa observed here reflects a change in rate-limiting step (Herschlag and Khosla 1994; Karbstein and Herschlag 2003). Conditions: [E] = 0–50 nM, [G] = 2.1 mM, trace *S (CAUA5 or CAUC3). (B) pH dependence of (kc/KM)P for the L-9A ribozyme (circles) and the L-6A ribozyme (squares). Data were fit to Equation 4 to obtain the maximal values for (kc/KM)P of 0.6 ± 0.06 × 10⁷ M−1 min−1 and 1.8 ± 0.3 × 10⁷ M−1 min−1 and apparent pKa values of 6.3 ± 0.2 and 5.7 ± 0.5 for the L-9A and L-6A ribozymes, respectively. Conditions: [E] = 500 nM, [GA5] = 1 mM, or [GC3] = 1 μM, trace *P (CAU).
Effects of the IGS extension on S and P binding affinity
Prior work on the L-21T ribozyme showed that S binds 20-fold weaker than P (Karbstein et al. 2002, 2007). In addition, the IGS extension in the L-16T ribozyme does not significantly change the affinity of S, but strengthens P binding by 40-fold, leading to an overall ∼1000-fold stronger affinity for P than S, despite the presence of the same base-pairing interactions (Fig. 3; Karbstein et al. 2007). In contrast to the L-21T ribozyme, S and P bind to the L-9A ribozyme with similar affinities (KdS = 49 nM, KdP = 102 nM for binding to the free L-9A ribozyme) (Fig. 2B). However, as was observed in the Tetrahymena ribozyme, the IGS extension in the L-6A ribozyme strengthens P binding by 40-fold without significantly changing the affinity of S (KdS = 68 nM versus KdP = 2.4 nM for binding to the free L-6A ribozyme) (Fig. 2C).
Interactions with the active site metal ion that coordinates the 3′-OH group of P were suggested to be responsible for the stronger P than S binding in the Tetrahymena ribozyme (Narlikar et al. 1995; Karbstein et al. 2002; Sengupta et al. 2012). Crystal structures of the Azoarcus intron are consistent with this model (Lipchock and Strobel 2008). Crystallization of the intron with bound active substrates yields a mixture of RNAs in the post-ligated (30%; analogous to substrates in Fig. 1B) and preligated (70%; analogous to products in Fig. 1B) forms that are accompanied by changes in ground-state metal ion coordination.4 Specifically, the distance between an active site metal ion, M1, and the 3′-oxygen of the −1U residue demarcating the cleavage site is longer (4.6 Å) in the post-ligated state with bound S than in the preligated state (2.2 Å) with bound P, suggesting that active site metal interactions may be optimized in the P-bound state (Lipchock and Strobel 2008). Intriguingly, stronger P binding in the Azoarcus ribozyme is only observed in the presence of the IGS extension, indicating that additional factors and interactions that influence the relative binding of S and P that remain to be uncovered.
Cooperativity in substrate and product binding
For the Tetrahymena ribozymes, substrates and products bind cooperatively, with the binding of a substrate or product enhanced when the other substrate or product is bound, relative to binding to the free ribozyme (Karbstein et al. 2002, 2007). For both substrates and products, the magnitude of this enhancement, or coupling, is approximately fivefold (Figs. 3, 6A).
FIGURE 6.

Coupling in substrate and product binding in the (A) Tetrahymena and (B) Azoarcus ribozymes. Coupling is defined as  , where KdX describes binding to the free ribozyme, while
  refers to the binding in the presence of saturating concentrations of the other substrate/product. The black dashed line represents no coupling. The arrows signify values that are lower limits.
For the Azoarcus L-9A ribozyme, however, substrate binding is not cooperative (KdG = 68 μM versus  , KdS = 49 nM versus
  ) (Figs. 2B, 6B). Binding of CAUA5 and G to the L-6A ribozyme is likewise not cooperative (KdG = 270 μM versus
  , KdS = 68 nM versus
  ) (Fig. 2C). There is coupling between CAUC3 and G binding For the Azoarcus L-6A ribozyme (KdG = 270 μM versus
  67μM, KdS = 8.1 pM versus
  0.86 pM), but the results described above suggest that this observed cooperativity likely arises from an inhibitory effect of the IGS extension that is relieved upon formation of the base-paired P1 extension rather than favorable interactions that are induced by the binding of one substrate (Fig. 4).
Prior results with the Tetrahymena ribozyme have provided strong evidence that the 2′-OH group of G does not make its interaction with an active site metal ion in the E•G complex but does so once S is bound and P1 is docked into the active site (Shan and Herschlag 1999). Presumably it is these interactions of the G 2′-hydroxyl group, aided by bound and docked S, that are responsible for the cooperative binding of substrates (Hougland et al. 2006). The absence of cooperative substrate binding for the Azoarcus ribozyme suggests that the interactions with G are the same with and without bound S, and future studies will reveal whether the 2′-hydroxyl interaction is formed already in the E•G state, suggestive of a more preorganized active site, whether these interactions form after the E•G•S complex is formed (and prior to the chemical step), or whether a more complex model holds.
For products, CAU and GA5, binding to the L-9A ribozyme is cooperative ( versus
  , KdP = 19 nM versus
  ) (Fig. 2B), with sixfold coupling, the same within error as measured for the Tetrahymena ribozyme. In contrast, binding of CAU and GC3, which forms the extended P1 base pairs (Fig. 1B), is not cooperative in the L-6A ribozyme (
 versus
  , KdP = 2.4 nM versus
  ) (Fig. 2D). Coupling for binding to the L-6A ribozyme in the absence of extended P1 helix formation (e.g., with GA5) could not be measured because the affinity of GA5 is too weak to achieve saturation (Fig. 2C).
For the L-21T Tetrahymena ribozyme, it was observed that UCGA affinity was weakened by ∼15-fold relative to the UCG affinity ( versus KdUCGA = 88 μM) (Fig. 3B) and that the binding of P relative to S was stabilized to roughly the same extent (
 versus KdP = 0.2 nM) (Fig. 3B). In contrast, destabilization of GA5 relative to G was not observed in the L-9A Azoarcus ribozyme (
 versus
  ) (Fig. 2B). Similarly, the affinities of S and P for the L-9A ribozyme are within twofold (
 versus KdP = 19 nM) (Fig. 2B).
The coupling results for the reverse reactions highlight differences in the organization and rearrangements between the Azoarcus and Tetrahymena ribozyme through the progression of the reaction cycle but do not suggest the origin of these differences. Tests of how the distinct tertiary architectures of these two ribozymes influence formation of active site interactions along the reaction cycle and how such differences are manifest in the energetics of binding and catalysis will provide a window into how an RNA's tertiary structure affects local conformational preferences and influence conformational changes.
The chemical step
The rate constants for the forward and reverse reactions were determined under conditions in which both substrates or products are saturating and under which the chemical step is rate-limiting (k5 and k−5, respectively). Reaction rate constants were found to increase log-linearly as a function of pH, consistent with the expected pH-dependence of a chemical step that is preceded by deprotonation of the 3′-OH group of the nucleophile to allow attack by the more nucleophilic 3′-oxyanion at the scissile phosphoryl group (Fig. 7A,C; Cech et al. 1992; Herschlag and Khosla 1994; Herschlag and Cech 1996; Hougland et al. 2006).
FIGURE 7.

(A) The pH dependence of the rate of the forward (open symbols) and reverse (closed symbols) reactions from the ternary complex, E•S•G and E•P•GA5, respectively, for the L-9A ribozyme (circles). Conditions: [E] = 1 μM, trace S = *CAdUA5 or trace P = *CAdU, [G] = 2.1 mM or [GA5] = 1 mM. (B) The pH dependence of the internal equilibrium constant (Kint) for the L-9A ribozyme (Kint = 1.9 ± 0.8). A dashed line is drawn at the value of the external equilibrium constant (Kext = 2.8 ± 1). (C) The pH dependence of the rate of the forward (open symbols) and reverse (closed symbols) reactions from the ternary complex, E•S•G and E•P•GC3, respectively, for the L-6A ribozyme with extended P1 (squares). Conditions: [E] = 100 nM, trace S = *CAdUC3 or trace P = *CAdU, [G] = 2.1 mM or [GC3] = 0.5 μM. (D) The pH dependence of the internal equilibrium constant (Kint) for the L-6A ribozyme (Kint = 2.3 ± 0.5). A dashed line is drawn at the value of the external equilibrium constant (Kext = 2.8 ± 1).
Substitution of a deoxyribose sugar at the cleavage site (−1U) reduces the Tetrahymena ribozyme cleavage rate by ∼1000-fold. Prior work has attributed this effect to the ability of the 2′-OH, relative to a 2′-H, to stabilize charge development on the neighboring 3′-oxygen atom in the reaction's transition state via an inductive effect (i.e., electron-withdrawing effect) and via hydrogen bond donation to the adjacent incipient 3′-oxyanion (Herschlag et al. 1993; Shan and Herschlag 1999). A similarly large reduction in the cleavage rate is observed for an oligonucleotide substrate (S) containing a 2′-H substitution at position −1U for the Azoarcus ribozyme, consistent with identical local interactions in the two active sites (Chart 1; k5 = 0.34 min−1 and 2.7 × 10⁻⁴ min−1 and k−5 = 0.42 and 1.0 × 10⁻⁴ min−1 for a ribose and deoxyribose at the cleavage site, respectively, L-9A ribozyme at pH 6.0; data not shown).
The rate constant for the forward chemical step for the L-9A ribozyme is ∼10-fold lower than that for the L-21T ribozyme (k5 = 0.54 and 4.1 min−1 for the L-10A and L-21T ribozyme, respectively, pH 6.2) (Figs. 2, 3). This difference is likewise observed with −1U 2′-H containing oligonucleotide substrates (k5 = 0.021 and 0.20 min−1 for the L-9A and L-21T ribozyme, respectively, pH 7.9) (Figs. 2, 3).
To test whether the difference in the rate constants for the forward chemical step reflects differences in the temperatures of peak activity observed for the Azoarcus and Tetrahymena group I introns (Tanner and Cech 1996; Burton and Lehman 2006), the temperature dependence of the forward chemical step was measured side-by-side for the L-10A and L-21T ribozymes from 30 to 60°C. Consistent with previous results (McConnell and Cech 1995), the forward chemical step for the L-21T ribozyme increased ∼20-fold from 30 to 60°C (Fig. 8, Supplemental Fig. 4). The L-9A forward chemical step also increased ∼20-fold from 30 to 60°C (Fig. 8, Supplemental Fig. 4), remaining ∼10-fold slower than the L-21T reaction throughout the measured temperature range (Fig. 8). That the observed constant difference over this temperature range provides evidence for an active site interaction or property that differentially stabilizes the chemical transition states for these two ribozymes, and suggests that previously observed differences in the temperature dependence of peak self-splicing activity (Tanner and Cech 1996; Burton and Lehman 2006) reflect a step other than the chemical transformation.
FIGURE 8.
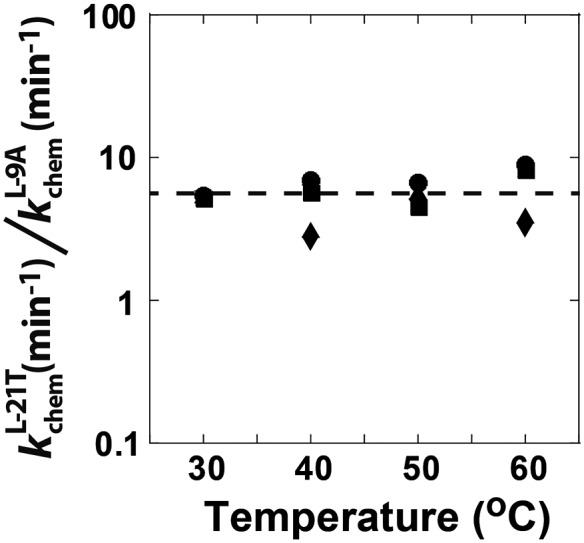
The ratio of the forward chemical step for the L-21T (Tetrahymena) and the L-9A (Azoarcus) ribozyme reactions with oligonucleotide substrates containing a 2′-H substitution at position −1U at pH 7.3 (circles), 7.9 (squares), and 8.5 (diamonds). The dashed line shows the average ratio for all of the data of 5.8 ± 1.7. Rate constants for the L-21T chemical step agree within twofold with previously published data from McConnell and Cech (1995) (10 mM MgCl2 and pH 7.0).
As was observed for the Tetrahymena ribozymes, extending the IGS in the Azoarcus ribozyme does not affect the rate constant of the chemical step (k5 = 0.021 and 0.019 min−1 for the L-9A and L-6A ribozymes with CAdUA5, respectively, pH 7.9) (Figs. 2, 3). Likewise, the rate constants for the chemical step of the L-6A ribozyme is the same within twofold with and without the base-pairing that forms P1 extension (k5 = 0.019 and 0.013 min−1 for S = CAdUA5 and CAdUC3, respectively, pH 7.9). Thus, the chemical transformation does not appear to be sensitive to the presence of the single-stranded IGS extension or the base-paired P1 extension.
The external and internal equilibrium constants
The external equilibrium constant, Kext, which describes the equilibrium between E + S + G and E + P + GXn in solution, is 2.8 ± 1 (Fig. 2A). This value is within error of the value of 1.9 determined with the L-21 Tetrahymena ribozyme for the equilibrium between E + S + UCG* and E + P + UCGA in solution (with a different S sequence) (Fig. 3A; Karbstein et al. 2002, 2007), and close to unity, as expected for this symmetrical reaction with one phosphate diester replacing another.
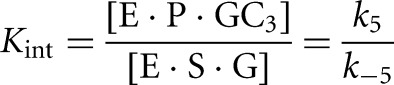
The internal equilibrium constant describes the equilibrium between E•S•G and E•P•GXn and was measured as the quotient of the forward and reverse reaction rate constants (Fig. 2). The forward and reverse reaction rate constants were determined under conditions in which both substrates (or both products) are saturating and the chemical step is rate limiting, as suggested by a log-linear dependence of the observed reaction rate constant on pH. For the L-9A Azoarcus ribozyme Kint is 0.83 ± 0.03 (Fig. 2B). A similar value of Kint = 1.9 ± 0.8 is measured for S and P containing a 2′-H substitution at the −1U position (Figs. 2B, 7). The internal equilibrium is not affected by the formation of the P1 extension (Kint = 1.7 ± 0.3, 2.3 ± 0.5 for L-6A with S = CAUC3 and CAdUC3, respectively) (Fig. 2D). These values are similar to those for the L-21T ribozyme (Kint = 4.6 and 0.7 for substrates with a ribose and a deoxyribose at the cleavage site, respectively) (Fig. 3B) and the L-16T ribozyme (Kint = 1.0 with a deoxyribose at the cleavage site) (Fig. 3D; Karbstein et al. 2002, 2007).
These results reveal that ribozymes from neither source strongly perturb the reaction equilibrium constant relative to solution. Thus, there is a shared symmetry in reaction energetics, with neither ribozyme providing substantial stabilization of substrates or products, despite the substantial difference in tertiary stabilization of S and P and differences in coupling in binding between these ribozymes.
CONCLUSIONS AND IMPLICATIONS
The kinetic and thermodynamic framework for the Azoarcus ribozyme provides a foundation for future studies aimed at deepening our understanding of RNA catalysis, RNA folding, and the architectural principles for building active sites from RNA. Just as early quantitative studies of the Tetrahymena ribozyme helped uncover its catalytic properties (e.g., Narlikar et al. 1995, 1997; Karbstein and Herschlag 2003; Hougland et al. 2006; Benz-Moy and Herschlag 2011) and allowed interpretation of other functional studies and development of a folding framework for this ribozyme (e.g., Russell and Herschlag 1999, 2001; Russell et al. 2000, 2002), our framework for the Azoarcus ribozyme should be similarly empowering. For example, interpretation of reaction burst kinetics used in folding studies (Sinan et al. 2011; Behrouzi et al. 2012) requires knowledge of the internal equilibrium and of whether substrates are saturating across the range of conditions investigated (described in Wan et al. 2009; Sinan et al. 2011).
The general conservation of the catalytic cores of group I introns has been emphasized and contrasted with the very different peripheral architectures present in different group I intron subclasses (Burke 1988; Cech 1988, 1990; Zhou et al. 2008), and there has been some exploration of the influence of tertiary architecture on the conserved functions of the catalytic core (e.g., Ikawa et al. 2000a,b, 2003; Dolan and Muller 2014). Strong interpretation of such results requires certainty about the processes and reaction steps being compared. The kinetic and thermodynamic reaction frameworks for the Azoarcus and Tetrahymena ribozymes reveal similarities and differences between the two that lead to testable models addressing organizational principles in structured RNAs, and these frameworks will be instrumental in such tests.
Despite forming only three base pairs with the ribozyme's internal guide sequence (IGS) (Fig. 1), oligonucleotide analogs of the 5′-splice site and 5′-exon (S and P) (Fig. 1) bind to the Azoarcus ribozyme with nanomolar affinity. This affinity is similar to that of oligonucleotides making six base pairs with the corresponding IGS of the Tetrahymena ribozyme and corresponds to 106- to 109-fold stronger tertiary stabilization in the Azoarcus than the Tetrahymena ribozyme (Table 2). This strong tertiary stabilization presumably arose due to the biological requirement for the three-nucleotide 5′-product of the first step of self-splicing (i.e., the 5′-exon) to remain bound to the Azoarcus group I intron during the conformational rearrangements required before completion of the self-splicing reaction (Herschlag and Cech 1990a,b; Tanner et al. 1997; Karbstein et al. 2004). Exploration of the source of this substantial tertiary stabilization, facilitated by these frameworks, will provide insight into how RNA can achieve strong molecular recognition.
Structures of the G-occupied guanosine binding sites of the Azoarcus, Tetrahymena, and Twort introns overlay with an RMSD of <1 Å, suggesting an overall conservation in the guanosine binding sites of these ribozymes (Adams et al. 2004a,b; Golden et al. 2005; Vicens and Cech 2006). However, the 100-fold span in guanosine affinity for the Azoarcus, Tetrahymena, Anabaena, and Twort ribozymes (Kuo and Cech 1996; Karbstein et al. 2007; Kim 2008), the correspondence of association rate constants with these differences, and the effects of mutations on the association rate constants (Benz-Moy and Herschlag 2011, vide supra) suggest differences in the extent of preorganization in the unbound G binding sites in these ribozymes. These differences presumably arise from the varied tertiary structural contexts among these ribozymes, either immediately surrounding the G site or in more distal peripheral regions. Future studies probing the influence of peripheral domains on G association will lead to insight into the interplay between the establishment of local binding interactions and their global context in RNA.
Prior work on the L-21T ribozyme provided evidence that slow guanosine association results from limited preorganization of the guanosine binding site, and it was recognized that slow binding can play a pivotal role in biological specificity (Karbstein and Herschlag 2003). The observation that G binding in the Azoarcus ribozyme is similarly slow suggests that this reaction property is conserved and underscores its potential biological significance. In self-splicing, the internal guanosine, ΩG, which designates the 3′-splice site in the second self-splicing step, must be selected from a sea of incorrect guanosine residues throughout the 3′-exon (see Supplemental Fig. 5 for a description of the self-splicing reaction; Karbstein and Herschlag 2003). This challenge is further complicated because the subsequent chemical step is faster than guanosine dissociation for both the Azoarcus and Tetrahymena introns. Thus, discrimination cannot arise simply from making stronger interactions with a particular guanosine residue to decrease its dissociation rate constant, as any G residue that makes it into the binding site will go on to react nearly all of the time. In contrast, the intrinsically slow binding of an isolated guanosine nucleotide allows acceleration of binding in a way that can aid in “choosing” the right guanosine residue. For ΩG, there are neighboring residues that can form additional base pairs to hold ΩG near the guanosine binding site, and thereby favor its entry into that site, relative to other guanosine residues. Thus, choice of the correct splice site can be favored due to faster association, relative to the myriad of potential incorrect splice sites.
We have referred to this situation as “kon specificity,” and kon specificity may be widespread in biology (Karbstein and Herschlag 2003). For example, in cotranslational targeting of proteins to membranes by the signal recognition particle (SRP), the SRP RNA provides a transient tether that greatly increases the association rate constant for complex formation between the SRP and the SRP receptor, but only if a signal peptide is bound, thereby helping target SRP that contains a bound signal peptide to its receptor (Jaru-Ampornpan et al. 2007; Shen and Shan 2010). These and additional observations and examples emphasize how deep investigation of model systems is indispensible for revealing and understanding fundamental biological principles.
MATERIALS AND METHODS
Materials
L-9A ribozyme was transcribed from a plasmid that includes a promoter for the T7 RNA polymerase immediately upstream of the coding sequence (beginning with G10 of the intron) and an XbaI restriction site adjacent to the 3′ terminus (ending with C203 of the intron). The L-6A construct, compared with the L-9A construct, has a three-nucleotide extension in the internal guide sequence (IGS) and the 5′ end (5′GGG3′) (see Fig. 1 for comparison of the two constructs). The DNA template for the L-6A ribozyme was constructed by PCR amplification from the WT plasmid using a forward primer that contained a T7 promoter sequence and the three guanosines of the extension followed by the first 20 nucleotides of the WT L-9A sequence. Forward and reverse sequencing confirmed the fidelity of the DNA constructs. Ribozymes were purified on 7 M urea/8% (w/v) polyacrylamide gels.
RNA and DNA oligonucleotides were purchased from Integrated DNA Technologies (IDT), Dharmacon, or the Protein and Nucleic Acids facility at Stanford. RNA and DNA oligonucleotides were 5′-end labeled with [γ-32P]ATP and gel purified using standard procedures.
General kinetic methods
All cleavage reactions were single turnover with ribozyme in excess of 5′-32P-labeled S or P and were carried out at 30°C in 50 mM Na-MES, pH 7.3, and 15 mM MgCl2, unless otherwise noted. Ribozymes were preincubated in 15 mM MgCl2 and 50 mM Na-MES (pH 6.0) for 15–30 min at 50°C to allow folding to the active state (Sinan et al. 2011). The mixtures were allowed to equilibrate at room temperature for 10 min, and then the ribozyme was aliquoted into different tubes to establish the reaction pH, dilute the ribozyme concentration, and add additional reactants. Reactions were allowed to equilibrate at 30°C (or desired reaction temperature) for 5 min before the addition of radiolabeled substrate or product. Reaction aliquots were removed at specific times to be quenched with 2 volumes of a solution containing 50 mM EDTA and 85% formamide. Radiolabeled oligonucleotides were separated by denaturing gel electrophoresis (7 M urea/20% acrylamide) and quantitated using Phosphorimager analysis (GE Healthcare) with TotalLab. For slow reactions, rate constants were obtained from initial rates assuming endpoints of 95%. All other reactions were followed to completion and exhibited endpoints of >90%.
Reported errors were estimated as standard errors of the mean from individual experiments. Independent experiments gave more variation, as is typical, with rate and equilibrium constants typically agreeing within 20%.
A visual overview of the kinetic measurements listed in the below sections is shown in Supplemental Figure 9.
Measurement of the S and P affinities
Equilibrium dissociation constants for CAdUA5 and CAdU to the L-9A and L-6A ribozymes with or without G or GXn bound were determined by measuring the rate of reaction with varying concentrations of E (L-9A conditions: trace *S = *CAdUA5, 0–1 μM E, 10 μM or 2.1 mM G  ; or trace *P = *CAdU, 10 μM or 1 mM GA5,
  ; L-6A conditions: trace *S = *CAdUA5, 0–1 μM E, 10 μM or 2.1 mM G,
  ; or trace P = *CAdU, 0–100 nM E, 3 nM or 300 nM GC3,
  , binding curves shown in Supplemental Figs. 2, 3). The observed rate constant was plotted against enzyme concentration and fit by Equation 2A. In these experiments, substrates and products containing a 2′-H substitution at the −1U position were used, which has been shown to slow the chemical step ∼1000-fold, ensuring that the chemical step is rate-limiting. Thus, under the reaction conditions used here, the dissociation constant for CAdUA5 and CAdU is faster than the chemical step such that the observed K1/2 values equal the dissociation constant Kd. This conclusion is further supported by the observation that the same K1/2 values were observed in independent experiments in which the maximal rate constant for reaction varied by >10-fold by varying the pH. Values of Kd for S and P with G or GXn bound were also calculated from the association and dissociation rate constants, according to Equation 2B. These values agree with the above measured equilibrium dissociation constants within 20%.
 |
(2A) |
 |
(2B) |
The affinity of CAUC3 for the extended IGS ribozyme is very high, such that nonspecific losses to the tube walls are observed at the subpicomolar enzyme concentrations low enough to be subsaturating. This loss prevents measurement of an equilibrium dissociation constant via concentration dependences on observed rate constants for this construct. The values of Kd for CAUC3 with and without G bound were therefore calculated from the association and dissociation rate constants, according to Equation 2B.
Association rate constants for the S and P
Association rate constants for oligonucleotide substrates and products, CAUA5, CAUC3, and CAU, were obtained in side-by-side reactivity measurements. In these experiments, the conversion of *S to *P was followed for several subsaturating ribozyme concentrations (1–30 nM) in the presence of subsaturating or saturating concentrations of G for CAUA5 and for CAUC3 (k1 and k4 (Fig. 2); conditions: 10 μM or 2.1 mM G, KdG = 68 μM (L-9A), KdG = 270 μM (L-6A)). Analogously, the conversion of *P to *S was followed in the presence of subsaturating or saturating concentrations of GA5 or GC3 (k7 and k8 (Fig. 2); conditions: 3 or 300 nM GC3,  (L-6A); 30 μM or 1 mM GA5,
  (L-9A)). The fraction reaction was plotted as a function of time and fit to an exponential to yield a first-order rate constant (R2 > 0.9).
The ribozyme concentrations used to measure association rate constants are greater than the dissociation constant for S and P, but are nonetheless subsaturating, as the rate constant for reaction of the bound oligonucleotide is faster than dissociation under these conditions (pH 7.9, vide infra). Plots of the observed first-order rate constants against ribozyme concentration were linear in all cases (R2 ≥ 0.8) and gave the association rate constants reported in Figure 2.
Dissociation rate constants for S
Dissociation rate constants for the oligonucleotide substrates, CAUC3 and CAdUC3 bound to the L-6A ribozyme were determined in pulse-chase gel-shift experiments in the presence or absence of G (conditions: 2.1 mM or 0 μM G,  ). Oligonucleotides with a 2′-H substitution at the −1U position were used to minimize the amount of reaction that occurred during the experiment (Chart 1). Control experiments in the absence of G show that the dissociation rate constant for CAUC3 was the same within error of CAdUC3. Trace *S was bound to saturating concentrations of ribozyme (“pulse”: 10 nM E,
  ). After time t1 (≥5 min) sufficient for complete binding of *S or *P, the dissociation reaction was initiated by the addition of a large excess (≥10-fold over ribozyme) of unlabeled CAdUC3 (“chase”) to prevent rebinding of dissociated *S. Control reactions confirmed that the chase was effective in preventing rebinding of dissociated *S. At specified times t2 aliquots were carefully loaded onto a running native gel in THEM buffer (33 mM Tris, 67 mM HEPES, 1 mM EDTA, 15 mM MgCl2). The dependence of the fraction of bound *S on t2 yields the first-order dissociation rate constant (R2 > 0.9).
The dissociation rate constants of CAUA5 from the E•S•G complex for the L-9A and L-6A ribozymes were determined from experiments that measured the partitioning of molecules in the bound complex (i.e., E•S•G) between dissociation of S (k−4) (Fig. 2) and the reaction of the ternary complex (k5) (Fig. 2). To accurately determine the rate constants in these experiments, the rates for dissociation and reaction must be similar. To accomplish this, partitioning experiments were carried out at pH 5.0, 5.5, and 6.0 (k5 = 0.06, 0.2, and 0.6 min−1, respectively) for E•S•G with S = CAUA5. To determine partitioning, radiolabeled *S was bound to the ribozyme (1 μM) to allow formation of the E•*S complex. Reaction was initiated by addition of G (2.1 mM, KdG = 53, 59 μM for L-9A and L-6A, respectively) to rapidly form the complex E•*S•G, along with a large excess (50 μM) of unlabeled CAdUC3 to prevent rebinding of dissociated *S (“chase”), such that E•*S was diluted 10-fold. The observed rate constant for formation of *P from *S is the sum of the rate constants for the chemical step and dissociation of S from the ternary complex (Rose et al. 1974; Karbstein et al. 2002, 2007). Thus, by independently measuring the rate constant for the chemical step in reactions with chase omitted, the dissociation rate constant can be obtained according to Equation 3A. The dissociation rate constant can also be obtained from the fraction of *S that reacted, relative to reactions in which no chase was added, and the rate constant for the chemical step (Equation 3B). The dissociation rate constants obtained from these two methods were within twofold. An average value from measurements under all pH conditions is reported in Figure 2.
| (3A) |
 |
(3B) |
Measurement of the G, GC3, and GA5 affinities
Equilibrium dissociation constants for G, GC3, and GA5 to the L-9A and L-6A ribozymes with or without *S or *P bound were determined by measuring the rate of reaction with varying concentrations of G, GC3, or GA5 (L-9A conditions: trace S = *CAdUA5, [E] = 1 or 100 nM,  , 0–2.1 mM G; or trace P = *CAdU, [E] = 5 nM or 1 μM, KdCAU = 19 nM, 0–3 mM GA5; L-6A conditions: trace S = *CAdUA5, [E] = 1 or 100 nM,
  , 0–2.1 mM G, trace S = *CAdUC3, [E] = 1 nM,
  , 0–2.1 mM G; or, trace P = *CAdU, [E] = 0.5 nM or 100 nM, KdCAU = 1.5 nM, 0–1 μM GC3 or 0–3 mM GA5, binding curves shown in Supplemental Figs. 1, 6). To measure the affinity of G for the free L-6A ribozyme, the CAdUA5 substrate was used (1 nM E,
  ).
).
The observed rate constant was plotted against enzyme concentration and fit by Equation 1A. In these experiments, *S and *P containing a 2′-H substitution at the −1U position (Chart 1) were used to ensure that the chemical step is rate-limiting (Herschlag et al. 1993; Herschlag and Khosla 1994). Thus, under the reaction conditions used here, the dissociation of CAdUA5 or CAdU is faster than the chemical step such that the observed K1/2 values equal dissociation constants (Kd). This conclusion is further supported by the observation that the same K1/2 values were observed in independent experiments in which the maximal rate constant for reaction varied by >10-fold, which was accomplished by varying the pH. Values of Kd for G with S bound were also obtained from the association and dissociation rate constants (see “Association and dissociation rate constants for G”), according to Equation 2B. These values agree with the above measured equilibrium dissociation constants with 25%.
Association and dissociation rate constants for G
(kc/KM)G, the second-order rate constant for the reaction E · S + G → products, was previously determined to correspond to the konG above pH 7 for the Tetrahymena ribozyme. To obtain (kc/KM)G for the Azoarcus ribozymes, reaction rate constants were determined with four subsaturating G concentrations and E saturating with respect to S for the L-9A and L-6A ribozymes with CAUA5 (0–20 μM G, [E] = 500 nM,  , 200 μM,
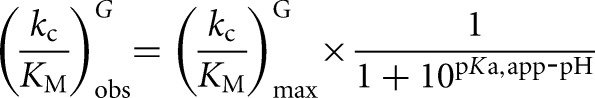
  , 59 nM for the L-9A and L-6A ribozymes, respectively). The observed rate constants were plotted as a function of ribozyme concentration, which gave linear fits (R2 > 0.90) with the slope representing the apparent second-order rate constant, (kc/KM)G. The values of (kc/KM)G obtained were plotted as a function of pH, and fits to Equation 4 gave the apparent pKa, pKa,app, and the maximum second-order rate constant, (kc/KM)maxG (Fig. 4A). Pulse-chase experiments (described below) are consistent with (kc/KM)maxG equaling konG, as was observed for the Tetrahymena ribozyme. The following buffers were used: Na-acetate, pH 4.5–5.5; Na-MES, pH 5.4–6.7; Na-MOPS, pH 6.5–7.9; Na-EPPS, pH 7.9–8.6.
 |
(4) |
Pulse-chase experiments were performed to determine whether the rate-limiting step above pH 7 precedes the forward chemical step, as was observed for the Tetrahymena ribozyme (Karbstein and Herschlag 2003), which would be consistent with (kc/KM)G equaling konG. The rate-limiting step can be determined by measuring the pH dependence of the partitioning of E•*CAU•GA5 between formation of *CAUA5 and dissociation of GA5. If the rate-limiting step precedes the forward chemical step above pH 7, then GA5 will dissociate from E•*CAU•GA5 before the formation and dissociation of the reaction products G and CAUA5 (see Supplemental Fig. 7 for a description of the pulse-chase experiment).
E•*CAU•GA5 was formed at pH 5.7 by adding saturating amounts of GA5 (0.5 mM,  ) to E•*CAU (trace P = *CAU, [E] = 1 μM, KdP = 19 nM) and waiting 10 s to allow for complete GA5 binding. Excess cold GA (5 mM) was added with buffer of the desired pH (Supplemental Fig. 7C). Control experiments confirmed the efficacy of the chase in preventing rebinding of GA5. Reaction with GA forms *CAUA, which was separated from *CAUA5 by denaturing gel electrophoresis. The fraction of *CAUA5 was plotted against pH (Supplemental Fig. 7D).
The dissociation rate constant for G, koffG, was determined from the rate constant for the chemical step and the pKa,app from plots of pH versus (kc/KM)G fit to Equation 4. At the pH corresponding to the apparent pKa, koffG = kchem. Values of Kd for G with S bound calculated from these association and dissociation rate constants (Equation 2B) agree with the experimentally measured Kd values within 25%.
Association rate constants for GC3
The association rate constant for GC3 was determined in pulse-chase experiments. E•P was preformed at pH 6.0 (conditions: P = CAU, 1–10 nM L-6A, KdP = 1.5 nM), with 10% excess P over E to ensure that essentially all E had P bound. *GC3 was then added to allow the formation of E•P•GC3. At varying times, t1, an excess of unlabeled GC3 was added at pH 8.5 and 30°C. Control experiments confirmed the effectiveness of the chase in preventing the rebinding of *GC3 and in allowing fast reaction of the E•P•*GC3 that had formed. Plotting the fraction of *GC3 reacted against t1 gives a rate constant for GC3 binding. These rate constants were plotted as a function of E•P concentration to obtain a second-order rate constant,  from the slope of a linear fit to the data.
Measurement of the rate constants for the chemical step
The rate constant for the forward chemical step (Fig. 2, k5) was measured by forming E•S•G and following the formation of *P (L-9A conditions: trace S = *CAUA5 or *CAdUA5, [E] = 1 μM,  , [G] = 2.1 mM,
  ; L-6A conditions: trace S = *CAUA5 or *CAdUA5, [E] = 1 μM,
  , [G] = 2.1 mM,
  ; trace S = *CAUC3 or *CAdUC3, [E] = 100 nM,
  , [G] = 2.1 mM,
  ). Likewise, the rate constant for the reverse chemical step (Fig. 2, k−5) was measured by forming E•P•GC3 and following the formation of *S (L-9A conditions: trace P = *CAU or *CAdU, [E] = 1 μM, KdCAU = 19 nM, [GA5] = 1 mM,
  ; L-6A conditions: trace P = *CAU or *CAdU, [E] = 100 nM, KdCAU = 1.5 nM, [GC3] = 500 nM,
  ). The rate constants for the forward and reverse chemical step were determined for S and P with and without a 2′-H substitution at the −1U position as a function of pH over a range of 5–9 and were fit to Equation 5.
 |
(5) |
The temperature dependence of the rate constants for the forward chemical step was determined for the L-21T and L-9A ribozymes side-by-side at pH values 7.3, 7.9, and 8.5 for oligonucleotide substrates containing a 2′-H substitution at the −1U position (L-9A conditions as above; L-21T conditions: trace S = *CCCUCdUA, [E] = 1 μM,  , [G] = 2.1 mM,
  ).
).
Internal and external equilibria
The internal equilibrium constant, Kint, was calculated from the rate constants for reaction of the ternary complexes of bound substrates and products, k5 and k−5, which describe the chemical step of the forward and reverse reactions, respectively (Equation 6). These rate constants were determined from side-by-side reactivity measurements, as described above in Measurement of the rate constants for the chemical step. Kint is constant across the pH range 5.0–8.5 (Fig. 7).
 |
(6) |
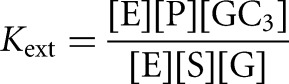
The external equilibrium, Kext, describes the equilibrium between free substrates and free products (Equation 7A). Reactions were carried out with 20 nM E  and 10–30 μM G (KdG = 68 μM) and 10–30 μM GA5
 for the L-9A ribozyme, or 20 nM E
  and 30–100 μM G (KdG = 270 μM) and 30–300 μM GA5
 for the L-6A ribozyme. *S and *P were used in trace so that the concentrations of G or GA5 were essentially unchanged during the course of the reaction. The value of Kext was calculated from the fraction of *P formed from *S at different ratios of GA5/G according to Equation 7B, which was derived from Equation 7A. Control experiments in which the concentrations of E or GA5 and G were varied while maintaining a constant ratio of GA5/G gave faster reaction but no change in the observed extent of reaction, indicating that substrates and products were subsaturating. The same value of Kext was obtained from reactions initiated with *P, within 5% (Kext = 3.1 ± 0.6 for reactions initiated with *S; Kext = 3.1 ± 0.4 for reactions initiated with *P; data not shown).
 |
(7A) |
 |
(7B) |
SUPPLEMENTAL MATERIAL
Supplemental material is available for this article.
Supplementary Material
ACKNOWLEDGMENTS
We thank Jenny Lu and Ishraq AlSadhan for their outstanding technical assistance with kinetic assays. We also thank Breena Stoner and Raghuvir Sengupta for helpful advice and discussions. We thank Breena Stoner and other members of the Herschlag lab for comments on the manuscript. This work was supported by a National Institutes of Health (NIH) grant to D.H.H. (GM49243). K.R.G. gratefully acknowledges a postdoctoral fellowship from a Jane Coffin Childs Memorial Fund.
Footnotes
Article published online ahead of print. Article and publication date are at http://www.rnajournal.org/cgi/doi/10.1261/rna.044362.114.
The IGS extension sequences in the L-6A and L-16T ribozymes are not the sequences naturally present in the corresponding group I introns, but were chosen to facilitate in vitro transcription and increase duplex stability. Also, we use nomenclature following from that of Cech (e.g., Zaug et al. 1984 for Tetrahymena numbering or Tanner and Cech 1996 for Azoarcus numbering) with the 5′-most G residue that is added to the intron during self-splicing included in the numbering—i.e., as one of the residues removed in our constructs. Although different nomenclature has sometimes been employed for Azoarcus constructs, this system allows consistent nomenclature among the Azoarcus and Tetrahymena constructs studied.
Prior work strongly suggests that the difference in MgCl2 concentration (10 versus 15 mM; chosen to facilitate comparisons with previously published work) does not significantly impact the data and comparisons made herein. The [Mg2+] dependence of S and G binding to the Tetrahymena ribozyme reveals less than a twofold change in koffS, koffP, and (kc/Km)G between 2 and 100 mM MgCl2; the binding of pG is only affected by two- to threefold in the range of 10–100 mM MgCl2 (McConnell and Cech 1995). The association rate constant of S increases by ∼10-fold between 2 and 100 mM MgCl2, but increases by less than twofold between 10 and 15 mM MgCl2 (McConnell et al. 1997). Similarly, no differences between values for KdS, KdG, or kchem measured at 10 and 15 mM MgCl2 have been observed for the Azoarcus ribozyme (BM Stoner and D Herschlag, unpubl.).
In some studies UCG was used in place of G, and the 5′ UC sequence can form additional base pairs (to give the so-called P9.0 helix) and thereby strengthen binding (Karbstein et al. 2002; Karbstein and Herschlag 2003).
This mixture corresponds to an internal equilibrium of 2.3 for the crystallized construct containing a six-nucleotide IGS extension (GGCCGU) relative to the L-9A ribozyme. This value is similar to the values of 0.83 and 1.7 observed for the L-9A and L-6A Azoarcus ribozymes studied in this paper (Fig. 2) (see “The external and internal equilibrium constants”).
REFERENCES
- Adams PL, Stahley MR, Gill ML, Kosek AB, Wang J, Strobel SA. 2004a. Crystal structure of a group I intron splicing intermediate. RNA 10: 1867–1887 [DOI] [PMC free article] [PubMed] [Google Scholar]
- Adams PL, Stahley MR, Kosek AB, Wang J, Strobel SA. 2004b. Crystal structure of a self-splicing group I intron with both exons. Nature 430: 45–50 [DOI] [PubMed] [Google Scholar]
- Bartley LE, Zhuang X, Das R, Chu S, Herschlag D. 2003. Exploration of the transition state for tertiary structure formation between an RNA helix and a large structured RNA. J Mol Biol 328: 1011–1026 [DOI] [PubMed] [Google Scholar]
- Behrouzi R, Roh JH, Kilburn D, Briber RM, Woodson SA. 2012. Cooperative tertiary interaction network guides RNA folding. Cell 149: 348–357 [DOI] [PMC free article] [PubMed] [Google Scholar]
- Benz-Moy TL, Herschlag D. 2011. Structure-function analysis from the outside in: Long-range tertiary contacts in RNA exhibit distinct catalytic roles. Biochemistry 50: 8733–8755 [DOI] [PMC free article] [PubMed] [Google Scholar]
- Bevilacqua PC, Kierzek R, Johnson KA, Turner DH. 1992. Dynamics of ribozyme binding of substrate revealed by fluorescence-detected stopped-flow methods. Science 258: 1355–1358 [DOI] [PubMed] [Google Scholar]
- Bhaskaran H, Russell R. 2007. Kinetic redistribution of native and misfolded RNAs by a DEAD-box chaperone. Nature 449: 1014–1018 [DOI] [PMC free article] [PubMed] [Google Scholar]
- Burke JM. 1988. Molecular genetics of group I introns: RNA structures and protein factors required for splicing—a review. Gene 73: 273–294 [DOI] [PubMed] [Google Scholar]
- Burton AS, Lehman N. 2006. Calcium(II)-dependent catalytic activity of the Azoarcus ribozyme: testing the limits of resolution for in vitro selection. Biochimie 88: 819–825 [DOI] [PubMed] [Google Scholar]
- Cech TR. 1988. Conserved sequences and structures of group I introns: building an active site for RNA catalysis—a review. Gene 73: 259–271 [DOI] [PubMed] [Google Scholar]
- Cech TR. 1990. Self-splicing of group I introns. Annu Rev Biochem 59: 543–568 [DOI] [PubMed] [Google Scholar]
- Cech TR, Herschlag D, Piccirilli JA, Pyle AM. 1992. RNA catalysis by a group I ribozyme. Developing a model for transition state stabilization. J Biol Chem 267: 17479–17482 [PubMed] [Google Scholar]
- Dolan GF, Muller UF. 2014. Trans-splicing with the group I intron ribozyme from Azoarcus. RNA 20: 202–213 [DOI] [PMC free article] [PubMed] [Google Scholar]
- Doudna JA, Lorsch JR. 2005. Ribozyme catalysis: not different, just worse. Nat Struct Mol Biol 12: 395–402 [DOI] [PubMed] [Google Scholar]
- Fersht A. 1999. Structure and mechanism in protein science: a guide to enzyme catalysis and protein folding. W.H. Freeman, New York [Google Scholar]
- Golden BL, Kim H, Chase E. 2005. Crystal structure of a phage Twort group I ribozyme-product complex. Nat Struct Mol Biol 12: 82–89 [DOI] [PubMed] [Google Scholar]
- Herschlag D, Cech TR. 1990a. Catalysis of RNA cleavage by the Tetrahymena thermophila ribozyme. 1. Kinetic description of the reaction of an RNA substrate complementary to the active site. Biochemistry 29: 10159–10171 [DOI] [PubMed] [Google Scholar]
- Herschlag D, Cech TR. 1990b. Catalysis of RNA cleavage by the Tetrahymena thermophila ribozyme. 2. Kinetic description of the reaction of an RNA substrate that forms a mismatch at the active site. Biochemistry 29: 10172–10180 [DOI] [PubMed] [Google Scholar]
- Herschlag D, Cech T. 1996. Group I ribozymes: substrate recognition, catalytic strategies, and comparative mechanistic analysis. 1st ed. Springer, Berlin/New York [Google Scholar]
- Herschlag D, Khosla M. 1994. Comparison of pH dependencies of the Tetrahymena ribozyme reactions with RNA 2′-substituted and phosphorothioate substrates reveals a rate-limiting conformational step. Biochemistry 33: 5291–5297 [DOI] [PubMed] [Google Scholar]
- Herschlag D, Piccirilli JA, Cech TR. 1991. Ribozyme-catalyzed and nonenzymatic reactions of phosphate diesters: rate effects upon substitution of sulfur for a nonbridging phosphoryl oxygen atom. Biochemistry 30: 4844–4854 [DOI] [PubMed] [Google Scholar]
- Herschlag D, Eckstein F, Cech TR. 1993. The importance of being ribose at the cleavage site in the Tetrahymena ribozyme reaction. Biochemistry 32: 8312–8321 [DOI] [PubMed] [Google Scholar]
- Hougland JL, Piccirilli JA, Forconi M, Lee J, Herschlag D. 2006. How the group I intron works: a case study of RNA structure and function. Cold Spring Harb Mon 43: 133–205 [Google Scholar]
- Ikawa Y, Naito D, Shiraishi H, Inoue T. 2000a. Structure–function relationships of two closely related group IC3 intron ribozymes from Azoarcus and Synechococcus pre-tRNA. Nucleic Acids Res 28: 3269–3277 [DOI] [PMC free article] [PubMed] [Google Scholar]
- Ikawa Y, Shiraishi H, Inoue T. 2000b. A small structural element, Pc-J5/5a, plays dual roles in a group IC1 intron RNA. Biochem Biophys Res Commun 274: 259–265 [DOI] [PubMed] [Google Scholar]
- Ikawa Y, Sasaki K, Tominaga H, Inoue T. 2003. The P5 activator of a group IC ribozyme can replace the P7.1/7.2 activator of a group IA ribozyme. J Biochem 133: 665–670 [DOI] [PubMed] [Google Scholar]
- Jaru-Ampornpan P, Chandrasekar S, Shan SO. 2007. Efficient interaction between two GTPases allows the chloroplast SRP pathway to bypass the requirement for an SRP RNA. Mol Biol Cell 18: 2636–2645 [DOI] [PMC free article] [PubMed] [Google Scholar]
- Karbstein K, Herschlag D. 2003. Extraordinarily slow binding of guanosine to the Tetrahymena group I ribozyme: implications for RNA preorganization and function. Proc Natl Acad Sci 100: 2300–2305 [DOI] [PMC free article] [PubMed] [Google Scholar]
- Karbstein K, Carroll KS, Herschlag D. 2002. Probing the Tetrahymena group I ribozyme reaction in both directions. Biochemistry 41: 11171–11183 [DOI] [PubMed] [Google Scholar]
- Karbstein K, Tang KH, Herschlag D. 2004. A base triple in the Tetrahymena group I core affects the reaction equilibrium via a threshold effect. RNA 10: 1730–1739 [DOI] [PMC free article] [PubMed] [Google Scholar]
- Karbstein K, Lee J, Herschlag D. 2007. Probing the role of a secondary structure element at the 5′- and 3′-splice sites in group I intron self-splicing: The tetrahymena L-16 ScaI ribozyme reveals a new role of the G.U pair in self-splicing. Biochemistry 46: 4861–4875 [DOI] [PMC free article] [PubMed] [Google Scholar]
- Kim H. 2008. “Characterization of the quanosine binding process of the Twort group I ribozyme.” PhD thesis, Purdue University, West Lafayette, IN [Google Scholar]
- Kuo LY, Cech TR. 1996. Conserved thermochemistry of guanosine nucleophile binding for structurally distinct group I ribozymes. Nucleic Acids Res 24: 3722–3727 [DOI] [PMC free article] [PubMed] [Google Scholar]
- Kuo LY, Piccirilli JA. 2001. Leaving group stabilization by metal ion coordination and hydrogen bond donation is an evolutionarily conserved feature of group I introns. Biochim Biophys Acta 1522: 158–166 [DOI] [PubMed] [Google Scholar]
- Kuo LY, Davidson LA, Pico S. 1999. Characterization of the Azoarcus ribozyme: tight binding to guanosine and substrate by an unusually small group I ribozyme. Biochim Biophys Acta 1489: 281–292 [DOI] [PubMed] [Google Scholar]
- Liao X, Anjaneyulu PS, Curley JF, Hsu M, Boehringer M, Caruthers MH, Piccirilli JA. 2001. The tetrahymena ribozyme cleaves a 5′-methylene phosphonate monoester approximately 102-fold faster than a normal phosphate diester: implications for enzyme catalysis of phosphoryl transfer reactions. Biochemistry 40: 10911–10926 [DOI] [PubMed] [Google Scholar]
- Lipchock SV, Strobel SA. 2008. A relaxed active site after exon ligation by the group I intron. Proc Natl Acad Sci 105: 5699–5704 [DOI] [PMC free article] [PubMed] [Google Scholar]
- Mathews DH, Sabina J, Zuker M, Turner DH. 1999. Expanded sequence dependence of thermodynamic parameters improves prediction of RNA secondary structure. J Mol Biol 288: 911–940 [DOI] [PubMed] [Google Scholar]
- McConnell TS, Cech TR. 1995. A positive entropy change for guanosine binding and for the chemical step in the Tetrahymena ribozyme reaction. Biochemistry 34: 4056–4067 [DOI] [PubMed] [Google Scholar]
- McConnell TS, Herschlag D, Cech TR. 1997. Effects of divalent metal ions on individual steps of the Tetrahymena ribozyme reaction. Biochemistry 36: 8293–8303 [DOI] [PubMed] [Google Scholar]
- Michel F, Westhof E. 1990. Modelling of the three-dimensional architecture of group I catalytic introns based on comparative sequence analysis. J Mol Biol 216: 585–610 [DOI] [PubMed] [Google Scholar]
- Narlikar GJ, Herschlag D. 1996. Isolation of a local tertiary folding transition in the context of a globally folded RNA. Nat Struct Biol 3: 701–710 [DOI] [PubMed] [Google Scholar]
- Narlikar GJ, Herschlag D. 1998. Direct demonstration of the catalytic role of binding interactions in an enzymatic reaction. Biochemistry 37: 9902–9911 [DOI] [PubMed] [Google Scholar]
- Narlikar GJ, Gopalakrishnan V, McConnell TS, Usman N, Herschlag D. 1995. Use of binding energy by an RNA enzyme for catalysis by positioning and substrate destabilization. Proc Natl Acad Sci 92: 3668–3672 [DOI] [PMC free article] [PubMed] [Google Scholar]
- Narlikar GJ, Khosla M, Usman N, Herschlag D. 1997. Quantitating tertiary binding energies of 2′ OH groups on the P1 duplex of the Tetrahymena ribozyme: intrinsic binding energy in an RNA enzyme. Biochemistry 36: 2465–2477 [DOI] [PubMed] [Google Scholar]
- Narlikar GJ, Bartley LE, Khosla M, Herschlag D. 1999. Characterization of a local folding event of the Tetrahymena group I ribozyme: effects of oligonucleotide substrate length, pH, and temperature on the two substrate binding steps. Biochemistry 38: 14192–14204 [DOI] [PubMed] [Google Scholar]
- Peracchi A, Beigelman L, Usman N, Herschlag D. 1996. Rescue of abasic hammerhead ribozymes by exogenous addition of specific bases. Proc Natl Acad Sci 93: 11522–11527 [DOI] [PMC free article] [PubMed] [Google Scholar]
- Rose IA, O'Connell EL, Litwin S. 1974. Determination of the rate of hexokinase-glucose dissociation by the isotope-trapping method. J Biol Chem 249: 5163–5168 [PubMed] [Google Scholar]
- Russell R, Herschlag D. 1999. New pathways in folding of the Tetrahymena group I RNA enzyme. J Mol Biol 291: 1155–1167 [DOI] [PubMed] [Google Scholar]
- Russell R, Herschlag D. 2001. Probing the folding landscape of the Tetrahymena ribozyme: Commitment to form the native conformation is late in the folding pathway. J Mol Biol 308: 839–851 [DOI] [PubMed] [Google Scholar]
- Russell R, Millett IS, Doniach S, Herschlag D. 2000. Small angle X-ray scattering reveals a compact intermediate in RNA folding. Nat Struct Biol 7: 367–370 [DOI] [PubMed] [Google Scholar]
- Russell R, Zhuang X, Babcock HP, Millett IS, Doniach S, Chu S, Herschlag D. 2002. Exploring the folding landscape of a structured RNA. Proc Natl Acad Sci 99: 155–160 [DOI] [PMC free article] [PubMed] [Google Scholar]
- Sengupta RN, Herschlag D, Piccirilli JA. 2012. Thermodynamic evidence for negative charge stabilization by a catalytic metal ion within an RNA active site. ACS Chem Biol 7: 294–299 [DOI] [PMC free article] [PubMed] [Google Scholar]
- Shan SO, Herschlag D. 1999. Probing the role of metal ions in RNA catalysis: kinetic and thermodynamic characterization of a metal ion interaction with the 2′-moiety of the guanosine nucleophile in the Tetrahymena group I ribozyme. Biochemistry 38: 10958–10975 [DOI] [PubMed] [Google Scholar]
- Shen K, Shan SO. 2010. Transient tether between the SRP RNA and SRP receptor ensures efficient cargo delivery during cotranslational protein targeting. Proc Natl Acad Sci 107: 7698–7703 [DOI] [PMC free article] [PubMed] [Google Scholar]
- Sinan S, Yuan X, Russell R. 2011. The Azoarcus group I intron ribozyme misfolds and is accelerated for refolding by ATP-dependent RNA chaperone proteins. J Biol Chem 286: 37304–37312 [DOI] [PMC free article] [PubMed] [Google Scholar]
- Solomatin SV, Greenfeld M, Chu S, Herschlag D. 2010. Multiple native states reveal persistent ruggedness of an RNA folding landscape. Nature 463: 681–684 [DOI] [PMC free article] [PubMed] [Google Scholar]
- Tanner M, Cech T. 1996. Activity and thermostability of the small self-splicing group I intron in the pre-tRNAlle of the purple bacterium Azoarcus. RNA 2: 74–83 [PMC free article] [PubMed] [Google Scholar]
- Tanner MA, Anderson EM, Gutell RR, Cech TR. 1997. Mutagenesis and comparative sequence analysis of a base triple joining the two domains of group I ribozymes. RNA 3: 1037–1051 [PMC free article] [PubMed] [Google Scholar]
- Vicens Q, Cech TR. 2006. Atomic level architecture of group I introns revealed. Trends Biochem Sci 31: 41–51 [DOI] [PubMed] [Google Scholar]
- Wan Y, Mitchell D III, Russell R. 2009. Catalytic activity as a probe of native RNA folding. Methods Enzymol 468: 195–218 [DOI] [PMC free article] [PubMed] [Google Scholar]
- Wang JF, Downs WD, Cech TR. 1993. Movement of the guide sequence during RNA catalysis by a group I ribozyme. Science 260: 504–508 [DOI] [PubMed] [Google Scholar]
- Xia T, SantaLucia J Jr, Burkard ME, Kierzek R, Schroeder SJ, Jiao X, Cox C, Turner DH. 1998. Thermodynamic parameters for an expanded nearest-neighbor model for formation of RNA duplexes with Watson–Crick base pairs. Biochemistry 37: 14719–14735 [DOI] [PubMed] [Google Scholar]
- Zarrinkar PP, Williamson JR. 1996. The kinetic folding pathway of the Tetrahymena ribozyme reveals possible similarities between RNA and protein folding. Nat Struct Biol 3: 432–438 [DOI] [PubMed] [Google Scholar]
- Zaug AJ, Kent JR, Cech TR. 1984. A labile phosphodiester bond at the ligation junction in a circular intervening sequence RNA. Science 224: 574–578 [DOI] [PubMed] [Google Scholar]
- Zhou Y, Lu C, Wu QJ, Wang Y, Sun ZT, Deng JC, Zhang Y. 2008. GISSD: Group I Intron Sequence and Structure Database. Nucleic Acids Res 36: D31–D37 [DOI] [PMC free article] [PubMed] [Google Scholar]
Associated Data
This section collects any data citations, data availability statements, or supplementary materials included in this article.