

Abstract
Introduction
The passive electrical properties of muscle, including conductivity and permittivity and their directional dependence, may be altered in neuromuscular disease; however, the character of these alterations is unknown.
Methods
Fifteen wild-type mice, 13 amyotrophic lateral sclerosis mice, 9 muscular dystrophy (mdx) mice, and 15 with induced disuse atrophy were sacrificed, and the gastrocnemius was excised. A 50 kHz current was applied immediately to the ex vivo muscle, and its material properties were calculated.
Results
The disease groups showed distinct material property values, with F[(12, 119)=14.6, P<0.001, MANOVA]. Post-hoc tests confirmed that differences existed in all 4 groups. They were most pronounced in the mdx mice, which had markedly increased conductivity. Direction-dependent properties of current flow were significantly different among the groups (P<0.001).
Discussion
These data confirm that the inherent passive electrical properties of muscle differ by disease type. We anticipate that similar data could eventually be obtained via surface measurements, providing an innovative approach to muscle disease diagnosis.
Keywords: Muscle, material properties, impedance, amyotrophic lateral sclerosis, Duchenne muscular dystrophy
The electrical material properties of a substance refer to the inherent characteristics of that substance when an electrical current is passed through it. These properties, also referred to as the dielectric values, include conductivity (the ease through which an applied current will transverse the tissue) and permittivity (the ease by which the material can be induced to maintain an electrical field).1 Importantly, these qualities are not dependent on any active processes within the substance but rather represent passive characteristics of the material. Such properties may also be dependent on the direction across which the electrical current is passed; if no such dependency is present, the material is described as isotropic; if there is one, it is deemed anisotropic.1
Historically, the field of neuromuscular medicine has focused on active rather than passive electrical properties of muscle. In both standard nerve conduction studies and needle electromyography, the basic techniques of clinical neurophysiologic testing, the focus is placed on the recording of action potentials in nerve and muscle. Recently, however, the technique of electrical impedance myography (EIM) has been introduced as a new method of neuromuscular assessment.2 Unlike standard electrophysiological techniques, EIM does not assess the active electrical properties of the tissue but rather the underlying muscle structure and composition based on its inherent electrical properties. To date, EIM has shown promise as a tool for following disease progression in amyotrophic lateral sclerosis3 and is being studied in a variety of other conditions, including Duchenne muscular dystrophy4 and sarcopenia.5
One of the underlying premises of the technique is that the material properties alter in disease,2 and limited earlier work has demonstrated differences in the electrical material properties of healthy muscle versus that impacted by primary neurogenic atrophy.6 However, whether different neuromuscular disorders confer distinct electrical properties on muscle is unknown. If such distinct material properties were identified, it would suggest that impedance-based methods could be used effectively to identify disease type. Such methods could be performed on excised muscle tissue from biopsies; however, it is also possible to derive the electrical characteristics of the tissue from surface measurements alone.
In this study, we address this hypothesis by evaluating the passive material properties of normal muscle and 3 distinct types of neuromuscular pathology (ALS, muscular dystrophy, and disuse atrophy) in the hope of identifying distinct electrical properties in each condition.
METHODS
Animals
The Institutional Animal Care and Use Committees at Beth Israel Deaconess and Acceleron Pharma approved the protocol, as the studies were performed in both locations. Four different groups of animals were utilized in this study: 1) Normal C57Bl/6N, Age 10 to 11 weeks, N = 15; 7 males, 8 females obtained from Charles River Laboratories, stock # 027; 2) ALS B6SJL-Tg(SOD1*G93A)1Gur/J (Age 18 weeks, N= 13; 5 males, 8 females) obtained from Jackson Laboratories, stock # 002726; 3) mdx C57BL/10ScSn-Dmdmdx/J (Age 10 weeks, N = 9; All male) obtained from Jackson Laboratories, Stock # 001801; 4) Two-week hind-limb unloaded (HLU) animals C57Bl/6N obtained from Charles River Laboratories, stock # 027, (Age 11 weeks, N= 15, all female). The animals in the latter group had undergone hind limb unloading (with approval of BIDMC) using standard approaches of tethering the tail to a wire such that the animal was only allowed to walk around on its front paws; this method induces hind limb atrophy.7
The gastrocnemius muscle was excised from each animal under isoflurane anesthesia and was immediately placed in an impedance-measuring cell, as described below. Although the excised animal tissue was treated identically, the animals utilized came from several different experiments performed in our laboratories, including a study of control and hind limb unloading in mice,8 a study in ALS and control mice,9 and a study in control and mdx mice.4 Those studies did not report any of the findings contained in this report.
Impedance measurements
Ex vivo impedance measurements were made as described previously.6 Briefly, the muscle tissue was placed in 1 of 2 impedance cells, depending on muscle tissue size: either 2.5 mm × 2.5mm or 5mm × 5mm base, depending on the amount of tissue extracted (Figure 1). Each cell had 2 stainless steel plates on opposite walls that served as current-emitting electrodes. The tissue was cut to the base dimensions of the cell and placed so it fit tightly within it, making full contact with each of the electrode plates. A cover was then placed over the cell through which 2 monopolar EMG needle electrodes (Ref# 902-DMG50, Viasys Healthcare) were inserted to serve as voltage-measuring electrodes. This was performed in order to accomplish a standard 4-electrode impedance measurement1 that impacted minimally the conductivity of the tissue being measured (hence the need for very small, monopolar needle electrodes that barely penetrate the muscle). The multifrequency impedance of the tissue was measured using the SFB7 impedance measuring system (Impedimed, Inc, Sydney, Australia). For this set of analyses, the 50 kHz values only were used in order to simplify the calculations and because this frequency has been studied most consistently. In addition, muscle has the greatest inherent capacitive properties at or near this frequency. However, 3 kHz to 1000 kHz data were collected to help ensure that the data were not distorted by low-frequency artifacts due to poor electrode contact. Measurements were made both longitudinal and transverse to the major muscle fiber direction, and each measurement was repeated to ensure stability. Longitudinal measurements were made with current flowing parallel to muscle fibers; transverse data were collected with current flowing perpendicular to the muscle fibers. The height of the tissue in the cell was also measured to calculate the approximate cross-sectional area of the sample to be used in the formulas provided below.
Figure 1.
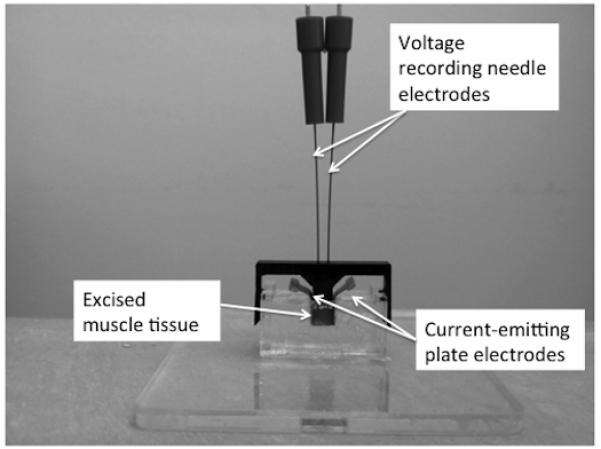
Impedance cell technique used for ex vivo data collection. The impedance system itself and connecting wires are not shown. Two sides of the chamber consist of large stainless steel plates that serve as the current emitting electrodes (the metal tabs of which are used to connect to the impedance system). The monopolar needle electrodes protruding through the top of the device serve as the voltage measuring electrodes.
Dielectric Calculations
The dielectric measurements, conductivity (σ) and relative permittivity (εr) were computed via equations (1) and (2) shown below, where d is the voltage electrode, A is the cross-sectional area of the muscle, R and X are, respectively, the measured resistance and reactance at 50 kHz, ω is frequency in radians, and εo is the permittivity of free space. Conductivity is measured in Siemens/meter; εr is dimensionless.
| (1) |
| (2) |
Calculations were performed to obtain values for the longitudinal conductivity, transverse conductivity, longitudinal relative permittivity, and transverse relative permittivity.
Data Analysis
Data are reported as mean ± standard error or standard deviation, as noted below. For two-group comparisons, t-tests were utilized. For comparisons of the material property parameters for all 4 groups, we performed a multivariate analysis of variance (MANOVA) supplemented by univariate ANOVA and post-hoc specific material properties differed significantly. Significance was identified at P < 0.05, two-tailed for all analyses, with relevant post-hoc corrections as noted below. Analyses were performed with SPSS 17.0 (IBM SPSS, Armonk, NY). In order to determine each group’s relative difference from normal animals, the Mahalanobis distance10 was also calculated from the mean of each diseased group to the mean of the normal group.
RESULTS
Male vs. female normal animal
Previous studies have not shown a significant difference between male and female animals, and we also found that the values were virtually identical for the female and male wild-type animals, with the smallest P-value (for longitudinal permittivity) being non-significant at 0.27. This result helps support that any observed differences are not related to any primary sexrelated differences in measurements, given the variety of animals being studied.
Individual conductivity and permittivity parameters
Figure 2 compares the longitudinal and transverse conductivities and permittivity values, and Table 1 provides the detailed related statistical results. Figure 3 provides scatter plots of the raw data (A and C) and plots of the group mean values ± 1 standard deviation (B and D) with the calculated Mahalanobis distance, providing a dimensionless measure of the deviation of each diseased group from the mean of the normal group. For both the conductivity and permittivity parameters, the Mahalanobis distance was greatest for the mdx group, followed by the ALS and HLU groups, respectively. There was a significant difference between the 4 groups based on the animal’s permittivity and conductivity data, F (12, 119) = 14.6, P < 0.001; Wilk lambda = 0.092. Given the significance of this overall analysis, the univariate main effects were examined via a separate one-way ANOVA for each material property, which also show significant differences between all 4 groups. Post-hoc Tukey tests confirmed that all groups are separable from one another based on individual parameters.
Figure 2.
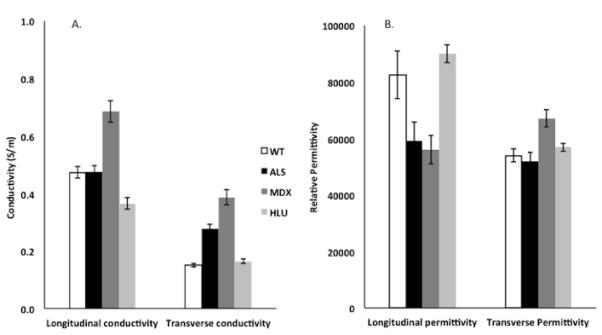
Column plots showing the individual conductivity and relative permittivity values (± standard error) for the 4 groups of animals studied: wild-type (normal), amyotrophic lateral sclerosis (ALS), muscular dystrophy (mdx), and hind limb unloaded (HLU). Conductivity values are expressed as S/m; relative permittivity values are dimensionless and are divided by 100,000 so that they can be compared more easily to the conductivity data. See Table 1 for associated statistical results.
Table 1. Overall results of individual conductivity and permittivity parameters.
| Wilk Lambda | F | DF | Error DF | P | |
|---|---|---|---|---|---|
|
| |||||
|
Overall
MANOVA |
0.092 | 14.6 | 12 | 119 | <0.001 |
|
| |||||
| F | DF1 | DF2 | P | ||
| ANOVAs | Long. Conductivity | 6.74 | 3 | 48 | <0.001 |
| Trans. Conductivity | 56.5 | 3 | 48 | <0.001 | |
| Long. Permittivity | 6.74 | 3 | 48 | <0.001 | |
| Trans. Permittivity | 5.97 | 3 | 48 | 0.002 | |
|
| |||||
| Post-Hoc Tukey Tests (P-values) | |||||
|
| |||||
| Normal | ALS | MDX | HLU | ||
| Longitudinal conductivity |
Normal | * | 1 | <0.001 | 0.007 |
| ALS | * | <0.001 | 0.009 | ||
| MDX | * | <0.001 | |||
| HLU | * | ||||
|
| |||||
| Normal | ALS | MDX | HLU | ||
| Transverse conductivity |
Normal | * | <0.001 | <0.001 | 0.846 |
| ALS | * | <0.001 | <0.001 | ||
| MDX | * | <0.001 | |||
| HLU | * | ||||
|
| |||||
| Normal | ALS | MDX | HLU | ||
| Longitudinal Permittivity |
Normal | * | 0.048 | 0.42 | 0.811 |
| ALS | * | 0.009 | 0.005 | ||
| MDX | * | 0.005 | |||
| HLU | * | ||||
|
| |||||
| Normal | ALS | MDX | HLU | ||
| Transverse permittivity |
Normal | * | 0.93 | 0.005 | 0.795 |
| ALS | * | 0.009 | 0.453 | ||
| MDX | * | 0.04 | |||
| HLU | * | ||||
Figure 3.
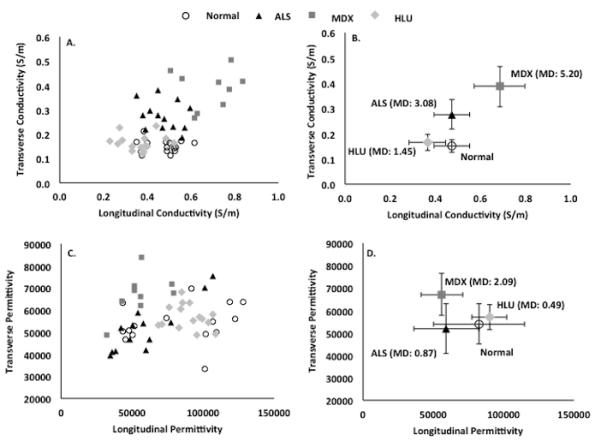
Scatterplots showing individual transverse vs. longitudinal (A.) conductivity and (C.) permittivity values for the 4 groups of animals. (B.) and (D.) provide the mean group (± SD) values as well as the Mahalanobis distance (MD), a dimensionless measure of the distance between the groups. Note the clustering into groups based on the conductivity data alone. The mdx animals show the greatest alterations as measured by the Mahalanobis distance.
The greatest conductivity was seen in the mdx group, with conductivity being increased relative to normal animals both in the transverse and longitudinal directions. The ALS group, in contrast, had increased conductivity only in the transverse direction but a nearly identical value in the longitudinal direction to that of the normal animals. For both mdx and ALS groups, the transverse permittivity was slightly greater than the normal animals, with the mdx animals showing the greatest deviation from normal. In contrast to the mdx and ALS muscle, the HLU muscle data were considerably closer to normal, having only a lower longitudinal conductivity and no significant differences in transverse conductivity or permittivity in either direction.
Directional dependence of current flow
As a measure of the directional dependence of current flow, anisotropy ratios were calculated for each individual muscle by dividing the longitudinal by transverse permittivity and conductivity values (Table 2 and Figure 4). A similar analysis was then performed for these composite values; again, the MANOVA was highly significant, as were the separate ANOVAs. Post-hoc tests confirmed the ability to distinguish between most of these animals. However, the data were not as strikingly separable as in the case of the raw conductivity and permittivity values; the likely reason for this is that by combining parameters, the random noise in the composite measure was increased. As can be seen in Table 2 and Figure 4, the anisotropy ratios are reduced in all diseased groups compared to the normal animals, with the effect being most prominent in the mdx and ALS animals.
Table 2. Anisotropic data results.
| Wilk Lambda |
F | DF | Error DF | P | |
|---|---|---|---|---|---|
|
| |||||
| Overall MANOVA |
0.367 | 10.2 | 6 | 94 | <0.001 |
|
| |||||
| F | DF1 | DF2 | P | ||
| ANOVAs | Conductivity anisotropy |
15.7 | 3 | 48 | <0.001 |
|
| |||||
| Permittivity anisotropy |
8.65 | 3 | 48 | <0.001 | |
| Post Hoc Tukey Tests (P-values) | |||||
| Normal | ALS | MDX | HLU | ||
| Conductivity anisotropy |
Normal | * | <0.001 | <0.001 | 0.001 |
| ALS | * | 0.999 | 0.171 | ||
| MDX | * | 0.311 | |||
| HLU | * | ||||
|
| |||||
| Normal | ALS | MDX | HLU | ||
| Permittivity anisotropy |
Normal | * | 0.040 | 0.001 | 0.995 |
| ALS | * | 0.421 | 0.022 | ||
| MDX | * | 0.001 | |||
| HLU | * | ||||
Figure 4.
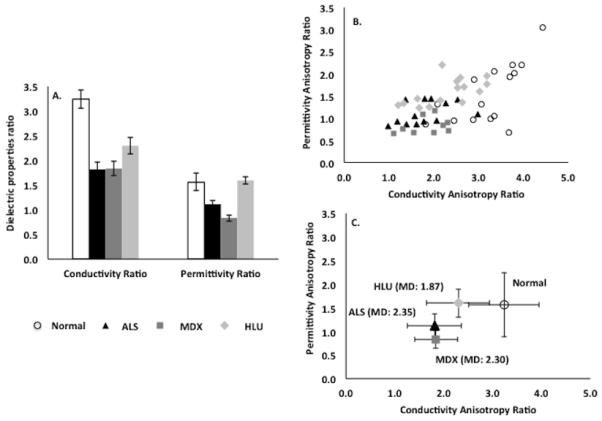
A. Column plot showing variations in the anisotropy ratios (longitudinal/transverse conductivity and permittivity values) for all 4 groups of mice. B. Scatterplot evaluating differentiation of groups based on the anisotropy ratios. C. Plot of group mean (± SD) values and Mahalanobis distance. While there is considerable scatter in the data, the mdx and ALS values again show the most altered anisotropy. See Table 2 for associated statistical results.
DISCUSSION
These results support the underlying hypothesis of this work, namely that the electrical material properties of diseased muscle differ from those of healthy muscle. Moreover, each disease type appears to have its own characteristic values, with myopathic and neurogenic disease varying further from normal than muscle affected by disuse. Perhaps it is not surprising that such fundamental differences were identified, especially considering how dissimilar the muscle pathology is in the conditions studied here.
The mechanisms underlying these distinctions are far from obvious. Of the diseased groups, mdx muscle demonstrates the most extreme changes, as it appears to be highly conductive in both fiber directions. One potential explanation for this is that mdx muscle has considerable additional connective tissue that is rich in collagen, which is highly conductive when hydrated.11 While a potentially compelling explanation, mdx animals aged 2 months, as studied here, have only a limited increase in connective tissue over normal animals12,13 and thus it is not clear how relevant this actually is. Thus, the increase in conductivity and permittivity relative to normal animals may also be related to primary cellular or other structural changes within the muscle. For example, both edema or muscle injury would be expected to increase conductivity, and this may offer one simple explanation. ALS muscle, in contrast, shows only a major increase in transverse conductivity, no significant difference in longitudinal conductivity, and only a borderline increase in longitudinal permittivity. The findings in the HLU muscle for all 3 parameters are more modest, the only 1 being significant for longitudinal conductivity, which is actually lower than that of wild-type muscle. One potential explanation is that simple atrophy and loss of fiber area reduces conductivity. Clearly, all of these interpretations are highly speculative, and additional studies into each one specifically would need to be pursued if we wished to achieve more meaningful mechanistic understanding of these observations.
The anisotropic changes we found both support and challenge findings that were previously noted using EIM performed with surface electrodes in humans.14 Specifically, we had previously found that muscle affected by primary myopathy lost some of its normal anisotropic character; this finding is consistent with that observed here in that the mdx muscle shows a substantial reduction in both conductivity and permittivity anisotropy. In that previous study, however, we also identified an increase in anisotropy in ALS muscle. Such a change was not observed here, suggesting that the previous observation may have represented a primarily geometric effect due to wasting/atrophy rather than an intrinsic alteration in the basic electrical material properties of the muscle.
Previous work15 has shown that by knowing the inherent electrical properties of muscle, and by application of the finite element method, it is possible to model the expected surface impedance values. However, the reverse is also possible. In other words, by measuring the surface impedance values and incorporating the overall shape and structure of the muscle via the finite element method, it is possible to approximate the inherent electrical material properties of the muscle via inverse modeling. This contrasts with this study where they were measured directly. Accordingly, it may ultimately be possible to obtain approximations for these values using surface impedance measurements rather than excised tissue.
There are a number of challenges to this study that need to be underscored. First, the data collection itself was difficult. While the transverse muscle data is relatively straightforward to obtain, collecting accurate longitudinal data is taxing and imperfect, since, strictly speaking, the muscle fiber should be aligned perfectly with the current emitting electrode plates at both ends. Given the very small size of tissue, the longitudinal values for both conductivity and permittivity are at best approximations. Other limitations of this work include the fact that mouse muscle is not always comparable to human muscle, especially when it is affected by neuromuscular disease. For example, older mdx mouse muscle has considerable connective tissue deposition but little intramuscular fat, a hallmark of the human disease.16 In addition, in ALS mouse muscle, like human muscle affected by ALS, there is marked muscle fiber loss and atrophy, but given the speed of disease progression and animal death, more chronic changes, such as fat and connective tissue deposition, do not occur. Although such findings are not considered a hallmark of muscle pathology in a primary neurogenic disease such as ALS, they are nevertheless present.17 Another major limitation of this work is the impossibility of standardizing animal lines and strains as well as sexes. We have attempted to mitigate this limitation by using only relatively young animals of similar age (i.e., we did not study more severely affected older mdx animals); we were also able to show that there was no significant difference between male and female controls. Nonetheless, subtler non-disease related differences may also be present, and these cannot be excluded conclusively as playing a role in some of these findings. Finally, only a single 50 kHz current frequency was studied; the data become far more complex if multiple frequencies are applied, but this could provide additional useful discriminative information.
There are several future directions to this work. First, it would be highly valuable to begin a concerted effort to start measuring impedance values from human neuromuscular disease tissue. Since only small pieces of tissue (e.g., 2.5mm3) are required for such an analysis, it is possible that human tissue could be analyzed at the time of muscle biopsy, and a library of values could be created. Second, we can attempt to identify differences in subcategories of disease, including different muscular dystrophies. Third, we can also assess changes in muscle with different severity of a single disease over time, with correlations with other values (e.g. connective tissue deposition or muscle fiber loss) and thus help to provide a more complete and accurate mechanistic picture.
To date, most applications of electrical impedance measurements to muscle have demanded a certain leap of faith that the data collected actually reflect ongoing changes within the muscle itself. In fact, EIM surface measurements likely reflect a combination of effects, including altered muscle material properties and alterations in overall muscle geometry (e.g., atrophy) with disease progression. Moreover, the effects of skin, subcutaneous adipose tissue, and bone will also impact the recorded surface measurements. However, the work presented here demonstrates conclusively that alterations in disease occur at the level of the muscle tissue itself and are not simply due only to volume loss or other geometric alterations alone. It is our hope that continued study of impedance characteristics of muscle in vivo and ex vivo may eventually lead to the development of a method of tissue characterization using surface-based impedance methods.
Acknowledgment
This study was funded in part by the National Institutes of Health R01 NS055099 and NASA grant NNX10AE39G. We wish to thank Kush Kapur, PhD for his helpful input regarding the statistical analyses and Acceleron Pharma for assisting with some of the data collection.
Abbreviations
- ALS
amyotrophic lateral sclerosis
- EIM
electrical impedance myography
- HLU
hind limb unloaded
- MD
Mahalanobis distance
- Mdx
muscular dystrophy
REFERENCES
- 1.Grimnes S, Martinsen OG. Bioimpedance and Bioelectricity Basics. Academic press; London: 2008. [Google Scholar]
- 2.Rutkove SB. Electrical Impedance Myography: Background, Current State, and Future Directions. Muscle Nerve. 2009;40:936–946. doi: 10.1002/mus.21362. [DOI] [PMC free article] [PubMed] [Google Scholar]
- 3.Rutkove SB, Caress JB, Cartwright MS, Burns TM, Warder J, David WS, Goyal N, Maragakis NJ, Clawson L, Benatar M, Usher S, Sharma KR, Gautam S, Narayanaswami P, Raynor EM, Watson ML, Shefner JM. Electrical impedance myography as a biomarker to assess ALS progression. Amyotrophic Lateral Sclerosis. 2012 doi: 10.3109/17482968.2012.688837. [DOI] [PMC free article] [PubMed] [Google Scholar]
- 4.Li J, Geisbush TR, Rosen GD, Lachey J, Mulivor A, Rutkove SB. Electrical impedance myography for the in and ex vivo assessment of muscular dystrophy (mdx) mouse muscle. Muscle Nerve. 2013 doi: 10.1002/mus.24086. in press. [DOI] [PMC free article] [PubMed] [Google Scholar]
- 5.Kortman HG, Wilder SC, Geisbush TR, Narayanaswami P, Rutkove SB. Age- and gender-associated differences in electrical impedance values of skeletal muscle. Physiol Meas. 2013;34(12):1611–1622. doi: 10.1088/0967-3334/34/12/1611. [DOI] [PMC free article] [PubMed] [Google Scholar]
- 6.Ahad MA, Fogerson PM, Rosen GD, Narayanswami P, Rutkove SB. Electrical characteristics of rat skeletal muscle in immaturity, adulthood, and after sciatic nerve injury and their relation to muscle fiber size. Physiol Meas. 2009;30:1415–1427. doi: 10.1088/0967-3334/30/12/009. [DOI] [PMC free article] [PubMed] [Google Scholar]
- 7.Riley D, Slocum G, Bain J, Sedlak F, Sowa T, Mellender J. Rat hindlimb unloading: soleus histochemistry, ultrastructure, and electromyography. J Appl Physiol. 1990;69:58–66. doi: 10.1152/jappl.1990.69.1.58. [DOI] [PubMed] [Google Scholar]
- 8.Sung M, Li J, Spieker AJ, Spatz J, Ellman R, Ferguson VL, Bateman TA, Rosen GD, Bouxsein M, Rutkove SB. Spaceflight and hind limb unloading induce similar changes in electrical impedance characteristics of mouse gastrocnemius muscle. J Musculoskelet Neuronal Interact. 2013;13(4):405–411. [PMC free article] [PubMed] [Google Scholar]
- 9.Li J, Staats WL, Spieker A, Sung M, Rutkove SB. A technique for performing electrical impedance myography in the mouse hind limb: data in normal and ALS SOD1 G93A animals. PLoS One. 2012;7(9):e45004. doi: 10.1371/journal.pone.0045004. [DOI] [PMC free article] [PubMed] [Google Scholar]
- 10.Furutani H, Kitazoe Y, Yamamoto K, Ogura H, Takeda Y, Sonobe H, Sasaki M. Evaluation of the “Mahalanobis’ generalized distance” method of quality control: monitoring system of multivariate data. American journal of clinical pathology. 1984;81(3):329–336. doi: 10.1093/ajcp/81.3.329. [DOI] [PubMed] [Google Scholar]
- 11.Bardelmeyer GH. Electrical conduction in hydrated collagen. I. Conductivity mechanisms. Biopolymers. 1973;12(10):2289–2302. doi: 10.1002/bip.1973.360121008. [DOI] [PubMed] [Google Scholar]
- 12.Goldspink G, Fernandes K, Williams PE, Wells DJ. Age-related changes in collagen gene expression in the muscles of mdx dystrophic and normal mice. Neuromuscul Disord. 1994;4(3):183–191. doi: 10.1016/0960-8966(94)90019-1. [DOI] [PubMed] [Google Scholar]
- 13.Louboutin JP, Fichter-Gagnepain V, Thaon E, Fardeau M. Morphometric analysis of mdx diaphragm muscle fibres. Comparison with hindlimb muscles. Neuromuscul Disord. 1993;3(5-6):463–469. doi: 10.1016/0960-8966(93)90098-5. [DOI] [PubMed] [Google Scholar]
- 14.Garmirian LP, Chin AB, Rutkove SB. Discriminating neurogenic from myopathic disease via measurement of muscle anisotropy. Muscle Nerve. 2009;39(1):16–24. doi: 10.1002/mus.21115. [DOI] [PMC free article] [PubMed] [Google Scholar]
- 15.Wang LL, Ahad M, McEwan A, Li J, Jafarpoor M, Rutkove SB. Assessment of alterations in the electrical impedance of muscle after experimental nerve injury via finite-element analysis. IEEE Trans Biomed Eng. 2011;58(6):1585–1591. doi: 10.1109/TBME.2011.2104957. [DOI] [PubMed] [Google Scholar]
- 16.Dunn JF, Zaim-Wadghiri Y. Quantitative magnetic resonance imaging of the mdx mouse model of Duchenne muscular dystrophy. Muscle Nerve. 1999;22(10):1367–1371. doi: 10.1002/(sici)1097-4598(199910)22:10<1367::aid-mus5>3.0.co;2-h. [DOI] [PubMed] [Google Scholar]
- 17.Achari AN, Anderson MS. Myopathic changes in amyotrophic lateral sclerosis. Pathologic analysis of muscle biopsy changes in 111 cases. Neurology. 1974;24(5):477–481. doi: 10.1212/wnl.24.5.477. [DOI] [PubMed] [Google Scholar]