Abstract
Purpose
To compute cohort-averaged wall shear stress (WSS) maps in the thoracic aorta of patients with aortic dilatation or valvular stenosis and to detect abnormal regional WSS.
Methods
Systolic WSS vectors, estimated from 4D flow MRI data, were calculated along the thoracic aorta lumen in 10 controls, 10 patients with dilated aortas and 10 patients with aortic valve stenosis. 3D segmentations of each aorta were co-registered by group and used to create a cohort-specific aortic geometry. The WSS vectors of each subject were interpolated onto the corresponding cohort-specific geometry to create cohort-averaged WSS maps. A Wilcoxon rank sum test was used to generate aortic P-value maps (P<0.05) representing regional relative WSS differences between groups.
Results
Cohort-averaged systolic WSS maps and P-value maps were successfully created for all cohorts and comparisons. The dilation cohort showed significantly lower WSS on 7% of the ascending aorta surface, whereas the stenosis cohort showed significantly higher WSS aorta on 34% the ascending aorta surface.
Conclusions
The findings of this study demonstrated the feasibility of generating cohort-averaged WSS maps for the visualization and identification of regionally altered WSS in the presence of disease, as compared to healthy controls.
Keywords: wall shear stress, aorta, dilation, valve stenosis
INTRODUCTION
Clinical management of aortopathy employs anatomical and hemodynamic measurements, such as aortic diameter and peak transvalvular blood velocity. In the presence of aortic dilation or aortic valve disease (AVD), these parameters are simple to acquire, yet have limited predictive ability to identify subjects who may experience progressive aortic enlargement, dissection, or rupture (1-3). Current guidelines focus on consensus-based thresholds for aortic diameter (4,5), and are known to lead to divergent outcomes in similarly classified patients in terms of symptom status, cardiovascular events or aortic valve replacement (6-8). Furthermore, changes in aortic geometry are often detected late in the disease process and management does not consider the underlying markers suspected to drive wall remodeling and progressive aortic dilatation. This is an important consideration given recent longitudinal studies finding independent associations between hemodynamic markers and aortopathy (9,10). In this context, wall shear stress (WSS), the tangential force exerted by blood flow on the vessel wall (11), may be a promising prognostic marker associated with the expression of transcriptional factors responsible for extracellular matrix degradation and vascular smooth muscle cell apoptosis (12-14).
In the last decade, considerable progress has been made regarding the estimation of WSS. The development of 4D flow MRI (time-resolved three-dimensional (3D) phase contrast MRI with three-directional velocity encoding) (15-17) with full volumetric coverage of the thoracic aorta has made the assessment of in vivo WSS a reality (18-27). Nonetheless, a number of challenges remain to determine if abnormal WSS presents a definitive risk for adverse aortic remodeling in a large, well-controlled population based study. The current challenges include the complexity of measuring WSS along the entire aortic surface, a lack of established baseline WSS values (for healthy individuals), spatial resolution effects, and the ability to consistently identify and describe aortic locations with abnormal WSS. As a consequence, there is currently no standardized method for comparing 3D aortic WSS between individuals and patient cohorts.
In this study, we present a novel methodology capable of quantifying 3D WSS over the entire aorta lumen surface and thereby provide a method to derive cohort-averaged 3D WSS vector maps. The technique allows for compact visualization of 3D WSS assessed across multiple subjects and enables a quantitative comparison of the 3D WSS environment on the surface of the vessel between cohort groups. The goal of this study is to present the methodology and test the hypothesis that the technique can statistically compare regional 3D WSS differences as expressed on the entire vessel surface between patient groups according to the nature of the aortic disease.
METHODS
Study Cohort
30 subjects were retrospectively enrolled according to the following subgroup criteria: 1) 10 age appropriate healthy control subjects (59±10 years) with no history of cardiovascular disease, normal aortic valve function and normal thoracic aortic geometry, 2) 10 patients with normal aortic valve function and aortic dilation (59±12 years) and 3) 10 patients determined to have ‘moderate’ to ‘severe’ aortic stenosis and concomitant aortic dilation (65±14 years, referred to as the ‘stenosis’ cohort). Patients were excluded if Marfan syndrome or Ehlers-Danlos syndrome was present. All subjects had trileaflet aortic valve morphology. Aortic dilation was defined as a sinus of valsalva (SOV) or mid-ascending aorta (MAA) diameter > 4.0 cm. Aortic stenosis was graded according to the absolute systolic peak velocities at the level of the aortic valve, as is recommended for continuous wave Doppler ultrasound guidelines (moderate stenosis: between 3-4 m/s, severe stenosis: greater than 4 m/s) (4). Aortic insufficiency (AI) was graded as mild, moderate or severe according to a regurgitant fraction <30%, between 30-49%, of > 50% respectively (4).
Subject demographics are summarized in Table 1. The study was approved by the local Institutional Review Board (IRB). 9 controls, 2 patients with aortic dilation and 2 patients with aortic valve stenosis provided informed consent. The remaining subjects were enrolled using an IRB approved protocol permitting retrospective chart review.
Table 1.
Population demographics. Differences across cohorts were evaluated using the Kruskal-Wallis test.
| Normal Controls | Patients with Aortic Dilation | Patients with Aortic Stenosis | P-value | ||
|---|---|---|---|---|---|
| N (female) | 10 (2) | 10 (3) | 10 (1) | ||
| Age (mean ± SD) | 59±10 | 59±12 | 65±14 | 0.41 | |
| SOV diameter (cm) | 3.1±0.4 | 4.1±0.6 | 4.0±0.4 | <0.001 | |
| MAA diameter (cm) | 3.2±0.2 | 3.9±0.5 | 4.2±0.3 | <0.001 | |
| Spatial resolution (mm3) |
16.6±4.1 | 18.7±1.3 | 18.9±3.27 | 0.25 | |
| VENC (cm/s) | 150±0 | 170±42 | 265±118 | <0.05 | |
| Aortic Stenosis | N/A | None | Moderate | 9 | |
| Severe | 1 | ||||
| Aortic Insufficiency | N/A | None | None | 2 | |
| Mild | 4 | ||||
| Moderate | 3 | ||||
| Severe | 1 | ||||
SOV = Sinus of Valsalva, MAA = Mid-ascending Aorta
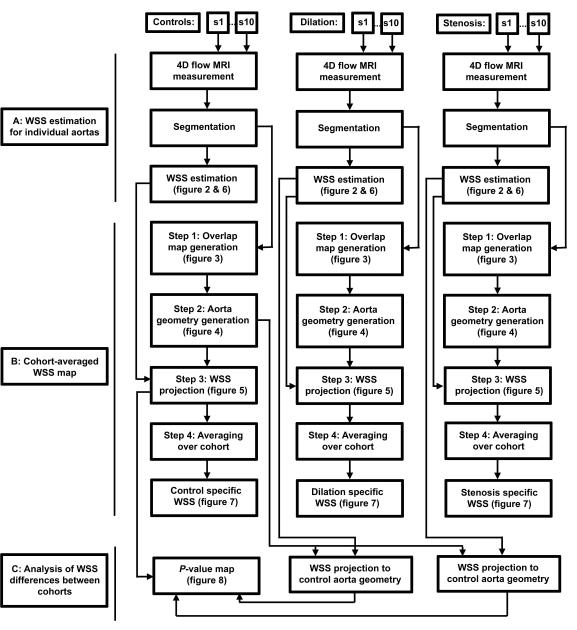
In figure 1, a schematic overview of the data analysis workflow is displayed.
Figure 1.
A schematic overview of the data analysis workflow. A: For all subjects (s1-s10) of each cohort, 4D flow MRI data was used to calculate the 3D WSS distribution along the aorta surface resulting in 10 individual 3D WSS maps for each cohort. B: For each cohort, the 10 WSS maps were co-registered to create a cohort-averaged 3D WSS map. C: WSS estimation was projected onto the control aorta geometry allowing for statistical comparison between groups.
MR Imaging
4D flow MRI measurements were carried out on 1.5 and 3T scanners (Espree, Avanto, Skyra, Aera, Siemens, Erlangen, Germany). All patients underwent a standard-of-care thoracic cardiovascular MRI including ECG gated time-resolved (CINE) cardiac MRI for the evaluation of cardiac function and valve morphology as well as contrast enhanced MR angiography for the quantification of aortic dimensions. For valve imaging, a 2D imaging plane was carefully positioned orthogonal to the aortic root at the level of the aortic valve. In addition, 4D flow MRI of the thoracic aorta was performed in a sagittal oblique volume using prospective ECG gating and free-breathing with a respiratory navigator placed on the lung-liver interface (28). 4D flow pulse sequence parameters were as follows: spatial resolution = 1.7-3.6 × 1.8–2.4 × 2.2–3.0mm3, temporal resolution = 37–42ms (14-25 cardiac time frames); TE/TR/flip angle = 2.2-2.8ms / 4.6-5.3ms / 7-15 °, field of view = 144–380 × 120–285 × 67–116mm3, velocity sensitivity = 150cm/s, 150–250cm/s, 150–450cm/s for the healthy controls, patients with aortic dilation and patients with aortic stenosis, respectively (manually specified by the technologist to minimize velocity aliasing).
Data analysis
4D flow MRI measurements were corrected for eddy currents, Maxwell terms and velocity aliasing using home built software programmed in Matlab (Natick, The Mathworks, USA) as described previously (29). Voxels with persistent velocity aliasing were manually corrected. 3D Phase contrast (PC) magnetic resonance angiography (MRA) data were created by voxel-wise multiplication of the magnitude data with absolute velocities averaged over all cardiac time frames (29). The 3D PC-MRA images were semi-automatically segmented using a commercial software package (MIMICS, Materialise, Leuven, Belgium). To obtain a smooth surface of the aortic wall, the segmentation was smoothed using a Laplacian filter (30). Peak systole was defined as the cardiac time frame with the highest average aortic velocity.
Cohort specific aortic geometry and WSS maps
The data analysis workflow for 3D WSS estimation, the calculation of cohort specific aortic geometry and WSS maps, and for the quantification of inter-cohort differences is illustrated in figure 1. All analysis was performed in Matlab (The Mathworks, Natick, MA, USA). Visualization of the results was partially performed using commercial software (Ensight, CEI Inc, Apex, NC, USA).
A: 3D WSS estimation for individual aortas
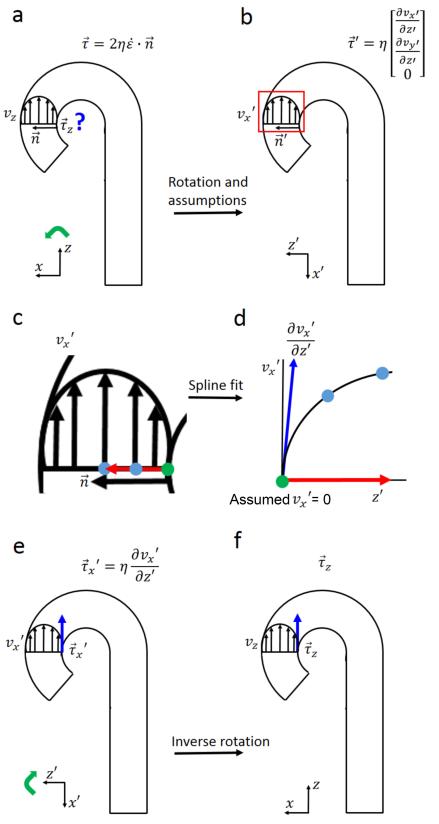
As summarized in figure 2, WSS vectors were calculated by:
| (1) |
where is the WSS vector, η is the dynamic viscosity (Newtonian: 3.2•10−3 Pa•s), is the rate of deformation tensor and is the normal vector orthogonal to the vessel wall (figure 2a).
Figure 2.
Schematic display of WSS estimation in the aorta. a-b: The original coordinate system was rotated (indicated by the green arrow) to an alternate coordinate such that the z-axis aligned with the original normal vector. No flow occurs through the vessel wall ( = 0), thus the equation in (a) can be approximated by the equation in (b). c-d: A spline was fitted through the 3 velocity values (1 green dot, 2 blue dots) on the inward normal with a length of 1.5 cm (red arrow). d-e: The derivative of the spline fit at the vessel wall is proportional to WSS in x’ direction. E-f: Inverse rotation (green arrow) resulted in the WSS vector of interest.
By rotating the coordinate system such that the z-axis aligns with the normal vector of the vessel wall (figure 2b) it holds that: = (0,0,1). Since no flow occurs through the wall ( = 0 at the wall), the inner product of the rate of deformation tensor and the normal vector is reduced to:
| (2) |
where the shear rates and are the spatial velocity gradients at the wall in the rotated coordinate system. The rotated WSS vector is then defined as:
| (3) |
The shear rates were derived from 1D smoothing splines (31) fitted through the rotated x- and y-velocity values along the inward normal vector (32). The WSS vector was transformed to the original coordinate system by inverse rotation. WSS was averaged over five cardiac time frames centered at peak systole to reduce noise. Systole was considered as it is the most hemodynamically active portion of the cardiac cycle. A previous study showed that important differences in hemodynamic behavior were diluted when the diastolic period was included (33).
B: Cohort-averaged WSS map
A cohort-specific aorta WSS map was created using the following three-step process: 1) the individual aorta 3D segmentations from each cohort were rigidly co-registered and a map quantifying the amount of shared geometry was generated (i.e. an ‘overlap’ map) , 2) the maximal overlap was used to create a cohort-specific, idealized aorta geometry, 3) the individual 3D WSS vectors were projected onto the cohort-specific aorta geometry and a 3D WSS map representative of the entire cohort was calculated.
1) Rigid co-registration & generation of the overlap map
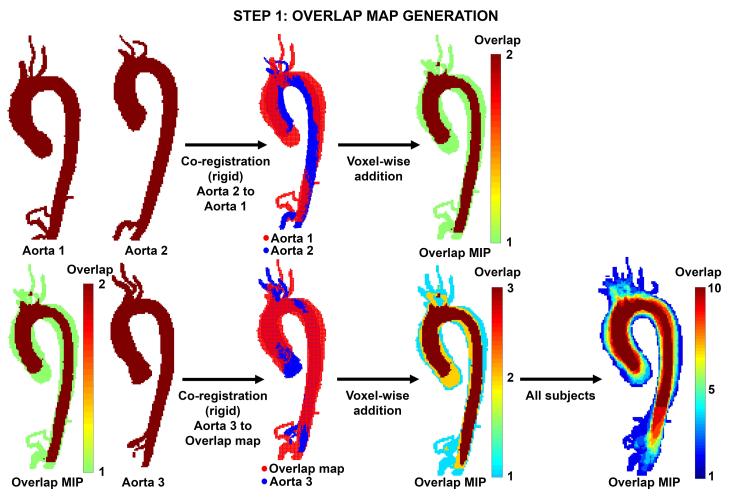
As shown in figure 3 (top row), two aortic 3D segmentations were rigidly co-registered (6 degrees of freedom) using FMRIB’s Linear Image Registration Tool (FLIRT)(34). To create the initial overlap map, two aortic segmentations were summed in a voxel-wise fashion, and volume containing either a ‘1′ (no overlap) or ‘2′ (both aortas overlap) was created. Next, a third aorta was co-registered and the overlap map was calculated to yield values ranging from 1 to 3 (1: no overlap, 2: two aortas overlap, and 3: three aortas overlap, figure 3 lower row). This process was continued for all 10 subjects in each cohort such that the final map included values representing the amount of geometry shared by each segments, ranging from an overlap value of 1 to 10. Two sequence orders for aorta registration were used to test for reproducibility of the overlap map creation. This process can be expressed as:
| (4) |
| (5) |
Figure 3.
Step-wise rigid co-registration & calculation of overlap. Top row: Co-registration of two aortic geometries (aorta 1 and aorta 2). The resulting overlap map is visualized as a maximum intensity projection (MIP). Bottom row: A third aorta (aorta 3) is co-registered and the overlap map is updated. After inclusion of all 10 subjects, a final overlap map is created with values ranging from 1 to 10.
2) Identification of the cohort-specific, idealized aorta geometry
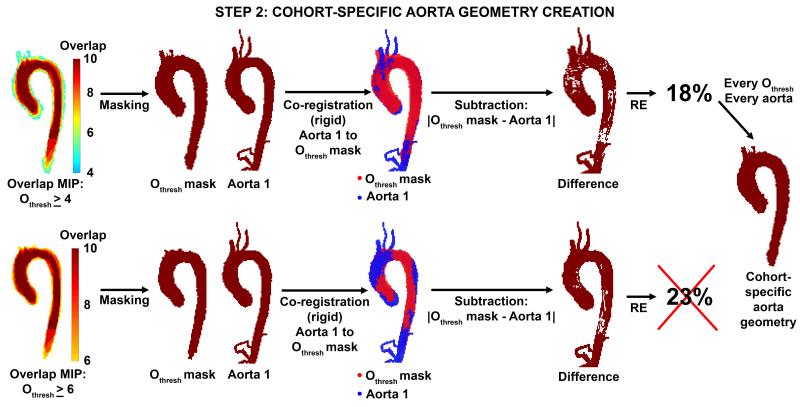
For each subject, the original aorta 3D segmentation was co-registered to multiple potential cohort-specific aorta geometries as defined by overlap thresholds (Othresh) ranging from 1≤Othresh <10. Each Othresh defined a potential cohort-specific aorta geometry with at least n=Othresh overlapping aorta regions (Othresh map). Each aorta in the cohort was then rigidly co-registered to the threshold Othresh map and an individual registration error (RE, relative number of voxels not shared by the aorta and Othresh map) was calculated as:
| (6) |
where N∣Othresh–Aorta∣ is the number of voxels not shared between the overlap map and the individual aorta, NOthresh the number of voxels of the Othresh map and NAorta the number of voxels of the individual aorta. Finally, the Othresh map with the lowest RE averaged over all aortas in the cohort was chosen as the cohort-specific aorta geometry. Figure 4 illustrates the optimization process for examples with Othresh ≥ 4 and Othresh ≥ 6.
Figure 4.
Identification of the optimal cohort-specific aorta geometry. For different overlap thresholds Othresh ≥ 4 (top row) and Othresh ≥ 6 (lower row), aorta 1 was registered to the Othresh mask to determine the registration error (RE). The RE for Othresh ≥ 4 was lower than the RE for Othresh ≥ 6 and was therefore preferred. This step was repeated for all aortas in each cohort.
3) Cohort-specific 3D WSS maps
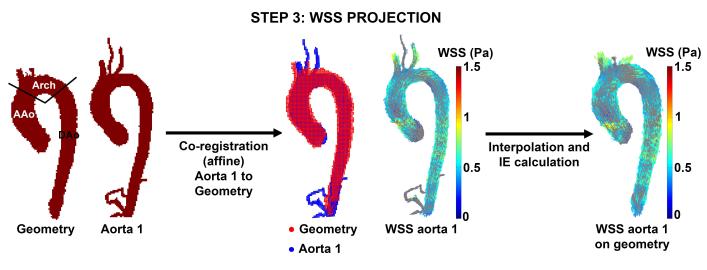
To project the 3D WSS vectors onto the final cohort specific aortic geometry, affine registration (FLIRT, 12 degrees of freedom) was used, followed by nearest neighbor interpolation of the 3D WSS vectors (figure 5). To investigate the influence of the interpolation process, each individual aorta and the cohort-specific aorta geometry were separated into 3 regions: ascending aorta (AAo), aortic arch (Arch) and descending aorta (DAo) as shown in figure 5. The interpolation error (IE) was defined as the relative difference between the mean WSS magnitude of the cohort-averaged aorta geometry and the individual aorta:
| (7) |
Figure 5.
WSS projection. Aorta 1 was registered to the cohort-specific aorta geometry. The WSS vectors on aorta 1 were subsequently interpolated to the aorta geometry and the interpolation error was calculated in the ascending aorta (AAo), aortic arch (Arch) and descending aorta (DAo). This step was repeated for each aorta in the cohort.
4) Averaging over cohort
Finally, cohort-averaged 3D WSS vector maps as well as standard deviation (SD) maps reflecting inter-individual differences in WSS magnitude were calculated for each of the three cohorts.
C: Analysis of WSS differences between cohorts
To enable comparison between cohorts, the 3D WSS vectors of the dilation and stenosis cohort were interpolated (nearest neighbor interpolation, see figure 5) to the aorta geometry of the control cohort. For this process the registration error and interpolation error were calculated.
To test the dependence of the comparison between cohorts on the choice of aorta geometry for comparison between cohorts, the subjects in the control cohort were registered and interpolated to the aorta geometry of the dilation cohort.
Statistical Analysis
A Kruskal-Wallis test was used to evaluate differences in age, aortic diameter and interpolation error between cohorts. A Wilcoxon rank sum test was used to assess if differences existed due to the sequence of the aorta registration for the overlap map creation. To identify regional differences in WSS magnitude between two cohorts, a Wilcoxon rank sum test was performed for each location on the control aorta geometry, resulting in a P-value map. Differences were considered statistically significant if P<0.05. The resulting P-values were mapped onto the aorta geometry of the control cohort to create aorta P-value maps in order to visualize significant regional differences of WSS magnitude between cohorts. To test for reproducibility, a P-value map with a Wilcoxon rank sum test was created of the individual controls registered and interpolated to the aortic geometry of the dilations.
A Wilcoxon rank sum test was performed to investigate differences between the SOV and MAA diameter of the dilation and stenosis cohort.
RESULTS
A: 3D WSS estimation for individual aortas
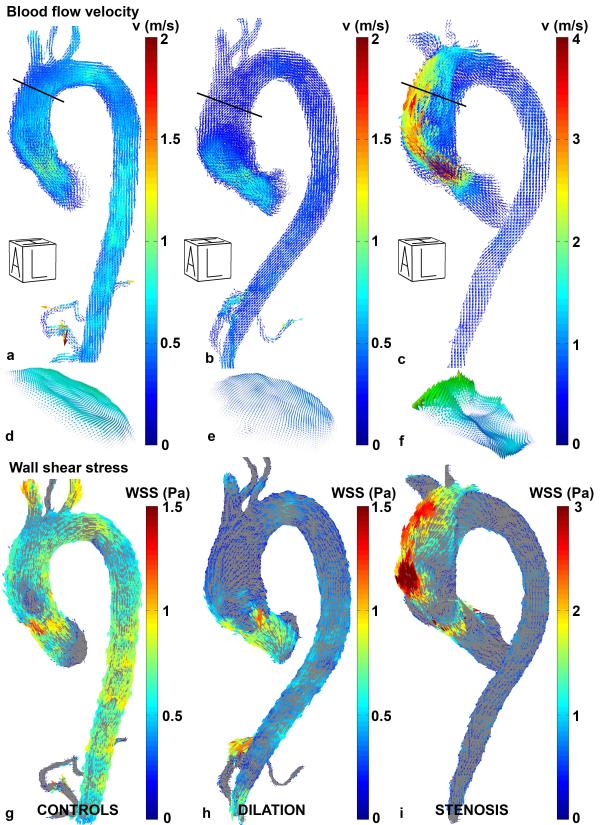
In figure 6, examples of measured systolic blood flow velocities and derived 3D WSS maps for an individual aorta from each cohort are shown. The velocities along the outer curvature of the ascending aorta of the patient with valve stenosis (figure 6c) were higher compared to both the control (figure 6a) and the dilated aorta (figure 6b). As a result, differences in regional velocity profiles, (e.g. in the distal ascending aorta in figure 6d-f) resulted in altered velocity gradients at the wall in patients with aortic valve stenosis. This elevated velocity gradient resulted in regionally increased WSS magnitude for the aorta with valve stenosis (figure 6i) compared to the control (figure 6g) and dilated aorta (figure 6h).
Figure 6.
Left-anterior oblique views of velocity vectors in a typical control aorta (a), dilated aorta (b) and aorta with severe valve stenosis (c). The black lines indicate the location of the planes for which the velocity profiles are shown in (d), (e) and (f). Note that for visualization purposes, the velocity color bar for the aorta with valve stenosis is two times higher than for the other two aortas. Figures (g), (h) and (i) show the 3D WSS pattern in the left-anterior oblique view for the control, dilated and aorta with valve stenosis. Also note that for visualization purposes, the WSS color bar for the aorta with valve stenosis is two times higher than for the other two aortas. A = Anterior, L = Left, H = Head.
B: Cohort-averaged WSS map
Cohort-specific aorta geometry
For all three cohorts, aorta geometries were successfully created and an overlap threshold, Othresh ≥ 4 (i.e. an overlap of 4 or more aorta regions) showed a minimum RE of 23 ± 3.0%, 20 ± 4.7% and 23 ± 9.3% for the control, dilation and stenosis cohort, respectively. For the creation of the cohort-specific aorta geometries, a consecutive registration sequence starting at 1 to 10 aortas was used. When the random sequence was applied, minimum RE of 23 ± 4.0%, 20 ± 4.8% and 23 ± 8.9%. The differences between the consecutive and random registration errors were not significant for all cohorts (P=0.70, P=0.94 and P=0.91 for the control, dilation and stenosis cohorts, respectively).
Cohort-specific 3D WSS maps
The mean interpolation error in the control cohort was 3.2 ± 3.0%, 2.2 ± 1.3% and 4.7 ± 6.4% for the AAo, the Arch and the DAo, respectively. For patients with aortic dilation, the IE was 1.8 ± 1.2%, 2.9 ± 1.8% and 4.7 ± 4.2% for the AAo, the Arch and the DAo, respectively. For the stenosis cohort, the IE was 4.1 ± 2.8%, 3.6 ± 4.2% and 1.4 ± 0.8%. The difference in IE between cohorts was not statistically significant (Kruskal-Wallis).
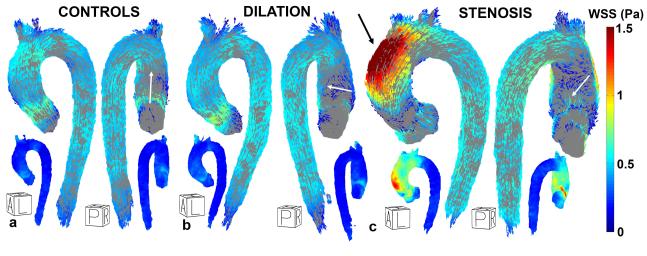
Figures 7a, b and c display a left-anterior oblique and posterior view of the cohort-averaged 3D WSS maps for healthy controls, patients with dilated aortas and aortic valve stenosis. The SD maps show that WSS values varied substantially between subjects in the AAo of the stenosis cohort, as compared to the SD maps of the controls and patients with aortic dilation which showed smaller inter-subject WSS variability.
Figure 7.
Left-anterior oblique and posterior view of the cohort-specific 3D WSS map for healthy controls (a), dilated aortas (b) and aortas with valve stenosis (c). The small inserts show the SD maps. The average regional WSS direction on the inner curvature of the AAo is shown by white arrows. The black arrow in (c) indicates elevated WSS at the outer curvature of the AAo. A = Anterior, P = Posterior, L = Left, R = Right, H = Head.
C: Analysis of WSS differences between cohorts
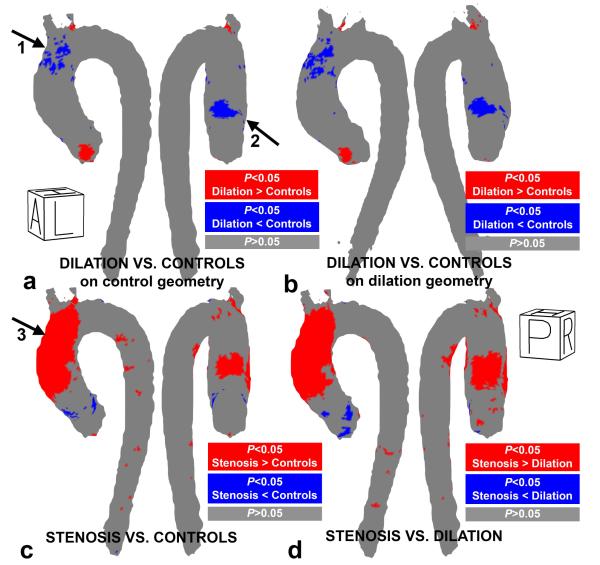
The cumulative results of the inter-group comparison of aortic WSS are summarized in figure 8 and table 2. P-value maps for the inter-group comparisons in figure 8a show that WSS in patients with aortic dilation was significantly reduced in the distal outer curvature (arrow 1) and proximal inner curvature (arrow 2) of the ascending aorta compared to controls (significantly lower WSS in 7% of all AAo voxels, see table 1). For registration and interpolation to the dilation geometry, the location and extent of regions with significant differences in WSS between cohorts were similar when compared to interpolation on the control geometry, see figure 8a and b.
Figure 8.
P-value maps of regional WSS differences in (a) the patients with aortic dilation vs. controls on the control geometry, (b) the patients with aortic dilation vs. controls on the dilation geometry (c) patients with aortic stenosis vs. controls and (d) patients with aortic stenosis vs. aortic dilation. Significant differences (Wilcoxon rank sum test, p<0.05) are color coded in blue and red.
Table 2.
The percentage of the area in the three regions where the difference was significant: +/− indicates higher/lower than controls (column 1&2) or dilation (column 3).
| Dilations vs. controls |
Stenosis vs. controls |
Stenosis vs. dilation |
|
|---|---|---|---|
| Percentage significant difference +/− AAo (%) | 2 / 7 | 34 / 2 | 41 /2 |
| Percentage significant difference +/− Arch (%) | 1 /2 | 18 / 0 | 20 / 0 |
| Percentage significant difference +/− DAo (%) | 0 / 0 | 3 / 0 | 4 / 0 |
AAo = Ascending Aorta, Arch = Aortic Arch, DAo = Descending Aorta, SD = Standard Deviation
In contrast, WSS was significantly elevated in almost the entire outer AAo curvature and a fraction of the inner AAo (34% of AAo voxels, see table 1) for patients with aortic stenosis compared to the controls (figure 8b, arrow 3). In similar regions, WSS was significantly elevated for patients with aortic stenosis as compared to the aortic dilatation subjects (41% and 20% of AAo and arch voxels, respectively, figure 8c and table 2).
The registration errors for the affine registration to the aorta geometry of the control cohort were similar in scale to the registration errors for the cohort-specific idealized geometry: 18±1% for the controls, 19±5% for the dilations and 22±4.7%. The interpolation errors for the interpolation of the dilation cohort to the aorta geometry of the control cohort were similar to the interpolation error to the cohort-specific geometry: 2.7±2.6%, 2.4±1.6% and 4.0±4.9% for the AAo, arch and DAo, respectively. For the stenosis cohort, the interpolation errors were similar for the AAo and arch, but higher for the DAo: 4.2±2.0%, 3.1±3.0% and 8.4±6.8%.
DISCUSSION
The use of cohort-averaged 3D WSS maps derived from healthy or patient cohorts has the potential to serve as a means to compare individual patient measurements with reference norms, or to compare measurements at specific anatomic locations between groups of subjects. This methodology is an improvement over previous methods which have used 4D flow-derived WSS at regions limited to manually positioned 2D analysis planes (18-22,24-27,36). In contrast to the single slice approach, the strategy presented here creates a comprehensive cohort-averaged 3D WSS map covering the thoracic aorta, which allows for the visualization of regional WSS variations between healthy and disease cohorts. The methods described here can be modified to function with maps of other biomarkers, such as regional diameter, oscillatory shear index, velocity vector magnitude/direction, helicity/vorticity (37), or blood residence times. Furthermore, the comparison of single subject measurements with the accompanying cohort-averaged maps is possible. The possibility exists to use the method to form a type of ‘aortic atlas’, allowing for the determination of whether (and where) a single subject expresses an abnormal biomarker, as defined by confidence intervals created from a large population control group.
The finding of significantly lower WSS in the dilated AAo group as compared to the healthy control group is in good agreement with previously published results (23,25). In contrast, patients with aortic valve stenosis exhibited significantly elevated WSS magnitude in the AAo compared to the healthy controls. Previous studies have speculated that this may occur (38), and this has been shown in cases with bicuspid aortic valve (26), but to our knowledge, this is the first study to demonstrate the extent and regional involvement of elevated WSS in patients with tricuspid stenotic valves. By means of the P-value maps, the location of significantly altered WSS for the disease groups is easily visualized (Figure 8). It is known that WSS estimates can vary substantially between studies due to methodological choices, including variables such as viscosity, spatial resolution and velocity fitting techniques (39). Therefore, WSS differences between cohorts are emphasized by the use of P-value maps, rather than absolute WSS values. Noticeably, WSS values for 40% of the ascending aorta surface in patients with aortic dilation were significantly different as compared to subjects with aortic valve stenosis. This was despite similar sinus of Valsalva (4.1 ± 0.6 cm vs. 4.0 ± 0.4 cm, P=0.38, Wilcoxon rank sum test) and mid-ascending aorta (4.0 ± 0.4 cm vs. 4.2 ± 0.3 cm, P=0.17, Wilcoxon rank sum test) diameters for both cohorts. Furthermore, inter-cohort differences in WSS direction were readily apparent. The deviation in WSS direction was highest in the AAo for the stenosis cohort, as compared to the healthy controls. These findings illustrate the complex nature of hemodynamic changes that are associated with aortopathy and that simple metrics such as aortic diameter do not directly correlate with the underlying physiologic changes in blood flow or WSS. In this context, the proposed concept of creating cohort-averaged maps has the potential to provide a better understanding of the role hemodynamic forces may play when considering endothelial cell dysfunction, and thus, potential risk for aortic remodeling (40).
The primary motivation for the development of the cohort-averaged maps is to better understand what constitutes normal and abnormal parameter ranges, and to identify if a single individual exhibits values within or outside these cohort-averaged ranges. For example, past studies have used cohort-averaged values to detect differences in WSS (23,25,26,33); however these studies have primarily investigated WSS at 2D slice locations or on regionally averaged surfaces. Thus, it is possible to miss regional variations in WSS if the 2D slice was placed elsewhere, or if the regional surface average did not constitute the complete abnormal region.
Based on the technique proposed here, abnormal WSS in a single subject (rather than cohort averaged values) may be detected at a singular surface location with coverage over the entire thoracic aorta lumen. Regional outliers (i.e. the abnormal WSS) are detectable by comparing WSS measurements in an individual patient to the mean and standard deviation WSS map for a healthy age/sex-matched WSS group. Abnormal WSS may be found by simply identifying regional deviations from the map by 2 standard deviations. Future studies with larger cohorts and appropriate control groups (matched for age, sex, aortic size etc.) are warranted to use this technique to investigate the association of abnormal WSS with risk for aortopathy development (41). Ultimately, with a sufficient number of subjects (and thus sufficient statistical power) cohort-specific WSS atlases could be created. In addition, aortic tissue resected during aortic graft procedures may also be evaluated to investigate the correlation between abnormal WSS behavior (determined by the cohort-averaged WSS map) and molecular expression of biomarkers postulated to be associated with aortic remodeling (42).
It is important to emphasize that many studies investigating WSS, including those from our group, have been based on a limited number of manually placed 2D planes in the thoracic aorta (18-22,24-27,36). The WSS algorithm used in this study replaces the need for manual slice placement with a 3D segmentation step based on the systolic portion of the cardiac cycle. We have previously shown that WSS differences exist during the systolic portion of the cardiac cycle, whereas WSS in the diastolic portion is less active (33). This new methodology provides the opportunity to obtain a systolic WSS calculation over the entire thoracic aortic lumen, which reduces manual interaction to a single segmentation step and allows for comparisons of the entire aorta surface between cohorts. As a result, a comprehensive yet compact visualization of complex WSS patterns in multiple cohort-specific subjects is obtained, and, WSS differences between patient groups can be easily interpreted, visualized, and quantified. In the future, these features may be beneficial for studies investigating risk stratification in patients with aortopathy and/or AVD.
Study Limitations
A possible limitation of the study is the registration error of 20% found for the registration of the individual aortas to the cohort-specific aorta geometries or to the aorta geometry of the control cohort. This error metric was chosen to illustrate the differences of each individual aorta shape with the cohort-averaged geometry, and is designed to include every single voxel of the aortas. Even for very similar aortas this error metric is can generate large values. An important contribution to the error is the start and end-point of each individual aorta. Not all aortas show the same signal enhancement in the left ventricle or the distal descending aorta. Therefore, the start and end-point of the aorta segmentations is moderately variable. Furthermore, the location and length of the supra-aortic arteries and celiac trunk are different for each subject, contributing to the error. The main contributor to the error, however, are small differences in aortic cross-section which cause substantial differences. This can be illustrated by eroding a specific 3D aorta segmentation by 1 voxel, which leads to a registration error of 40% with the same aorta. Therefore, it is quite remarkable that registration of different aortas with different diameters, supra-aortic arteries and the celiac trunk lead to a registration error of only 20%. Note also that the percentage of the difference is determined by the average number of voxels between the individual aorta and the cohort-specific geometry (equation 4). An alternate error metric, the percentage defined by the total number of voxels (individual aorta+cohort-specific geometry), would result in a reduced error of 11±2%, 11±3% and 13±5% for the control, dilation and stenosis cohort, respectively.
Interpolation of the 3D WSS vectors from the individual aorta shape to the cohort-specific aorta geometry can introduce errors. However, it was found that the error was much smaller than the errors reported for registration: up to 5% for interpolation compared to 25% for registration. Therefore, the interpolation step is robust.
The aorta geometry used to create P-value maps can introduce errors in the comparison between cohorts. In this study, minor differences were found by comparing 3D WSS of the control and dilation cohorts on the control geometry and the dilation geometry. Therefore, the statistical results are largely independent of the reference geometry.
Another limitation of the study is the lack of a comparison of 3D WSS with previously used WSS algorithms calculated in 2D slices, manually placed perpendicular to the aorta (18-22,24-27,36). Such a comparison was outside the scope of the study, as the goal of this study is to describe the methodology and show the use of creating cohort-averaged 3D WSS maps. Previous studies have shown that both planar (18,24) and volumetric (32) WSS analysis can be sensitive to differences in resolution and vessel lumen definition. A systematic evaluation of both planar and volumetric WSS analysis is thus warranted to better understand the performance of both techniques. Comparison of the 3D WSS algorithm with previously developed WSS algorithms (based on 2D slice placement) is part of ongoing work.
It is possible that WSS calculations are influenced by displacement artifacts (43) in the 4D flow MRI data related to rapid accelerations of blood flow, mainly present in the stenosis cohort. This implicates that the absolute WSS values calculated may be subject to error. By reporting relative WSS differences between different cohorts, errors in absolute WSS were minimized. Furthermore, it was demonstrated that the algorithm used for 3D WSS calculation based on spline fitting is robust in the presence of complex flow (44).
WSS underestimation as a function of resolution has been carefully studied and quantified (18,39). In aorta phantoms with perfect parabolic flow and a spatial resolution as used in this study, an underestimation in WSS of 5% of the theoretical value was found (32). Segmentation errors, however, could result in errors up to 30% of the theoretical WSS values. Therefore, future work will elaborate on inter-observer variability of WSS due to segmentation of aortic lumen. Nonetheless, computational fluid dynamics have demonstrated good agreement with 4D flow data, when discretization effects are considered (44). Given that there is no gold standard for 3D WSS measurement, we have chosen to emphasize the relative differences between cohorts as examined by the same imaging protocol.
We chose not to examine 3D WSS in different size aortas or differing grades of stenosis given the relatively low number of subjects in these pilot cohorts. However, when we assume a difference of 0.22 Pa and a SD of 0.16 Pa on the distal outer curvature (the region assumedly mostly prone to remodeling) between the controls and dilations cohorts (23), only 7 more subjects are needed to obtain a power of 0.8.
The majority of the subjects were included via retrospective chart review rather than using prospective randomized enrollment; however the primary goal was not to perform a longitudinal study, but rather to present a methodology to create cohort-averaged WSS surface maps over the entire thoracic aorta, and demonstrate the feasibility in a small pilot study to detect differences in normal physiologic and disease biomarkers. The addition of subjects and cohorts is part of ongoing work.
In conclusion, the methodology and application of aortic geometry and WSS maps in a range of subject cohorts was demonstrated. In this pilot study, the technique facilitated the identification of regionally altered WSS in the presence of aortopathy and AVD as compared to healthy controls. This technique may prove useful for the creation of large cohort atlases representing hemodynamic biomarkers. The insights provided by this technique, combined with a large scale randomized trials, may help clarify the role of WSS in vessel wall remodeling.
Acknowledgements
Funding sources: NIH NHLBI grant R01HL115828; American Heart Association Scientist Development Grant 13SDG14360004.
REFERENCES
- 1.Elefteriades JA, Farkas EA. Thoracic aortic aneurysm clinically pertinent controversies and uncertainties. J Am Coll Cardiol. 2010;55(9):841–857. doi: 10.1016/j.jacc.2009.08.084. [DOI] [PubMed] [Google Scholar]
- 2.Davies RR, Goldstein LJ, Coady MA, Tittle SL, Rizzo JA, Kopf GS, Elefteriades JA. Yearly rupture or dissection rates for thoracic aortic aneurysms: simple prediction based on size. Ann Thorac Surg. 2002;73(1):17–27. doi: 10.1016/s0003-4975(01)03236-2. discussion 27-18. [DOI] [PubMed] [Google Scholar]
- 3.Pape LA, Tsai TT, Isselbacher EM, Oh JK, O’Gara PT, Evangelista A, Fattori R, Meinhardt G, Trimarchi S, Bossone E, Suzuki T, Cooper JV, Froehlich JB, Nienaber CA, Eagle KA. International Registry of Acute Aortic Dissection I. Aortic diameter >or = 5.5 cm is not a good predictor of type A aortic dissection: observations from the International Registry of Acute Aortic Dissection (IRAD) Circulation. 2007;116(10):1120–1127. doi: 10.1161/CIRCULATIONAHA.107.702720. [DOI] [PubMed] [Google Scholar]
- 4.Bonow RO, Carabello BA, Chatterjee K, de Leon AC, Jr., Faxon DP, Freed MD, Gaasch WH, Lytle BW, Nishimura RA, O’Gara PT, O’Rourke RA, Otto CM, Shah PM, Shanewise JS. American College of Cardiology/American Heart Association Task Force on Practice G. 2008 focused update incorporated into the ACC/AHA 2006 guidelines for the management of patients with valvular heart disease: a report of the American College of Cardiology/American Heart Association Task Force on Practice Guidelines (Writing Committee to revise the 1998 guidelines for the management of patients with valvular heart disease). Endorsed by the Society of Cardiovascular Anesthesiologists, Society for Cardiovascular Angiography and Interventions, and Society of Thoracic Surgeons. J Am Coll Cardiol. 2008;52(13):e1–142. doi: 10.1016/j.jacc.2008.05.007. [DOI] [PubMed] [Google Scholar]
- 5.Hiratzka LF, Bakris GL, Beckman JA, Bersin RM, Carr VF, Casey DE, Jr., Eagle KA, Hermann LK, Isselbacher EM, Kazerooni EA, Kouchoukos NT, Lytle BW, Milewicz DM, Reich DL, Sen S, Shinn JA, Svensson LG, Williams DM. American College of Cardiology Foundation/American Heart Association Task Force on Practice G, American Association for Thoracic S, American College of R, American Stroke A, Society of Cardiovascular A, Society for Cardiovascular A, Interventions, Society of Interventional R, Society of Thoracic S, Society for Vascular M. 2010 ACCF/AHA/AATS/ACR/ASA/SCA/SCAI/SIR/STS/SVM Guidelines for the diagnosis and management of patients with thoracic aortic disease. A Report of the American College of Cardiology Foundation/American Heart Association Task Force on Practice Guidelines, American Association for Thoracic Surgery, American College of Radiology,American Stroke Association, Society of Cardiovascular Anesthesiologists, Society for Cardiovascular Angiography and Interventions, Society of Interventional Radiology, Society of Thoracic Surgeons,and Society for Vascular Medicine. J Am Coll Cardiol. 2010;55(14):e27–e129. doi: 10.1016/j.jacc.2010.02.015. [DOI] [PubMed] [Google Scholar]
- 6.Bermejo J, Odreman R, Feijoo J, Moreno MM, Gomez-Moreno P, Garcia-Fernandez MA. Clinical efficacy of Doppler-echocardiographic indices of aortic valve stenosis: a comparative test-based analysis of outcome. J Am Coll Cardiol. 2003;41(1):142–151. doi: 10.1016/s0735-1097(02)02627-x. [DOI] [PubMed] [Google Scholar]
- 7.Shah PK. Should severe aortic stenosis be operated on before symptom onset? Severe aortic stenosis should not be operated on before symptom onset. Circulation. 2012;126(1):118–125. doi: 10.1161/CIRCULATIONAHA.111.079368. [DOI] [PubMed] [Google Scholar]
- 8.Carabello BA. Should severe aortic stenosis be operated on before symptom onset? Aortic valve replacement should be operated on before symptom onset. Circulation. 2012;126(1):112–117. doi: 10.1161/CIRCULATIONAHA.111.079350. [DOI] [PubMed] [Google Scholar]
- 9.Okamoto RJ, Xu H, Kouchoukos NT, Moon MR, Sundt TM., 3rd The influence of mechanical properties on wall stress and distensibility of the dilated ascending aorta. J Thorac Cardiovasc Surg. 2003;126(3):842–850. doi: 10.1016/s0022-5223(03)00728-1. [DOI] [PubMed] [Google Scholar]
- 10.Koullias G, Modak R, Tranquilli M, Korkolis DP, Barash P, Elefteriades JA. Mechanical deterioration underlies malignant behavior of aneurysmal human ascending aorta. J Thorac Cardiovasc Surg. 2005;130(3):677–683. doi: 10.1016/j.jtcvs.2005.02.052. [DOI] [PubMed] [Google Scholar]
- 11.Reneman RS, Arts T, Hoeks AP. Wall shear stress--an important determinant of endothelial cell function and structure--in the arterial system in vivo. Discrepancies with theory. J Vasc Res. 2006;43(3):251–269. doi: 10.1159/000091648. [DOI] [PubMed] [Google Scholar]
- 12.Malek AM, Alper SL, Izumo S. Hemodynamic shear stress and its role in atherosclerosis. Journal of the American Medical Association. 1999;282(21):2035–2042. doi: 10.1001/jama.282.21.2035. [DOI] [PubMed] [Google Scholar]
- 13.Lehoux S, Tedgui A. Cellular mechanics and gene expression in blood vessels. J Biomech. 2003;36(5):631–643. doi: 10.1016/s0021-9290(02)00441-4. [DOI] [PubMed] [Google Scholar]
- 14.Tadros TM, Klein MD, Shapira OM. Ascending aortic dilatation associated with bicuspid aortic valve: pathophysiology, molecular biology, and clinical implications. Circulation. 2009;119(6):880–890. doi: 10.1161/CIRCULATIONAHA.108.795401. [DOI] [PubMed] [Google Scholar]
- 15.Wigstrom L, Sjoqvist L, Wranne B. Temporally resolved 3D phase-contrast imaging. Magn Reson Med. 1996;36(5):800–803. doi: 10.1002/mrm.1910360521. [DOI] [PubMed] [Google Scholar]
- 16.Markl M, Kilner PJ, Ebbers T. Comprehensive 4D velocity mapping of the heart and great vessels by cardiovascular magnetic resonance. J Cardiovasc Magn Reson. 2011;13:7. doi: 10.1186/1532-429X-13-7. [DOI] [PMC free article] [PubMed] [Google Scholar]
- 17.Markl M, Frydrychowicz A, Kozerke S, Hope M, Wieben O. 4D flow MRI. J Magn Reson Imaging. 2012;36(5):1015–1036. doi: 10.1002/jmri.23632. [DOI] [PubMed] [Google Scholar]
- 18.Stalder A, Russe M, Frydrychowicz A, Bock J, Hennig J, Markl M. Quantitative 2D and 3D phase contrast MRI: Optimized analysis of blood flow and vessel wall parameters. Magn Reson Med. 2008;60(5):1218–1231. doi: 10.1002/mrm.21778. [DOI] [PubMed] [Google Scholar]
- 19.Frydrychowicz A, Berger A, Russe MF, Stalder AF, Harloff A, Dittrich S, Hennig J, Langer M, Markl M. Time-resolved magnetic resonance angiography and flow-sensitive 4-dimensional magnetic resonance imaging at 3 Tesla for blood flow and wall shear stress analysis. J Thorac Cardiovasc Surg. 2008;136(2):400–407. doi: 10.1016/j.jtcvs.2008.02.062. [DOI] [PubMed] [Google Scholar]
- 20.Frydrychowicz A, Stalder AF, Russe MF, Bock J, Bauer S, Harloff A, Berger A, Langer M, Hennig J, Markl M. Three-dimensional analysis of segmental wall shear stress in the aorta by flow-sensitive four-dimensional-MRI. Journal of Magnetic Resonance Imaging. 2009;30(1):77–84. doi: 10.1002/jmri.21790. [DOI] [PubMed] [Google Scholar]
- 21.Hope MD, Hope TA, Urbania TH, Higgins CB. Four-dimensional flow magnetic resonance imaging with wall shear stress analysis before and after repair of aortopulmonary fistula. Circ Cardiovasc Imaging. 2010;3(6):766–768. doi: 10.1161/CIRCIMAGING.110.957712. [DOI] [PubMed] [Google Scholar]
- 22.Harloff A, Nussbaumer A, Bauer S, Stalder AF, Frydrychowicz A, Weiller C, Hennig J, Markl M. In vivo assessment of wall shear stress in the atherosclerotic aorta using flow-sensitive 4D MRI. Magnetic Resonance in Medecine. 2010;63(6):1529–1536. doi: 10.1002/mrm.22383. [DOI] [PubMed] [Google Scholar]
- 23.Bieging ET, Frydrychowicz A, Wentland A, Landgraf BR, Johnson KM, Wieben O, Francois CJ. In vivo three-dimensional MR wall shear stress estimation in ascending aortic dilatation. J Magn Reson Imaging. 2011;33(3):589–597. doi: 10.1002/jmri.22485. [DOI] [PMC free article] [PubMed] [Google Scholar]
- 24.Markl M, Wallis W, Harloff A. Reproducibility of flow and wall shear stress analysis using flow-sensitive four-dimensional MRI. J Magn Reson Imaging. 2011;33(4):988–994. doi: 10.1002/jmri.22519. [DOI] [PubMed] [Google Scholar]
- 25.Burk J, Blanke P, Stankovic Z, Barker A, Russe M, Geiger J, Frydrychowicz A, Langer M, Markl M. Evaluation of 3D blood flow patterns and wall shear stress in the normal and dilated thoracic aorta using flow-sensitive 4D CMR. J Cardiovasc Magn Reson. 2012;14:84. doi: 10.1186/1532-429X-14-84. [DOI] [PMC free article] [PubMed] [Google Scholar]
- 26.Barker AJ, Markl M, Burk J, Lorenz R, Bock J, Bauer S, Schulz-Menger J, von Knobelsdorff-Brenkenhoff F. Bicuspid aortic valve is associated with altered wall shear stress in the ascending aorta. Circ Cardiovasc Imaging. 2012;5(4):457–466. doi: 10.1161/CIRCIMAGING.112.973370. [DOI] [PubMed] [Google Scholar]
- 27.Markl M, Brendecke SM, Simon J, Barker AJ, Weiller C, Harloff A. Co-registration of the distribution of wall shear stress and 140 complex plaques of the aorta. Magn Reson Imaging. 2013;31(7):1156–62. doi: 10.1016/j.mri.2013.05.001. [DOI] [PubMed] [Google Scholar]
- 28.Markl M, Harloff A, Bley TA, Zaitsev M, Jung B, Weigang E, Langer M, Hennig J, Frydrychowicz A. Time-resolved 3D MR velocity mapping at 3T: improved navigator-gated assessment of vascular anatomy and blood flow. J Magn Reson Imaging. 2007;25(4):824–831. doi: 10.1002/jmri.20871. [DOI] [PubMed] [Google Scholar]
- 29.Bock J, Kreher W, Hennig J, Markl M. Optimized pre-processing of time-resolved 2D and 3D Phase Contrast MRI data. Proc Intl Soc Mag Reson Med. 2007;15:3138. [Google Scholar]
- 30.Vollmer J, Mencl R, Müller H. Improved Laplacian Smoothing of Noisy Surface Meshes. EUROGRAPHICS. 1999;18(3) [Google Scholar]
- 31.Unser M. Splines: a perfect fit for signal and image processing. Signal Processing Magazine, IEEE. 1999;16(6):22–38. [Google Scholar]
- 32.Potters WV, Van Ooij P, Marquering HA, Van Bavel ET, Nederveen AJ. Volumetric arterial wall shear stress calculation based on cine phase contrast MRI. JMRI. 2013 doi: 10.1002/jmri.24560. doi: 10.1002/jmri.24560. [DOI] [PubMed] [Google Scholar]
- 33.Barker AJ, Lanning C, Shandas R. Quantification of hemodynamic wall shear stress in patients with bicuspid aortic valve using phase-contrast MRI. Ann Biomed Eng. 2010;38(3):788–800. doi: 10.1007/s10439-009-9854-3. [DOI] [PMC free article] [PubMed] [Google Scholar]
- 34.Jenkinson M, Smith S. A global optimisation method for robust affine registration of brain images. Med Image Anal. 2001;5(2):143–156. doi: 10.1016/s1361-8415(01)00036-6. [DOI] [PubMed] [Google Scholar]
- 35.Ku DN, Giddens DP, Zarins CK, Glagov S. Pulsatile flow and atherosclerosis in the human carotid bifurcation. Positive correlation between plaque location and low oscillating shear stress. Arteriosclerosis. 1985;5(3):293–302. doi: 10.1161/01.atv.5.3.293. [DOI] [PubMed] [Google Scholar]
- 36.Markl M, Wegent F, Zech T, Bauer S, Strecker C, Schumacher M, Weiller C, Hennig J, Harloff A. In vivo wall shear stress distribution in the carotid artery: effect of bifurcation geometry, internal carotid artery stenosis, and recanalization therapy. Circulation Cardiovascular Imaging. 2010;3(6):647–655. doi: 10.1161/CIRCIMAGING.110.958504. [DOI] [PubMed] [Google Scholar]
- 37.Lorenz R, Bock J, Barker AJ, von Knobelsdorff-Brenkenhoff F, Wallis W, Korvink JG, Bissell MM, Schulz-Menger J, Markl M. 4D flow magnetic resonance imaging in bicuspid aortic valve disease demonstrates altered distribution of aortic blood flow helicity. Magn Reson Med. 2013 doi: 10.1002/mrm.24802. doi: 10.1002/mrm.24802. [DOI] [PMC free article] [PubMed] [Google Scholar]
- 38.Yoshida K, Tobe S, Kawata M, Yamaguchi M. Acquired and reversible von Willebrand disease with high shear stress aortic valve stenosis. Ann Thorac Surg. 2006;81(2):490–494. doi: 10.1016/j.athoracsur.2005.07.074. [DOI] [PubMed] [Google Scholar]
- 39.Petersson S, Dyverfeldt P, Ebbers T. Assessment of the accuracy of MRI wall shear stress estimation using numerical simulations. J Magn Reson Imaging. 2012;36(1):128–38. doi: 10.1002/jmri.23610. [DOI] [PubMed] [Google Scholar]
- 40.Fedak PW, Verma S. The molecular fingerprint of bicuspid aortopathy. J Thorac Cardiovasc Surg. 2013;145(5):1334. doi: 10.1016/j.jtcvs.2013.02.067. [DOI] [PubMed] [Google Scholar]
- 41.Girdauskas E, Borger MA, Secknus MA, Girdauskas G, Kuntze T. Is aortopathy in bicuspid aortic valve disease a congenital defect or a result of abnormal hemodynamics? A critical reappraisal of a one-sided argument. Eur J Cardiothorac Surg. 2011;39(6):809–814. doi: 10.1016/j.ejcts.2011.01.001. [DOI] [PubMed] [Google Scholar]
- 42.Papaharalambus CA, Griendling KK. Basic Mechanisms of Oxidative Stress and Reactive Oxygen Species in Cardiovascular Injury. Trends in Cardiovascular Medicine. 2007;17(2):48–54. doi: 10.1016/j.tcm.2006.11.005. [DOI] [PMC free article] [PubMed] [Google Scholar]
- 43.Steinman DA, Ethier CR, Rutt BK. Combined analysis of spatial and velocity displacement artifacts in phase contrast measurements of complex flows. J Magn Reson Imaging. 1997;7(2):339–346. doi: 10.1002/jmri.1880070214. [DOI] [PubMed] [Google Scholar]
- 44.van Ooij P, Potters WV, Guedon A, Schneiders JJ, Marquering HA, Majoie CB, Vanbavel E, Nederveen AJ. Wall shear stress estimated with phase contrast MRI in an in vitro and in vivo intracranial aneurysm. J Magn Reson Imaging. 2013;38(4):876–884. doi: 10.1002/jmri.24051. [DOI] [PubMed] [Google Scholar]


