

Abstract
Cytomegalovirus (CMV) establishes a persistent infection in the salivary glands and transmits to other hosts. Mouse cytomegalovirus (MCMV) is a well-characterized model for studying the mechanisms of host responses against CMV. The viral load in salivary glands has been measured traditionally because it has been considered to reflect the consequence of anti-virus responses by T cells and natural killer (NK) cells. However, the standard plaque assay is cumbersome and it is impossible to monitor sequentially the viral load in same host. Hence, the goal of this study was to develop a real-time quantitative PCR (qPCR)-based procedure to measure the viral load in oral lavage. This report demonstrates that the viral load in oral lavage correlates well with viral titers in the salivary glands. This method allows sequential quantitation of viral loads without sacrificing mice and provides a technique that will facilitate kinetic studies of anti-viral immunity mediated by the innate and adaptive immune systems.
1, Introduction
Cytomegalovirus (CMV) is a double-stranded DNA virus and a member of β-herpesvirus family, which is widely disseminated in mammalian hosts. Mouse CMV (MCMV) shares many features in common with human CMV (HCMV) in terms of disease progression, dissemination, tropism, latency, and recurrence following immunosuppression, thus providing a useful model of the human disease. MCMV initially replicates in visceral organs, including spleen, liver, kidney, and lung. Control of MCMV is mediated initially by Natural Killer (NK) cells, followed by the subsequent development of B and T cell immunity. In the mouse model of CMV infection, NK cells are critical to the early control of infection (Scalzo et al., 1992). In C57BL/6 mice, NK cells expressing the activating Ly49H receptor are responsible for control of MCMV replication (Brown et al., 2001; Daniels et al., 2001; Lee et al., 2001). The Ly49H receptor recognizes the m157 glycoprotein encoded by MCMV, which is displayed on the surface of infected cells within hours after infection (Arase et al., 2002; Smith et al., 2002). NK cells successfully limit the replication of MCMV during the first few days of infection, and together with T cells and B cells, completely eliminate virus from the blood, spleen, and liver within two weeks. However, MCMV accumulates in salivary glands and persists for weeks or months after primary infection (Henson and Strano, 1972; Jonjić et al., 1989; Andrews et al., 2010). The viral load in salivary glands is correlated inversely with the anti-MCMV responses by T cells and NK cells (Bukowski et al., 1984; Jonjić et al., 1989; Lucin et al., 1992; Orr et al., 2009, 2010). Therefore, it is important to know the viral load in salivary glands to evaluate the immunity against MCMV. Typically, the viral load of MCMV is quantified by plaque assays, in which salivary gland homogenates are dispensed onto a monolayer of mouse embryonic fibroblasts (MEFs) or a MCMV-permissive cell line, followed by visual counting of plaques after 7-10 days. However, this technique is time consuming and requires euthanizing the mice at each time point evaluated, thus not allowing the kinetic analysis of viral load in the same animal. In the mouse oral cavity, the orifice of submandibular duct (also known as Wharton’s duct) is located sublingually on both sides of the tongue and is connected to the submandibular glands (Kuriki et al., 2011). The goal of the study was to test whether MCMV is detectable and quantifiable in oral lavage fluid collected from the mouse sublingual cavity where MCMV is excreted from the submandibular duct along with saliva secretion.
2. Material and methods
2.1. Mice
C57BL/6 mice and BALB/c mice were purchased from the National Cancer Institute (Frederick, MD) and bred at UCSF. Mice were maintained and used in accordance with guidelines of the Institutional Animal Care and Use Committee.
2.2. MCMV infection
Mice 8 weeks of age were infected by i.p. injection with 104 plaque-forming units (pfu) of Smith strain MCMV. The virus stock was prepared by homogenizing salivary glands harvested from BALB/c mice 6 weeks of age, which had been infected with 104 pfu of MCMV at 3 weeks of age.
2.3. Plaque assay
Salivary glands were collected from euthanized mice and snap-frozen on dry ice in 1 mL of DMEM with 2% (vol/vol) BSA and 5 mM HEPES. Samples were stored at −80 °C until use, then were thawed and homogenized, plated on a monolayer of C57BL/6 MEFs in DMEM without FCS, and incubated for 2-8 h at 37 °C. DMEM with 10% (vol/vol) FCS and 0.75% (wt/vol) carboxymethyl cellulose was added and samples were incubated for 7-10 days. MEF monolayers were fixed with 4% (wt/vol) paraformaldehyde in PBS and plaques were visualized by staining with 0.1% (wt/vol) crystal violet.
2.4. Sample collection for qPCR
For oral lavage collection, the mouse sublingual cavity was washed by inserting the tip of a P20 Pipetman (Ranin, Oakland, CA) with 20 μL of sterile saline under anesthesia. After pipetting 10 times, 5 to 10 μL of lavage fluid was collected and 1 μL was used for qPCR analysis. To measure virus copy number in peripheral blood, 10 μL of peripheral blood was processed with a GenElute™ Blood Genomic DNA kit (Sigma-Aldrich, St. Louise, MO), eluted with 20 μL of sterile nuclease-free water, and 1 μL was used for qPCR. To measure virus copy number in salivary glands, homogenates of salivary glands were prepared as described above and 10 μL of homogenate was processed as described for peripheral blood.
2.5. MCMV quantitation by qPCR
SYBR green-based real-time qPCR was performed to measure viral load as previously described with a slight modification (Wheat et al., 2003). Primers used: MCMV-IE1 Forward: 5′-AGCCACCAACATTGACCACGCAC-3′ and MCMV-IE1 Reverse: 5′-GCCCCAACCAGGACACACAACTC-3′. To establish a standard curve for quantitation of viral load a full-length MCMV-IE1 gene was amplified using primers; IE1-full Forward: 5′-TGTCGCCAACAAGATCCTCG-3′ and IE1-full Reverse: 5′-CCCTGCCTGCTGTTCTT-3′ and the gene was cloned into the TOPO-PCR2.1 vector (Invitrogen™, Thermo Fisher Scientific, Waltham, MA).
The reaction mixture contained 1 μL of sample, primers (0.5 μM), and 10 μL of SYBR GreenERTM qPCR mix (Invitrogen™, Thermo Fisher Scientific, Waltham, MA), and was adjusted to 20 μL with nuclease-free water. The PCR was performed using a Chromo4 Real-Time PCR system (Bio-Rad, Hercules, CA) as follows: initial incubation at 95 °C for 10 min, subsequent 40 cycles consisting of 95 °C for 15 sec and 60 °C for 1 min.
2.6. Statistical analysis
Results were analyzed by using the Pearson test.
3. Results
Roy and colleagues initially reported MCMV quantitation by SYBR green-based qPCR (Wheat et al., 2003); however, the detection limit was not less than 100 copies. To improve the sensitivity, the primers specific for MCMV IE-1 were re-designed. New primers were selected that would not amplify any mouse genomic sequences by using Primer-Blast (http://www.ncbi.nlm.nih.gov/tools/primer-blast/). By amplifying a serially diluted MCMV IE-1-encoding plasmid, amplicons of IE-1 from 1-10 copies of template plasmid were detected successfully and reproducibly (Fig.1A). To confirm the specificity, the melting curve of PCR products was analyzed and there were no obvious peaks except for IE-1 (Fig. 1B).
Fig. 1.
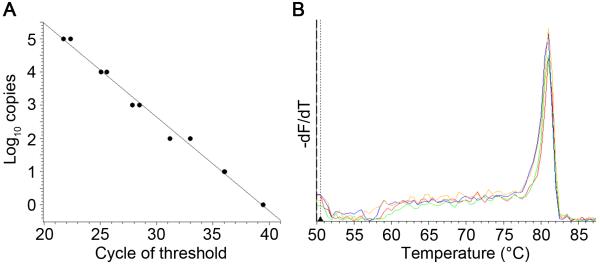
Sensitivity and specificity of qPCR MCMV viral load assay. (A) Serially diluted MCMV-IE-1 plasmids were amplified. Copy number of IE-1 amplicons was plotted against cycle of threshold. (B) Template DNA was prepared from MCMV-infected salivary glands (n=4). The melting curve was graphed by plotting −dF/dT against temperature (°C). Note that peak (Tm) for IE-1 amplicons was 81° C.
The mice were infected with MCMV, euthanized at 2, 7,14 and 21 days post-infection, and samples from oral lavage, peripheral blood, and salivary glands were collected. In the oral lavage, qPCR analysis showed that the viral load was detected at day 7 post-infection and reached a plateau at day 14 (Fig. 2A). As previously reported, qPCR detected MCMV in peripheral blood where the viral load peaked at day 2 and decreased thereafter (Fig. 2B) (Vliegen et al., 2003). Low levels of MCMV were detected by qPCR in salivary glands at day 2 (Fig. 2C), when virus was undetectable by plaque assay (Fig. 2D), Viral load in salivary glands reached a plateau at day 14, as detected by both qPCR and viral plaque assays (Fig. 2C, D) (Vliegen et al., 2003; Wheat et al., 2003). The results for oral lavage samples are similar to that of salivary glands (Fig. 2C, D) and clearly different from that of peripheral blood (Fig. 2B).
Fig. 2.

Detection of MCMV in oral lavage, peripheral blood, and salivary gland. Each of three samples (oral lavage, peripheral blood, and salivary gland) was collected from same donor at indicated time points. The viral load in oral lavage (A) and peripheral blood (B) was quantified by qPCR. The viral load in salivary gland was quantified by qPCR (C) and plaque assay (D). The data were combined from two independent experiments. Error bars indicate SEM (n=8 for each time point).
To evaluate the correlation of the viral loads in oral lavage and salivary gland, data from the same host at days 7, 14, and 21 were compared. As previously reported, the virus loads measured by qPCR and plaque assay correlated (Fig. 3A) (Vliegen et al., 2003; Wheat et al., 2003). Importantly, the virus loads in oral lavage correlated significantly with viral loads in salivary glands as measured by both qPCR (Fig. 3B) and plaque assay (Fig. 3C).
Fig. 3.

Comparison of the viral loads in oral lavage and salivary gland. The viral loads at day 7, 14, and 21, obtained as described in Fig. 2, were analyzed. Correlation between the viral loads in salivary gland quantified by qPCR and plaque assay (A), oral lavage and salivary gland quantified by qPCR (B), and oral lavage quantified by qPCR and salivary gland quantified by plaque assay (C) is shown. An equation for the line determined by regression analysis and R2 values is provided in the graph.
4. Discussion
It has been reported that qPCR quantitation of viral loads is more sensitive than plaque assays (Vliegen et al., 2003; Wheat et al., 2003). In contrast to the rapid and efficient control of replicating virus in visceral organs, MCMV in salivary glands can replicate and excrete virions for months after primary infection (Campbell et al., 2008). Although T cells and NK cells affect significantly the viral load in salivary glands, this organ serves as an immune-privileged site for MCMV by limiting the entry of NK cell from periphery and inducing IL-10 producing T cells, thereby allowing for its dissemination (Humphreys et al., 2007; Tessmer et al., 2011). In this study, it was demonstrated that viral titers can be quantitated precisely by oral lavage of infected mice, and these titers correlate well with viral loads in salivary glands. Saliva might also be used to monitor viral load; however, to collect saliva, mice must be injected with pilocarpine, which is a non-selective muscarinic receptor agonist. Furthermore, MCMV infection causes hyposalivation (Carroll et al., 2012). Therefore, the use of oral lavage is the most convenient method to quantify the viral loads during the course of infection. This method is rapid, convenient, and allows for sequential analysis of the viral load in a single mouse, which permits monitoring of the effects of drugs and Immune cell transfer therapies on viral loads.
HIGHLIGHTS.
We developed new method to quantitate mouse cytomegalovirus (MCMV) in mouse oral lavage.
This is simple and sensitive qPCR-based method.
Viral loads in oral lavage represent those in salivary gland.
This is a non-terminal method, hence it allows to reduce the number of experimental animals and monitor them sequentially.
Acknowledgement
We thank Dr. T. Nabekura for assistance in the preparation of virus stocks and beneficial discussion. National Institutes of Health grant AI068129 supported this study, and L.L.L. is an American Cancer Society Professor.
Footnotes
Publisher's Disclaimer: This is a PDF file of an unedited manuscript that has been accepted for publication. As a service to our customers we are providing this early version of the manuscript. The manuscript will undergo copyediting, typesetting, and review of the resulting proof before it is published in its final citable form. Please note that during the production process errors may be discovered which could affect the content, and all legal disclaimers that apply to the journal pertain.
References
- Andrews DM, Estcourt MJ, Andoniou CE, Wikstrom ME, Khong A, Voigt V, Fleming P, Tabarias H, Hill GR, Most RG, van der, Scalzo AA, Smyth MJ, Degli-Esposti MA. Innate immunity defines the capacity of antiviral T cells to limit persistent infection. J. Exp. Med. 2010;207:1333–1343. doi: 10.1084/jem.20091193. [DOI] [PMC free article] [PubMed] [Google Scholar]
- Arase H, Mocarski ES, Campbell AE, Hill AB, Lanier LL. Direct recognition of cytomegalovirus by activating and inhibitory NK cell receptors. Science. 2002;296:1323–1326. doi: 10.1126/science.1070884. [DOI] [PubMed] [Google Scholar]
- Brown MG, Dokun AO, Heusel JW, Smith HRC, Beckman DL, Blattenberger EA, Dubbelde CE, Stone LR, Scalzo AA, Yokoyama WM. Vital Involvement of a Natural Killer Cell Activation Receptor in Resistance to Viral Infection. Science. 2001;292:934–937. doi: 10.1126/science.1060042. [DOI] [PubMed] [Google Scholar]
- Bukowski JF, Woda BA, Welsh RM. Pathogenesis of murine cytomegalovirus infection in natural killer cell-depleted mice. J. Virol. 1984;52:119–128. doi: 10.1128/jvi.52.1.119-128.1984. [DOI] [PMC free article] [PubMed] [Google Scholar]
- Campbell AE, Cavanaugh VJ, Slater JS. The salivary glands as a privileged site of cytomegalovirus immune evasion and persistence. Med. Microbiol. Immunol. (Berl.) 2008;197:205–213. doi: 10.1007/s00430-008-0077-2. [DOI] [PubMed] [Google Scholar]
- Carroll VA, Lundgren A, Wei H, Sainz S, Tung KS, Brown MG. Natural Killer Cells Regulate Murine Cytomegalovirus-Induced Sialadenitis and Salivary Gland Disease. J. Virol. 2012;86:2132–2142. doi: 10.1128/JVI.06898-11. [DOI] [PMC free article] [PubMed] [Google Scholar]
- Daniels KA, Devora G, Lai WC, O’Donnell CL, Bennett M, Welsh RM. Murine Cytomegalovirus Is Regulated by a Discrete Subset of Natural Killer Cells Reactive with Monoclonal Antibody to Ly49h. J. Exp. Med. 2001;194:29–44. doi: 10.1084/jem.194.1.29. [DOI] [PMC free article] [PubMed] [Google Scholar]
- Henson D, Strano AJ. Mouse cytomegalovirus. Necrosis of infected and morphologically normal submaxillary gland acinar cells during termination of chronic infection. Am. J. Pathol. 1972;68:183–202. [PMC free article] [PubMed] [Google Scholar]
- Humphreys IR, Trez C, de, Kinkade A, Benedict CA, Croft M, Ware CF. Cytomegalovirus exploits IL-10-mediated immune regulation in the salivary glands. J. Exp. Med. 2007;204:1217–1225. doi: 10.1084/jem.20062424. [DOI] [PMC free article] [PubMed] [Google Scholar]
- Jonjić S, Mutter W, Weiland F, Reddehase MJ, Koszinowski UH. Site-restricted persistent cytomegalovirus infection after selective long-term depletion of CD4+ T lymphocytes. J. Exp. Med. 1989;169:1199–1212. doi: 10.1084/jem.169.4.1199. [DOI] [PMC free article] [PubMed] [Google Scholar]
- Kuriki Y, Liu Y, Xia D, Gjerde EM, Khalili S, Mui B, Zheng C, Tran SD. Cannulation of the Mouse Submandibular Salivary Gland via the Wharton’s Duct. J. Vis. Exp. 2011 doi: 10.3791/3074. [DOI] [PMC free article] [PubMed] [Google Scholar]
- Lee S-H, Girard S, Macina D, Busà M, Zafer A, Belouchi A, Gros P, Vidal SM. Susceptibility to mouse cytomegalovirus is associated with deletion of an activating natural killer cell receptor of the C-type lectin superfamily. Nat. Genet. 2001;28:42–45. doi: 10.1038/ng0501-42. [DOI] [PubMed] [Google Scholar]
- Lucin P, Pavić I, Polić B, Jonjić S, Koszinowski UH. Gamma interferon-dependent clearance of cytomegalovirus infection in salivary glands. J. Virol. 1992;66:1977–1984. doi: 10.1128/jvi.66.4.1977-1984.1992. [DOI] [PMC free article] [PubMed] [Google Scholar]
- Orr MT, Murphy WJ, Lanier LL. “Unlicensed” Natural Killer cells dominate the response to cytomegalovirus infection. Nat. Immunol. 2010;11:321–327. doi: 10.1038/ni.1849. [DOI] [PMC free article] [PubMed] [Google Scholar]
- Orr MT, Sun JC, Hesslein DGT, Arase H, Phillips JH, Takai T, Lanier LL. Ly49H signaling through DAP10 is essential for optimal natural killer cell responses to mouse cytomegalovirus infection. J. Exp. Med. 2009;206:807–817. doi: 10.1084/jem.20090168. [DOI] [PMC free article] [PubMed] [Google Scholar]
- Scalzo AA, Fitzgerald NA, Wallace CR, Gibbons AE, Smart YC, Burton RC, Shellam GR. The effect of the Cmv-1 resistance gene, which is linked to the natural killer cell gene complex, is mediated by natural killer cells. J. Immunol. 1992;149:581–589. [PubMed] [Google Scholar]
- Smith HRC, Heusel JW, Mehta IK, Kim S, Dorner BG, Naidenko OV, Iizuka K, Furukawa H, Beckman DL, Pingel JT, Scalzo AA, Fremont DH, Yokoyama WM. Recognition of a virus-encoded ligand by a natural killer cell activation receptor. Proc. Natl. Acad. Sci. 2002;99:8826–8831. doi: 10.1073/pnas.092258599. [DOI] [PMC free article] [PubMed] [Google Scholar]
- Tessmer MS, Reilly EC, Brossay L. Salivary Gland NK Cells Are Phenotypically and Functionally Unique. PLoS Pathog. 2011:7. doi: 10.1371/journal.ppat.1001254. [DOI] [PMC free article] [PubMed] [Google Scholar]
- Vliegen I, Herngreen S, Grauls G, Bruggeman C, Stassen F. Improved detection and quantification of mouse cytomegalovirus by real-time PCR. Virus Res. 2003;98:17–25. doi: 10.1016/j.virusres.2003.08.009. [DOI] [PubMed] [Google Scholar]
- Wheat RL, Clark PY, Brown MG. Quantitative measurement of infectious murine cytomegalovirus genomes in real-time PCR. J. Virol. Methods. 2003a;112:107–113. doi: 10.1016/s0166-0934(03)00197-6. [DOI] [PubMed] [Google Scholar]