

Abstract
One of the best-studied mechanosensitive channels is the mechanosensitive channel of large conductance (MscL). MscL senses tension in the membrane evoked by an osmotic down shock and directly couples it to large conformational changes leading to the opening of the channel. Spectroscopic techniques offer unique possibilities to monitor these conformational changes if it were possible to generate tension in the lipid bilayer, the native environment of MscL, during the measurements. To this end, asymmetric insertion of l-α-lysophosphatidylcholine (LPC) into the lipid bilayer has been effective; however, how LPC activates MscL is not fully understood. Here, the effects of LPC on tension-sensitive mutants of a bacterial MscL and on MscL homologs with different tension sensitivities are reported, leading to the conclusion that the mode of action of LPC is different from that of applied tension. Our results imply that LPC shifts the free energy of gating by interfering with MscL-membrane coupling. Furthermore, we demonstrate that the fine-tuned addition of LPC can be used for controlled activation of MscL in spectroscopic studies.—Mukherjee, N., Jose, M. D., Birkner, J. P., Walko, M., Ingólfsson, H. I., Dimitrova, A., Arnarez, C., Marrink, S. J., Koçer, A. The activation mode of the mechanosensitive ion channel, MscL, by lysophosphatidylcholine differs from tension-induced gating.
Keywords: spectroscopy, protein-lipid interaction, mechanosensation, critical micelle concentration of LPC
Mechanosensation is the basis for various biological processes including touch, hearing, and osmoregulation. Mechanosensitive ion channels are present in prokaryotes, archaea, and eukaryotes and are responsible for detecting mechanical stress. They gate between their open and closed forms, on mechanical stimulation, and regulate the flow of ions and small molecules through an otherwise impermeable membrane (1).
The mechanosensitive channel of large conductance (MscL) is one of the best-studied mechanosensitive channels. It plays an essential role in osmoregulation of bacterial cells. It is composed of 5 identical subunits, each of which has 2 transmembrane (TM) domains (TM1 and TM2), a periplasmic loop, and cytoplasmic N and C termini (2, 3). The TM1 domains form a narrow pore constriction, which is 2−4 Å in diameter in the closed state of the channel. On encountering hypoosmotic conditions, which cause increased tension in the bacterial inner membrane, a water-filled, nonselective pore, with a diameter of ∼30 Å, opens (4). It jettisons not only ions but also small molecules (4–6). Although gating models, based on a large body of data, are available (7–12), the mechanism by which MscL senses the mechanical stimulus that leads to protein structural changes and channel opening remains to be determined.
The tension sensation of MscL is directly coupled to large conformational changes in the channel (10, 13, 14) even before its pore starts conducting (15, 16). Figure 1 illustrates the process of MscL channel opening, using snapshots from coarse-grained (CG) molecular dynamics (MD) simulations of MscL in the closed, preopen, and initial-open states. Therefore, spectroscopic techniques are ideally suited for following changes in the structure of MscL even from the very early stages, so as to understand the mechanism of mechanosensation. However, observing these changes is complicated by the lack of suitable methods for activating MscL in a controlled way in a spectroscopic setup. Previously, lipids with varying acyl chain lengths or amphipathic molecules that insert into the lipid bilayer in an asymmetric fashion have been used to activate MscL in electron paramagnetic resonance (EPR; ref. 17) and fluorescence spectroscopic studies (17, 18). One of these amphipathic molecules, l-α-lysophosphatidylcholine (LPC), an inverted cone-shaped lipid with a single tail, has a dramatic effect on the channel activity (18). It has been proposed that LPC can activate Escherichia coli MscL reconstituted in different artificial lipid bilayers by inducing curvature and changing the bilayer lateral pressure profile (16–19). However, despite its substantial effect on the channel activity, the mechanism by which LPC activates MscL is still being debated (20).
Figure 1.
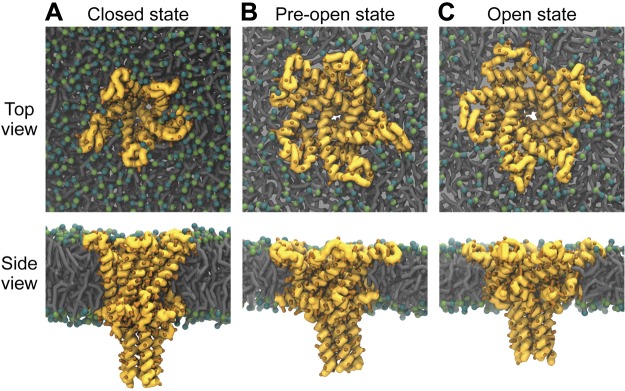
MscL channel opening. Snapshots of MscL from Martini CG MD simulations are shown to illustrate channel opening. MscL was embedded in a DOPC bilayer and gated using tension as described in Yefimov et al. (34) and Louhivuori et al. (35). Three states of MscL are depicted: an equilibrated closed state before application of tension (A), after application of bilayer tension but before pore opening (B); and after channel opening to a subconducting open state (C).
Here, we systematically studied whether LPC can be used in place of tension for activating MscL in a controlled manner in a lipid bilayer. We investigated the effect of the LPC concentration on the degree of opening of MscL using different tension-sensitive MscL mutants and MscL homologs from different bacteria. The MscL activity in response to LPC concentration and tension in azolectin liposomes was compared using both ensemble and single-molecule measurements. Our results show the following: the LPC sensitivity of homologous MscL channels is not directly proportional to their tension sensitivity; LPC increases the tension sensitivity of MscL homologs from Lactococcus lactis and Mycobacterium tuberculosis up to a point of gating with no applied tension; LPC increases the open dwell time of MscL; MscLs from L. lactis and M. tuberculosis are more sensitive to the effect of LPC than MscL from E. coli; and LPC exerts its effect on MscL by altering the protein-membrane coupling, especially the protein bilayer line tension. Our results show that LPC can be used to discriminate MscL channels on the basis of their tension sensitivity and to study loss-of-function (LOF) mutants or less tension-sensitive homologs with electrophysiology and spectroscopy techniques.
MATERIALS AND METHODS
Strains and cell growth
E. coli strain PB104 (3) was used to host the mscl gene from E. coli, M. tuberculosis, and L. lactis, expressed from p1BAD expression constructs (21). p1BAD expression constructs were derived from a parental pBAD-myc-his B plasmid pBAD24 derivative (22) without myc-his sites. The original multiple cloning site was expanded, and nucleotides encoding for a c-myc epitope and His tag were removed. Chemically (CaCl2) competent E. coli PB104 cells were transformed with p1BAD and were grown in Luria-Bertani (LB) medium in the presence of ampicillin (100 μg/ml) and chloramphenicol (10 μg/ml) in a shaker-incubator at 37°C, rotated 250 cycles/min. A single colony of PB104 was used for inoculating an overnight culture in LB medium supplemented with ampicillin (100 μg/ml) and chloramphenicol (10 μg/ml). The cells were grown at 37°C in a 2-L fermenter using a complex medium [12 g/L Bacto-Tryptone (BD Biosciences, San Jose, CA, USA); 24 g/L yeast extract (BD Biosciences); and potassium phosphate (17 mM KH2PO4 and 72 mM K2HPO4; pH 7], supplemented with the appropriate antibiotics at pH 7.5, and oxygen control (dissolved oxygen >70%). At the late-logarithmic phase, protein expression was initiated by addition of 0.1% arabinose; 0.4% glycerol was also added as an additional carbon source. The cells were further grown for another 2 h before harvesting.
Synthetic gene design
The MscL amino acid sequences from L. lactis (gi 12725155) and M. tuberculosis (gi 6016604) were used to produce the corresponding codon sequences using the Bioinformatics Toolbox (DNA2.0, Inc., Menlo Park, CA, USA; ref. 23). The FatI and SpeI restriction sites were added to the 5′ and 3′ termini of the DNA sequence, respectively. The DNA sequences were codon optimized for protein expression in E. coli, and the optimized genes were synthesized by Geneart GmbH (Regensburg, Germany).
Cloning
The two genes were amplified by PCR from the Geneart plasmid using the following primers: L. lactis MscL (Ll-MscL) optimized for E. coli, forward GGCCAGTTAATTAAGAGGTACCAGC and reverse GGCCGTCAAGGCCTAGGCGCG; and M. tuberculosis MscL (Tb-MscL) optimized for E. coli, forward GGCCAGTTAATTAAGAGGTACCAGC and reverse GGAAGGCCGTCAAGGCCTAGGC.
After PCR amplification, the product was digested using FatI and SpeI restriction enzymes and then ligated into the p1BAD vector. The vectors (derivatives of p1BAD), containing the genes of interest were finally used to transform the E. coli strain PB104 for functional studies. The cloned gene was confirmed by sequencing (Servicex, Leiden, The Netherlands).
Membrane vesicle preparation
Cells were harvested by centrifugation and suspended in 25 mM Tris-HCl (pH 8.0) to a final OD600 of 100–150. Subsequently, DNase (0.5 mg/ml, final concentration), RNase (0.5 mg/ml, final concentration), and 5 mM MgSO4 were added, and cells were broken using a cell disrupter (type TS/40; Constant Systems, Low March, UK) at 1.7 kbar at 4°C. Cellular debris was removed by centrifugation for 30 min at 18,460 g at 4°C. The supernatant was ultracentrifuged at 145,400 g for 90 min at 4°C and discarded, and the remaining membrane vesicles were resuspended and homogenized in ice-cold 25 mM Tris-HCl (pH 8.0) to 0.7 g (wet weight)/ml and stored at −80°C.
Protein isolation
His-tagged Ll-MscL, Tb-MscL, and E. coli MscL (Ec-MscL) mutants, G22C and G22S, were purified by nickel-nitriloacetic acid (Ni-NTA) affinity chromatography, as described previously (24). In brief, membrane vesicles corresponding to ∼90 mg of total protein were solubilized at 5 mg/ml in 50 mM sodium phosphate (pH 8.0), 300 mM NaCl, 1% (v/v) Triton X-100, and 35 mM imidazole (solubilization buffer) for 30 min at 4°C. After ultracentrifugation at 267,000 g for 20 min at 4°C, the supernatant was applied to Ni-NTA agarose resin (Qiagen, Valencia, CA, USA) [30 mg membrane protein/ml per 50% (w/v) slurry], which was preequilibrated with 10 column volumes (CV) of solubilization buffer, and incubated under mild agitation for 30 min at 4°C. Unbound material was collected as flow through and analyzed when appropriate. The column was washed consecutively with 15 CV of wash buffer [50 mM sodium phosphate (pH 8.0), 300 mM NaCl, 0.2% (v/v) Triton X-100, and 35 mM imidazole]. The nonspecific proteins were washed off the affinity column with 7.5 CVs of l-histidine wash buffer [50 mM sodium phosphate (pH 8.0), 300 mM NaCl, 0.2% (v/v) Triton X-100, and 50 mM histidine]. His-tagged proteins were eluted by the addition of 15 × 0.5 CV of Ni-NTA elution buffer [50 mM sodium phosphate (pH 8.0), 300 mM NaCl, 0.2% (v/v) Triton X-100, and 235 mM l-histidine]. The protein content of the fractions was checked with a Bradford assay. The total yield of protein was 3–4 mg at an average concentration of 1 mg/ml MscL.
To Strep-tag Ec-MscL wild-type (WT), a column with Strep-Tactin resin (IBA GmbH, Goettingen, Germany) was equilibrated with solubilization buffer as before for 30 min at 4°C. Then 80 mg of membrane protein from E. coli was incubated with the slurry with gentle agitation at 4°C to allow binding of Strep(II)-tagged proteins. Unbound material was collected as flow through, and the column was washed with 10 CVs of wash buffer [50 mM sodium phosphate (pH 8.0), 300 mM NaCl, and 0.2% (v/v) Triton X-100] to remove nonspecific membrane proteins and contaminants. The bound protein was eluted with 10 fractions each of 250 μl of biotin buffer [50 mM sodium phosphate (pH 8.0), 300 mM NaCl, 0.2% (v/v) Triton X-100, and 10 mM biotin] and analyzed for protein content. Usually the final concentration of protein isolated from both types of column was ∼0.9–1.5 mg/ml. Protein was frozen in liquid nitrogen and stored at −80°C.
Lipid preparation for reconstitution
Soy phosphatidylcholine (better known as azolectin, 20%, 8030-76-0; Avanti Polar Lipids, Alabaster, AL, USA) was suspended in 150 mM NaCl and 10 mM sodium phosphate (pH 8.0) buffer to a 20 mg/ml final concentration by vortexing and a 10-s sonication at room temperature. Subsequently, 7 freeze-thaw cycles were performed with rapid freezing in liquid N2 and thawing in a waterbath at 50°C, respectively. Aliquots of 1 ml were stored at −80°C.
Protein reconstitution in large unilamellar vesicles (LUVs)
His-tagged MscL was purified by Ni-NTA affinity chromatography, and the protein concentration was determined by the Bradford assay as described previously (24). In brief, MscL proteins were reconstituted into azolectin liposomes by a detergent-mediated reconstitution method, as described previously (24). Azolectin was thawed and extruded 11 times through a 400-nm filter. Thereby LUVs were formed. Subsequently, liposomes were destabilized by addition of 10% Triton X-100. The amount of Triton X-100 to be added to lipid was determined by the lipid titration method. Protein and lipids were mixed at a ratio of 1:50 (w/w) and incubated for 30 min at 50°C. Subsequently, the appropriate buffer [for the fluorescence dequenching assay: 200 mM calcein in 10 mM sodium phosphate (pH 8.0); for the patch-clamp measurements: 10 mM sodium phosphate (pH 8.0) and 150 mM NaCl] was added in a ratio of 1:1 (v/v) and supplemented with 10 mg (wet weight) of BioBeads (SM-2 Absorbents; Bio-Rad Laboratories B.V., Veenendaal, The Netherlands) per microliter of detergent (10% Triton X-100) used in the sample and lipid preparation. For detergent removal, the sample was incubated overnight (∼16 h) at 4°C on a rotating plate.
Determining the critical micellar concentration (CMC) of LPC
The CMC of LPC was determined by fluorescence spectroscopy as described previously (25). In brief, this method is based on changes in vibrational band intensities in the fluorescent spectra of pyrene due to the solvent environment. The solvent environment is different above and below the CMC of surfactants. Below the CMC, pyrene is in a polar environment, and above the CMC of the surfactant, pyrene is solubilized in the core of the micelles. Hence, the vibrational band intensities of pyrene fluorescent spectra are different, depending on whether the surfactant is present at a concentration below or above its CMC. This is represented by the change in the ratio of the first (373 nm) and third (384 nm) bands of pyrene fluorescent spectra. Following this method, we performed assays with LPC and pyrene and found the CMC of LPC to be ∼20 μM (Supplemental Fig. S1).
Fluorescence dequenching assay
LPC was purchased from Avanti Polar Lipids. [2-(trimethylammonio)ethyl]methanethiosulfonate was from Anatrace (Maumee, OH, USA). External calcein was separated from the proteoliposomes on a Sephadex G50 size-exclusion column. A calcein-dequenching assay was performed in a Varian Cary Eclipse fluorimeter (Agilent Technologies, Amstelveen, The Netherlands) at a calcein excitation wavelength of 497 nm and emission wavelength of 516 nm. In a standard assay, 2 μl of calcein-filled proteoliposomes was diluted into 2.1 ml of iso-osmotic efflux buffer. At t = 2 min, LPC was added to this buffer at various final concentrations from 0 to 19.8 μM maximum, and the content was continuously and gently stirred. The fluorescence was measured in real time. After the release reached saturation at ∼6–10 min, i.e., the fluorescence intensity reached a plateau and did not change for the rest of the recording for many minutes, the liposomes were disintegrated by the addition of a 0.5% (v/v) final concentration of the detergent Triton X-100. The resulting fluorescence intensity is taken as 100%. The maximum percentage release through the channel was then calculated from the formula: maximum percentage release = (Imax/I100) × 100, where Imax is the saturated fluorescence intensity reached before the addition of the detergent, and I100 is the fluorescence intensity from total liposomal calcein, which is obtained from bursting all liposomes by the addition of Triton X-100. As a control, background release from the liposomal membrane was recorded in the presence of an equal concentration of LPC in control liposomes with no MscL.
Western blot analysis
Proteoliposome samples were harvested by centrifugation at 26,000 g for 40 min and used for sodium dodecyl sulfate-polyacrylamide gel for electrophoresis (SDS-PAGE). Proteins were electrotransferred to a polyvinylidene difluoride membrane, and the Western blot analysis was performed using primary antibodies against the MscL C terminus His- and Strep-tags as described previously (3). For imaging of the chemiluminescence, an LAS3000 detection system (Fujifilm, Tokyo, Japan) was used according to the manufacturer's protocol. The developed film was processed using ImageJ (U.S. National Institutes of Health, Bethesda, MD, USA; ref. 26).
EPR
EPR is a nondestructive method. Together with site-directed spin labeling, EPR provides structural information on the molecular level by detecting unpaired electrons attached to the labeled amino acid residue in the protein (27, 28). To make MscL EPR visible, we specifically labeled the G22C mutant of Ec-MscL with (1-oxyl-2,2,5,5-tetramethylpyrrolin-3-yl)methyl methanethiosulfonate (MTSSL; Toronto Research Chemicals, North York, ON, Canada). MscL was labeled with 1 mM MTSSL after protein isolation from the Ni-NTA column for 30 min at 4°C. The product was then used for EPR studies either in detergent micellar form or reconstituted in azolectin lipid. Continuous-wave EPR measurements were performed using a commercially available MiniScope benchtop X-band EPR spectrometer (MS400; Magnet Tech GmbH, Berlin, Germany) with a rectangular TE102 resonator. Because of the heat production in the resonator during operation, the cavity was flushed with gaseous nitrogen to keep the temperature stable. The microwave power was set to 10 mW and the B-field modulation amplitude to 0.20 mT. EPR glass capillaries (0.9 mm inner diameter) were filled with sample volume of 50 μl, and the final protein concentration was 285 μM. The microwave frequency was 9.41 GHz, and the modulation frequency was 100 kHz. Each spectrum corresponds to the accumulation of 36 scans.
Electroformation and patch clamp
Giant unilamellar liposomes (GUVs) for patch-clamp experiments were prepared as explained before (29). In brief, proteoliposomes were recovered as described for the calcein efflux procedure. However, for the patch-clamp experiments, the calcein encapsulation and the size exclusion steps were omitted. Proteoliposomes were diluted to a final lipid concentration of 0.8 mg/ml by addition of an appropriate volume of 2 mM 3-(N-morpholino)propanesulfonic acid (MOPS)-Tris (pH 7.5). After dilution, 2-μl aliquots were spotted onto the conducting side of an indium tin oxide plate and dried overnight in a desiccator under vacuum at 4°C.
GUVs were prepared by rehydrating the lipid films in 250 mM sorbitol using a Nanion Vesicle Prep Pro instrument (Nanion Technologies GmbH, Munich, Germany). The electroformation protocol was adapted from Girard et al. (29) with an alternating current voltage applied across the cell unit for 3 h with stepwise increases from 0.1 to 1.1 V at 12 kHz. At the end, to detach the glass-attached GUVs, the frequency was lowered to 4 Hz and the voltage raised to 2 V for 30 min. Subsequently, GUVs in sorbitol were transferred to a clean tube and assayed by patch clamp.
For the patch clamp, the sample chamber of the patch setup was filled with 160 μl of patch buffer [200 mM KCl, 90 mM MgCl2, 10 mM CaCl2, and 5 mM HEPES-KOH (pH 7.25)] and 5 μl of GUV sample (lipid concentration, ∼0.44 mg/ml). Pipettes (calibrated 100-μl pipettes; Drummond Scientific, Broomall, PA, USA) with 1-μm tip diameter were pulled by using a P-1000 micropipette puller (Sutter Instrument Company, Novato, CA, USA). The pipette tip was filled with the same buffer as the bath. All recordings were performed with excised patches under the same conditions (20 mV, gain 10, and sampling rate of 20 μs). The data were amplified and filtered at 10 kHz using an Axopatch 1D amplifier, sampled at 33 kHz in a Digidata 1322A digitizer, and analyzed with pCLAMP10 software (Molecular Devices, Sunnyvale, CA, USA).
MD simulations
MscL simulations were performed using the Martini CG model (30–32) and the Gromacs 4.x simulation package (33), following a procedure similar to that described in Yefimov et al. (34) and Louhivuori et al. (35). The topology of MscL was derived from the closed state Tb-MscL crystal structure (Protein Data Bank 2OAR; ref. 36) using Martini 2.0. The channel was embedded in a 562-CG 1,2-dioleoyl-sn-glycero-3-phosphocholine (DOPC) lipid bilayer and solvated with 20,000 CG water beads (representing ∼80,000 water molecules) using the insane.py script. In simulations with LPC, 10 mol% LPC was added to the upper (periplasmic) leaflet. The temperature and pressure were controlled using a Berendsen thermostat (298 K) and barostat (1 bar semi-isotropic pressure coupling; ref. 37). Initially the system was energy minimized (steepest descent, 500 steps) and simulated for 10 ns using a short time step (10 fs) and with position restrains on the protein backbone. The restraints were released, and the system was simulated for 20 ns with a 20-fs time step. The final time step was 30 fs, and the system was simulated for 4 μs. Bilayer tension was incrementally applied in 7 short (3-ns) simulations to a value of 60–65 mN/m and then simulated for 3 μs. In the first ∼100 ns after the application of the lateral bilayer tension and thinning of the bilayer, the MscL transmembrane helixes tilted, extending the extracellular cavity of the channel (channel preopen state). The channel hydrophobic gate takes an additional 200–600 ns before expanding and opening. All snapshots were generated using the molecular graphics viewer VMD (38).
RESULTS
Sensitivity of MscL mutants to LPC is directly related to their sensitivity to applied tension in the lipid bilayer
To test whether LPC mimics tension in the lipid bilayer, we studied its ability to differentiate tension-sensitive mutants of Ec-MscL. It has been shown that the hydrophilicity of the amino acid at position 22 in MscL affects the threshold of mechanosensitivity (8). For instance, a mutation of G22 into a more hydrophobic amino acid, such as cysteine (G22C), presents LOF behavior, meaning that this mutant requires higher tension to be activated. On the other hand, a mutation of G22 to the hydrophilic amino acid serine (G22S) results in a gain-of-function (GOF) phenotype so that less tension than that in the WT channel is required for activation (8, 39). Here, we hypothesized that if LPC mimics tension, the amount of LPC required for channel activation should be directly related to the magnitude of tension required for activating the LOF or GOF mutants. To test this, we defined the midpoint LPC concentration (C1/2) for activating individual mutants using a fluorescence dequenching assay (24). We reconstituted individual mutants at the same 1:50 (w/w) protein/lipid ratio into azolectin LUVs loaded with calcein, a self-quenching fluorescent dye. We activated the channels with different concentrations of LPC and generated dose-response curves of the maximum percentage release from LUVs as a function of the LPC concentration (Fig. 2A, B). The maximum calcein release relative to the LPC concentration was fitted with a Boltzmann distribution, and the C1/2 and sensitivity (1/α) to LPC were determined as the midpoint and inverse of the slope of the fit, respectively (Fig. 2B and Table 1). We observed a direct correlation between the tension requirement of individual mutants and the concentration of LPC required for activating them. For WT MscL, the LPC concentration for 50% release (C1/2) was 2.31 ± 0.15 μM, whereas the GOF mutant G22S required 2.35-fold less LPC and the LOF mutant G22C required 1.68-fold more LPC than the WT. Furthermore, the slope of the dose-response curves indicated that G22S is more sensitive to LPC addition than either the WT or G22C MscL. Overall, the results show that LPC can differentiate Ec-MscL mutants on the basis of their sensitivity to the applied tension. Furthermore, it allows one to study LOF mutants, which would be difficult to activate in a patch clamp because of the lytic amount of tension required.
Figure 2.
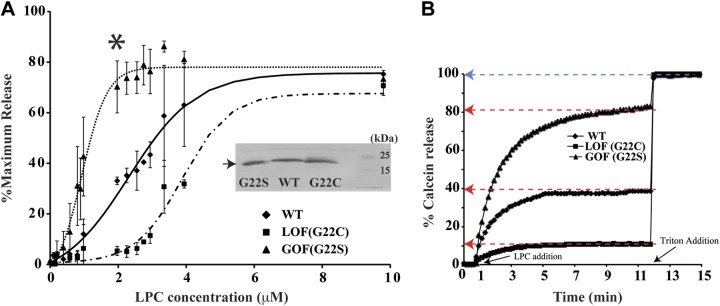
Response of E. coli MscL mutants to LPC. MscL channels (WT), G22C, and G22S were separately embedded in azolectin liposomes and tested for their activation by LPC, using the calcein dequenching assay. For each channel type, we followed release of calcein on addition of different concentrations of LPC to the isosmotic bulk solution. Maximum calcein released for each LPC concentration tested was collated to give a dose-response curve of LPC concentration vs. maximum percentage release. A) Graph of maximum percentage release vs. LPC concentration for E. coli WT and mutant MscLs. LPC (2–3 μM) could distinguish between tension-sensitive mutants. Maximum percentage release in the GOF mutant, G22S, is the highest at any given LPC concentration, followed by the WT and LOF mutant, G22C. Release of liposomal content was calculated from the relative increase in fluorescence. Background release through the lipid membrane (if any) is accounted for in the control experiments done with liposomes without any protein inserted in them at all concentrations of LPC. Western blot of proteoliposome samples used in fluorimetric assay indicates that the amount of protein present in all samples is comparable (inset). B) Exemplary time course of calcein release from individual E. coli MscL channels at 1.97 μM LPC concentration (asterisk in panel A), highlighting maximum percentage release (red arrows) and 100% release (blue arrow). Time points at which LPC and Triton X-100 was added into proteoliposome samples are indicated with black arrows.
Table 1.
Kinetics table comparing the 1/α, sensitivity, and C1/2 for mutants
| Mutant | C1/2 (μM) | 1/α (μM) |
|---|---|---|
| G22S | 0.98 ± 0.05 | 0.5 ± 0.05 |
| WT | 2.31 ± 0.15 | 0.91 ± 0.27 |
| G22C | 3.88 ± 0.12 | 1.28 ± 0.35 |
Data are means ± se. Sensitivity indicates the amount of LPC required for an e-fold change in percentage release, and C1/2, indicates the LPC concentration at which 50% of the final release occurs, derived by fitting with the Boltzmann function.
LPC does not directly generate tension in the lipid bilayer but increases the tension sensitivity of the mechanosensitive ion channels
To further explore the relation between LPC and applied tension in the lipid bilayer, we used LPC to activate Tb-MscL and Ll-MscL homologs. Both Tb- and Ll-MscL are less tension-sensitive than Ec-MscL and require at least twice as much tension to be activated (40–42). We reconstituted Tb-MscL, Ll-MscL, and Ec-MscL, at a 1:50 (w/w) protein/lipid ratio, into calcein-loaded azolectin LUVs, followed their activation by LPC using a fluorescence dequenching assay, and generated dose-response curves as mentioned above (Fig. 3A). If LPC mimicked tension in the lipid bilayer, both Tb-MscL and Ll-MscL channels were expected to behave similarly to the G22C LOF mutant of Ec-MscL and be activated at higher LPC concentrations. Surprisingly, both Tb-MscL and Ll-MscL were more sensitive to LPC than Ec-MscL and could be activated with C1/2 values of 0.86 ± 0.25 and 0.85 ± 0.03 μM LPC, respectively, whereas Ec-MscL required 2.31 ± 0.15 μM (Fig. 3B and Table 2). When we repeated the same experiments in another lipid composition, i.e., E. coli total lipids, we observed that all 3 homologs required more LPC for their activation. However, similar to the results with azolectin lipid, the relative sensitivity of the channels to LPC did not change. Both Tb-MscL and Ll-MscL could be activated at lower LPC concentrations than that for Ec-MscL (Supplemental Fig. S2).
Figure 3.
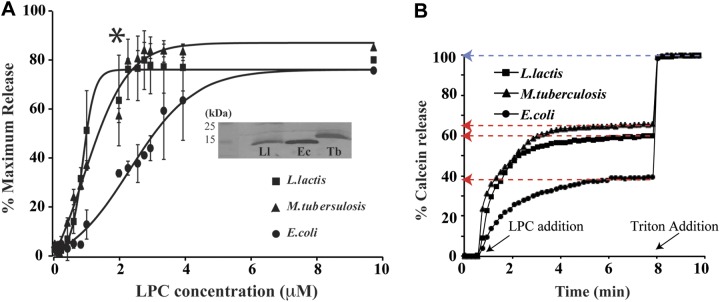
Response of MscL homologs to LPC. Activation of reconstituted E .coli, L. lactis, and M. tuberculosis MscL channels by LPC was tested using the calcein dequenching assay. Release of calcein on addition of different concentrations of LPC was followed for each channel. Maximum calcein released for each LPC concentration tested was collated to give a dose-response curve of LPC concentration vs. maximum percentage release. A) Graph of maximum percentage release vs. LPC concentration. At 3 μM LPC, Tb-MscL has the highest release followed by Ll-MscL and Ec-MscL. Release of liposomal content was calculated from the relative increase in fluorescence. This is the release through the channel only. Release of the liposomal content was calculated from the relative increase in fluorescence. Background release through the lipid membrane (if any) is accounted for in the control experiments done with liposomes without any protein inserted in them at all concentrations of LPC. Western blot of proteoliposome samples used in fluorimetric assay indicates that the amount of protein present in all samples is comparable (inset). B) Exemplary time course of calcein release from individual MscL channels at 1.97 μM LPC concentration (asterisk in panel A), highlighting maximum percentage release (red arrows) and 100% release (blue arrow). Time points at which LPC and Triton X-100 were added into the proteoliposome samples are indicated with black arrows.
Table 2.
Kinetics table comparing the 1/α, sensitivity, and C1/2 for organisms
| Organism | C1/2 (μM) | 1/α (μM) |
|---|---|---|
| L. lactis | 0.86 ± 0.03 | 0.21 ± 0.04 |
| M. tuberculosis | 0.86 ± 0.25 | 0.24 ± 0.11 |
| E. coli | 2.31 ± 0.14 | 0.68 ± 0.19 |
Data are means ± se. Sensitivity indicates the amount of LPC required for an e-fold change in calcein release, and C1/2 indicates the LPC concentration at which 50% of the final release occurs, derived by fitting with the Boltzmann function. These parameters correlate directly with channel activity.
To better understand the effect of LPC on individual MscL channels, we studied Tb-MscL, Ll-MscL, and Ec-MscL at the single-molecule level by patch-clamp electrophysiology in the presence and absence of LPC. If LPC activated MscL channels by generating tension in the lipid bilayer, our findings in ensemble measurements on the high sensitivity of Tb-MscL and Ll-MscL to LPC would suggest that these channels were more tension sensitive than that of Ec-MscL. Alternatively, easy opening with LPC could also be caused by a hydrophobic mismatch or an energetically more favorable relaxed conformation of Tb-MscL and Ll-MscL in the lipid bilayer. If any of these assumptions are correct, both Tb-MscL and Ll-MscL should be activated by less applied tension than Ec-MscL in patch-clamp experiments. In other words, there should be a left shift in their open probability vs. tension in the dose-response curves on activation of the channels with only applied tension. To this end, we generated GUVs from MscL-reconstituted azolectin LUVs as explained before (29). First, we tested the tension sensitivity of Tb-MscL and Ll-MscL relative to that of Ec-MscL in azolectin lipid bilayers by activating the homologs with negative pressure in inside-out patches. The open probability of the individual homologs was represented as a function of negative pressure applied to the lipid bilayer (Fig. 4A). The channel's open probability (Po) followed the Boltzmann distribution function. Unlike their response to LPC in ensemble measurements, both Tb-MscL and Ll-MscL channels required more tension to be activated than Ec-MscL in the patch clamp, consistent with previous electrophysiology measurements (41–43). The negative pressures at which half of the population of channels were activated (P1/2) were 155.75 ± 0.29 (mean±se, n=3) and 142.50 ± 1.76 mmHg (n=4) for Tb-MscL and Ll-MscL, respectively, whereas Ec-MscL required 95.17 ± 0.33 mmHg (n=6; Table 3). Because we used pipettes with the same tip radius for all 3 homologs and the experiments were performed multiple times with independent samples, we assume that the difference in the tension sensitivity is not due to the area of the patched lipid bilayer but is due to the tension sensitivity of the channels themselves.
Figure 4.

Comparison of open-channel probability and single-channel conductance of MscL homologs from WT E. coli, L. lactis, and M. tuberculosis. A) In presence of tension only. B) Corresponding full opening of MscL channels in patches excised from GUVs at pressure equal to their individual P1/2 values, triggered by tension only. Asterisks indicate detailed single-channel events. C) Magnified view of the position. D) Ec-MscL, Tb-MscL, and Ll-MscL triggered by tension and 9.5 μM LPC simultaneously. Open probability of channel is greatly affected when LPC is present along with tension. The general trend in MscL from all 3 organisms is that the Po curve shifts to the left significantly; i.e., the channel requires much less tension for activation. E, F) Corresponding full opening of MscL channels in patches excised from GUVs. Asterisks indicate detailed single-channel events.
Table 3.
Open probability and kinetics of MscL channels from different organisms
| Organism | Negative pressure |
Negative pressure and LPC |
|||||||
|---|---|---|---|---|---|---|---|---|---|
| P1/2 (mmHg) | τ1 (ms) | τ2 (ms) | Conductance, G (nS) | P1/2 (mmHg) | τ1 (ms) | τ2 (ms) | τ3 (ms) | Conductance, G (nS) | |
| M. tuberculosis | 155.75 ± 0.29 | <1 | <1 | 3.26 ± 0.10 | 35.06 ± 0.07 | <1 | 6.03 ± 1.47 (27) | 17.60 ± 7.36 (28) | 3.18 ± 1.09 |
| L. lactis | 142.50 ± 1.76 | <1 | 1.85 ± 0.18 (38) | 1.80 ± 0.27 | 78.24 ± 0.50 | <1 | 2.68 ± 0.21 (37) | 31.16 ± 3.50 (3) | 1.85 ± 0.33 |
| E. coli | 95.17 ± 0.33 | <1 | 3.95 ± 0.08 (49) | 3.70 ± 0.23 | 34.63 ± 0.48 | <1 | 8.73 ± 0.15 (41) | 47.82 ± 0.26 (23) | 3.92 ± 0.33 |
Data are means ± se (% normalized population). Open probability, dwell time, and single-channel conductance of MscL homologs activated by negative pressure or LPC plus with negative pressure are shown. The P1/2 of Ec-MscL is the lowest in the presence of negative pressure only, followed by Ll-MscL and Tb-MscL. On the other hand, activation of channels by negative pressure and 9.5 μM LPC has an overall significant impact on the P1/2 and dwell times of all MscL homologs, but the change is the greatest for Tb-MscL.
In accordance with previous reports (43–46), the conductance of Ec-MscL was 3.70 ± 0.23 nS, whereas conductances of Tb-MscL and Ll-MscL were 3.26 ± 0.10 and 1.80 ± 0.27 nS, respectively (Fig. 4B, C). The channel kinetics revealed that Ec-MscL has a stable, longer dwell time, whereas Tb-MscL and Ll-MscL showed a flickery behavior (Table 3).
Next, we performed patch-clamp experiments in the presence of LPC and generated open probability curves for individual homologs as a function of applied negative pressure. After inside-out patches were obtained, a 9.5 μM final concentration of LPC was added to the bath, and, within 1.5 min, negative suction was applied to generate the Po curves as explained before (17). As shown in Fig. 4D, all 3 channel homologs became more tension sensitive in the presence of LPC. The most significant shift was observed for Tb-MscL; its midpoint tension sensitivity changed 4.5-fold from P1/2 of 155.75 ± 0.29 mmHg (mean±se, n=3) when activated by negative pressure only to 35.06 ± 0.07 mmHg (n=5) in the presence of both negative pressure and LPC (Fig. 4D and Table 3). In the case of Ll-MscL, the sensitivity to tension in the presence of LPC increased almost 2-fold, and the change was 3-fold for Ec-MscL (Fig. 4D and Table 3). If the patches were incubated long enough, i.e., 20 min for Tb-MscL and Ll-MscL and 30 min for Ec-MscL, all 3 homologs could be activated with no applied tension, which is consistent with previous studies on Ec-MscL in a patch clamp (17, 47). The presence of LPC affected the channel kinetics. All 3 channels (Fig. 4E, F) had longer open dwell times (Table 3), suggesting a more stable open conformation.
Taken together, the patch-clamp results suggest that the following: both LPC and global tension in the bilayer individually activate the MscL channels; however, their modes of action are not the same because LPC cannot differentiate MscL homologs on the basis of their tension sensitivity in the way that applied tension does; LPC increases the tension sensitivity not only of Ec-MscL but also of Tb-MscL and Ll-MscL channels; LPC sensitivity of homologous MscL channels is not directly proportional to their tension sensitivities; and Tb-MscL and Ll-MscL behave more similarly to each other than to Ec-MscL when activated by tension or LPC.
MscL does not interact with LPC
LPC is a common activator of structurally different mechanosensitive membrane proteins; hence it is not expected to interact specifically with MscL channels (48, 49). However, to rule out any direct effect of LPC on MscL itself, we tested whether LPC could interact with MscL and open it by EPR spectroscopy. MscL was labeled with a spin probe on one of its mobile amino acid positions as defined before (12), and the mobility of the probe was followed when the protein was embedded in detergent or liposomes. The probe mobility changed on addition of LPC only when the channel was in liposomes (Supplemental Fig. S3), indicating that LPC by itself does not activate MscL. In addition, we explored LPC MscL interactions using CG Martini (30–32) simulations. With use of the Martini force field, it is possible to gate MscL channels (Fig. 1). MscL was embedded in a bilayer and simulated with and without tension, as described in Yefimov et al. (34) and Louhivuori et al. (35) but with an additional 10 mol% LPC inserted on the periplasmic side of the membrane (Supplemental Fig. S4). No specific interactions of LPC with MscL were found. Indeed, when the density of LPC relative to the bulk lipid was explored, a small reduction (∼15%) in LPC occupancy was observed at the MscL bilayer interface, both without tension around closed MscL and with tension around open MscL (Supplemental Fig. S4B). Taken together, the results show that LPC requires a lipid bilayer to show its effect on MscL gating.
DISCUSSION
In this study we showed that the asymmetric insertion of LPC into a lipid bilayer activates mechanosensitive channels from different organisms with a mechanism that is different than that of applied pressure. In the patch clamp, the negative pressure applied on a patch pipette generates global tension on the membrane adhered to the glass and activates membrane-embedded ion channels on the basis of their tension sensitivity. The effect of LPC, on the other hand, is not solely dependent on tension sensitivity in all cases. In the case of E. coli mutants, asymmetric insertion of LPC could activate the channel on the basis of their tension sensitivity; the more tension sensitive the channel, the less the amount of LPC required for its activation (Fig. 2). However, in the case of homologous MscL channels from M. tuberculosis and L. lactis, which have tension sensitivity similar to that for the E. coli LOF mutant G22C, LPC activation was not proportional to the tension sensitivity of these channels. Both Tb-MscL and Ll-MscL could be activated with significantly lower LPC concentrations than Ec-MscL (Fig. 3). Taken together, our results show that LPC differentially activates MscL channels and does not mimic the global tension in the lipid bilayer.
The LPC effect on MscL channels cannot be explained by the influence of LPC on the lipid bilayer only. The addition of LPC changes lipid bilayer properties (50–53), and some of these changes have been proposed as the mechanism of MscL activation by LPC (17, 54, 55) as bending of the membrane (55), changes in the surface tension (20), or changes in the lateral pressure profile (17, 53). However, in our experiments, these physical changes in lipid bilayer properties on LPC addition should be the same because the lipid and LPC amounts were the same in the experiments for all 3 homologous channels. As the response of these homologs to the effects of LPC varied, the MscL LPC interaction cannot be explained by changes in bilayer properties alone; the protein in the membrane should also be part of the explanation. Because we also showed that LPC is unlikely to have specific interactions with MscL, we consider the most plausible explanation for the LPC effect on MscL channels to be changes in the coupling between membrane and protein.
In general, changes in lipid composition and/or addition of amphiphiles can indirectly alter membrane protein function through the resulting changes in the protein-membrane coupling (56–58). The energetic cost of bilayer deformation and packing is often called the bilayer deformation energy or the protein bilayer line tension. Intuitively, the line tension is the circumferential tension at the perimeter of a channel protein generated as a result of its interaction with the boundary lipids (55, 59, 60) and is different for every channel in a given lipid composition (59). Previously, bilayer-dependent inhibition of mechanosensitive channels by an amphipathic peptide GsMTx4 was shown using gramicidin channels as probes for changes in bilayer properties (61). It was suggested that the adsorption of the amphipathic peptide may perturb the lipid packing adjacent to the channel protein and, as a result, alter the line tension of the mechanosensitive channel-bilayer interface and hence the channel gating (61).
Indeed, our observations could be rationalized by LPC-induced changes in the protein bilayer line tension. In the case of Ec-MscL tension-sensitive mutants, the channels differ from each other by only a single amino acid residue located at the pore, which is known not to be interacting with the lipid bilayer. Because the rest of the channel is exactly the same, tension-sensitive mutants of Ec-MscL should have the same protein-lipid interactions and, hence, the same line tension before LPC addition, unless the point mutation changes the conformation of the channel. On addition of a given concentration of LPC, the magnitude of the change in line tension should again be the same for each mutant; as the only difference among these channels is the strength of the forces in the pore that keeps the channel in its closed form, i.e., the hydrophobicity of the pore (8, 39). The pore of the GOF mutant is more hydrophilic; therefore, it requires less energy for activation. Indeed, C1/2 for LPC was the lowest for G22S, the GOF mutant. Similarly, LOF mutants have more hydrophobic pores, and therefore they are tightly closed and require higher energy for activation. This explains the higher C1/2 for LPC activation of G22C in our experiments (Fig. 2).
In case of MscL homologs, on the other hand, the protein bilayer line tension could be different for each homolog, even in the absence of LPC. Even though all 3 homologs share the same functionality, they share only 40% sequence identity (40, 41). The pore-forming half of these channels is well conserved; however, the upper part of the TM1 and TM2 helices, which interact with the lipid bilayer, differ (2). Therefore, Tb-MscL, Ll-MscL, and Ec-MscL can have different line tensions. As a result of this difference, independent of how strong or weak the hydrophobic interactions in their pore region are, these homologous MscLs already have different free energy requirements for their gating. Furthermore, since the channels differ from each other on their lipid-interacting face, the contribution of the effect of LPC to the deformation energy for each homologous channel is also different. The patch-clamp experiments in which we activated MscL channels with applied tension in the absence and presence of LPC allowed us to define the contribution of the line tension to the overall bilayer deformation energy relative to the applied tension; the biggest change in activity was for Tb-MscL, which was followed by Ll-MscL and Ec-MscL (Table 3). The amount of tension required to activate each channel was reduced 2–5 times in the presence of 9.5 μM LPC. Because Tb-MscL and Ll-MscL reacted to LPC in a similar fashion, we compared their amino acid sequences (Supplemental Fig. S5). Notably, the upper halves of the TM1 and TM2 helices are more alike in Tb-MscL and Ll-MscL than in Ec-MscL, which might explain the similar behavior of Tb-MscL and Ll-MscL in response to LPC.
Instead of invoking protein-lipid deformation energy or line tension as the primary driving force for LPC-induced channel gating, our results could also be explained through coupling of the bilayer pressure profile and shape changes of the channels during gating. A recent computational study on MscL channel gating found that protein shape change was a major contributor to its free energy of gating (62), in particular through shape changes occurring at the lipid-water interface, which is characterized by a large negative lateral pressure component. For MscL, the protein area change on gating is estimated to be around ΔA = 5 nm2 at the interface. If LPC affects the lateral pressure in this region, the gating free energy of the channel changes, depending on the adapted shape of the protein. Indeed, in another computational study, it has been found that asymmetric addition of LPC caused a considerable asymmetric shift in the bilayer lateral pressure profile (53), a change of about ΔP = 100 bar at the interface. Together these studies suggest that the influence of LPC on the pressure profile would contribute roughly ΔA · Δp · l = 15 kJ/mol to MscL gating (assuming an interfacial width l = 0.5 nm). Depending on the details of the shape differences, which are currently unknown, the exact contribution will vary among different MscL homologs and account for the observed changes in their sensitivity to LPC. However, different experiments are required to check these possibilities.
In summary, we have shown that LPC can be used to activate individual MscL channels in a controlled fashion in the absence of tension. Furthermore, our results indicate that the effect of LPC may strongly depend on the properties of the protein-membrane coupling. The addition of LPC changes lipid bilayer properties and may affect the interfacial line tension between the protein and the bilayer. These changes will alter the free energy required to open the channel. LPC can be used to study more tension-insensitive MscL channels at lower applied tension. Finally, even though Tb-MscL and Ll-MscL are less tension sensitive relative to Ec-MscL, they are more sensitive to the presence of LPC. It is then intriguing to consider whether these channels may have other activators in their native environment.
Supplementary Material
Acknowledgments
The authors thank G. T. Robillard for critical reading of the manuscript.
This work was supported by a Rubicon grant from the Netherlands Organization for Scientific Research (to H.I.I.) and European Research Council-Ideas Program Starting Grant 208814 (to A.K.).
Author contributions: N.M. and A.K. designed the research; N.M. performed fluorescence experiments and analyzed data; M.D.J. and J.P.B. performed patch-clamp experiments; N.M. and A.K. analyzed patch-clamp data; A.D. performed EPR experiments; N.M. and M.W. designed the CMC experiment; N.M. determined the CMC of LPC; C.A., H.I.I., and S.J.M. performed and analyzed MD simulations; and N.M. and A.K. wrote the manuscript with input from all coauthors. The authors declare no conflicts of interest.
This article includes supplemental data. Please visit http://www.fasebj.org to obtain this information.
- CG
- coarse-grained
- CMC
- critical micellar concentration
- CV
- column volume
- DOPC
- 1,2-dioleoyl-sn-glycero-3-phosphocholine
- Ec-MscL
- Escherichia coli mechanosensitive channel of large conductance
- EPR
- electron paramagnetic resonance
- GOF
- gain of function
- GUV
- giant unilamellar liposome
- LB
- Luria-Bertani
- Ll-MscL
- Lactococcus lactis mechanosensitive channel of large conductance
- LOF
- loss of function
- LPC
- l-α-lysophosphatidylcholine
- LUV
- large unilamellar vesicle
- MD
- molecular dynamics
- MscL
- mechanosensitive channel of large conductance
- MTSSL
- (1-oxyl-2,2,5,5-tetramethylpyrrolin-3-yl)methyl methanethiosulfonate
- Ni-NTA
- nickel-nitriloacetic acid
- Tb-MscL
- Mycobacterium tuberculosis mechanosensitive channel of large conductance
- TM
- transmembrane
- WT
- wild type
REFERENCES
- 1. Kung C., Martinac B., Sukharev S. (2010) Mechanosensitive channels in microbes. Annu. Rev. Microbiol. 64, 313–329 [DOI] [PubMed] [Google Scholar]
- 2. Chang G., Spencer R. H., Lee A. T., Barclay M. T., Rees D. C. (1998) Structure of the MscL homolog from Mycobacterium tuberculosis: a gated mechanosensitive ion channel. Science 282, 2220–2226 [DOI] [PubMed] [Google Scholar]
- 3. Blount P., Sukharev S. I., Schroeder M. J., Nagle S. K., Kung C. (1996) Single residue substitutions that change the gating properties of a mechanosensitive channel in Escherichia coli. Proc. Natl. Acad. Sci. U.S.A. 93, 11652–11657 [DOI] [PMC free article] [PubMed] [Google Scholar]
- 4. Cruickshank C. C., Minchin R. F., Le Dain A. C., Martinac B. (1997) Estimation of the pore size of the large-conductance mechanosensitive ion channel of Escherichia coli. Biophys. J. 73, 1925–1931 [DOI] [PMC free article] [PubMed] [Google Scholar]
- 5. van den Bogaart G., Krasnikov V., Poolman B. (2007) Dual-color fluorescence-burst analysis to probe protein efflux through the mechanosensitive channel MscL. Biophys. J. 92, 1233–1240 [DOI] [PMC free article] [PubMed] [Google Scholar]
- 6. Mika J. T., Birkner J. P., Poolman B., Koçer A. (2013) On the role of individual subunits in MscL gating: “all for one, one for all?” FASEB J. 27, 882–892 [DOI] [PubMed] [Google Scholar]
- 7. Blount P., Moe P. C. (1999) Bacterial mechanosensitive channels: Integrating physiology, structure and function. Trends Microbiol. 7, 420–424 [DOI] [PubMed] [Google Scholar]
- 8. Yoshimura K., Batiza A., Schroeder M., Blount P., Kung C. (1999) Hydrophilicity of a single residue within MscL correlates with increased channel mechanosensitivity. Biophys. J. 77, 1960–1972 [DOI] [PMC free article] [PubMed] [Google Scholar]
- 9. Sukharev S., Durell S. R., Guy H. R. (2001) Structural models of the MscL gating mechanism. Biophys. J. 81, 917–936 [DOI] [PMC free article] [PubMed] [Google Scholar]
- 10. Sukharev S., Betanzos M., Chiang C. S., Guy H. R. (2001) The gating mechanism of the large mechanosensitive channel MscL. Nature 409, 720–724 [DOI] [PubMed] [Google Scholar]
- 11. Corry B., Hurst A. C., Pal P., Nomura T., Rigby P., Martinac B. (2010) An improved open-channel structure of MscL determined from FRET confocal microscopy and simulation. J. Gen. Physiol. 136, 483–494 [DOI] [PMC free article] [PubMed] [Google Scholar]
- 12. Perozo E., Cortes D. M., Sompornpisut P., Kloda A., Martinac B. (2002) Open channel structure of MscL and the gating mechanism of mechanosensitive channels. Nature 418, 942–948 [DOI] [PubMed] [Google Scholar]
- 13. Betanzos M., Chiang C. S., Guy H. R., Sukharev S. (2002) A large iris-like expansion of a mechanosensitive channel protein induced by membrane tension. Nat. Struct. Biol. 9, 704–710 [DOI] [PubMed] [Google Scholar]
- 14. Chiang C. S., Anishkin A., Sukharev S. (2004) Gating of the large mechanosensitive channel in situ: Estimation of the spatial scale of the transition from channel population responses. Biophys. J. 86, 2846–2861 [DOI] [PMC free article] [PubMed] [Google Scholar]
- 15. Gullingsrud J., Kosztin D., Schulten K. (2001) Structural determinants of MscL gating studied by molecular dynamics simulations. Biophys. J. 80, 2074–2081 [DOI] [PMC free article] [PubMed] [Google Scholar]
- 16. Gullingsrud J., Schulten K. (2004) Lipid bilayer pressure profiles and mechanosensitive channel gating. Biophys. J. 86, 3496–3509 [DOI] [PMC free article] [PubMed] [Google Scholar]
- 17. Perozo E., Kloda A., Cortes D. M., Martinac B. (2002) Physical principles underlying the transduction of bilayer deformation forces during mechanosensitive channel gating. Nature 9, 696–703 [DOI] [PubMed] [Google Scholar]
- 18. Martinac B., Adler J., Kung C. (1990) Mechanosensitive ion channels of E. coli activated by amphipaths. Nature 348, 261–263 [DOI] [PubMed] [Google Scholar]
- 19. Vasquez V., Sotomayor M., Cordero-Morales J., Schulten K., Perozo E. (2008) A structural mechanism for MscS gating in lipid bilayers. Science 321, 1210–1214 [DOI] [PMC free article] [PubMed] [Google Scholar]
- 20. Yoshimura K., Sokabe M. (2010) Mechanosensitivity of ion channels based on protein-lipid interactions. J. R. Soc. Interface 7(Suppl. 3), S307–S320 [DOI] [PMC free article] [PubMed] [Google Scholar]
- 21. Birkner J. P., Poolman B., Koçer A. (2012) Hydrophobic gating of mechanosensitive channel of large conductance evidenced by single-subunit resolution. Proc. Natl. Acad. Sci. U.S.A. 109, 12944–12949 [DOI] [PMC free article] [PubMed] [Google Scholar]
- 22. Guzman L. M., Belin D., Carson M. J., Beckwith J. (1995) Tight regulation, modulation, and high-level expression by vectors containing the arabinose PBAD promoter. J. Bacteriol. 177, 4121–4130 [DOI] [PMC free article] [PubMed] [Google Scholar]
- 23. Stothard P. (2000) The sequence manipulation suite: JavaScript programs for analyzing and formatting protein and DNA sequences. BioTechniques 28, 1102, 1104 [DOI] [PubMed] [Google Scholar]
- 24. Koçer A., Walko M., Feringa B. L. (2007) Synthesis and utilization of reversible and irreversible light-activated nanovalves derived from the channel protein MscL. Nat. Protoc. 2, 1426–1437 [DOI] [PubMed] [Google Scholar]
- 25. Dominguez A., Fernandez A., Gonzalez N., Iglesias E., Montenegro L. (1997) Determination of critical micelle concentration of some surfactants by three techniques. Chem. Educ. J. 74, 1227–1231 [Google Scholar]
- 26. Schneider C. A., Rasband W. S., Eliceiri K. W. (2012) NIH image to ImageJ: 25 years of image analysis. Nat. Methods 9, 671–675 [DOI] [PMC free article] [PubMed] [Google Scholar]
- 27. Hubbell W. L., Cafiso D. S., Altenbach C. (2000) Identifying conformational changes with site-directed spin labeling. Nat. Struct. Biol. 7, 735–739 [DOI] [PubMed] [Google Scholar]
- 28. Bordignon E. (2012) Site-directed spin labeling of membrane proteins. Top. Curr. Chem. 321, 121–157 [DOI] [PubMed] [Google Scholar]
- 29. Girard P., Pecreaux J., Lenoir G., Falson P., Rigaud J. L., Bassereau P. (2004) A new method for the reconstitution of membrane proteins into giant unilamellar vesicles. Biophys. J. 87, 419–429 [DOI] [PMC free article] [PubMed] [Google Scholar]
- 30. Marrink S. J., Risselada H. J., Yefimov S., Tieleman D. P., de Vries A. H. (2007) The Martini force field: coarse grained model for biomolecular simulations. J. Phys. Chem. B 111, 7812–7824 [DOI] [PubMed] [Google Scholar]
- 31. Marrink S. J., de Vries A. H., Mark A. E. (2004) Coarse grained model for semiquantitative lipid simulations. J. Phys. Chem. B 108, 750–760 [Google Scholar]
- 32. Monticelli L., Kandasamy S. K., Periole X., Larson R. G., Tieleman D. P., Marrink S. (2008) The Martini coarse-grained force field: extension to proteins. J. Chem. Theory Comput. 4, 819–834 [DOI] [PubMed] [Google Scholar]
- 33. Hess B., Kutzner C., van der Spoel D., Lindahl E. (2008) Gromacs 4: Algorithms for highly efficient, load-balanced, and scalable molecular simulation. J. Chem. Theory. Comput. 4, 435–447 [DOI] [PubMed] [Google Scholar]
- 34. Yefimov S., van der Giessen E., Onck P. R., Marrink S. J. (2008) Mechanosensitive membrane channels in action. Biophys. J. 94, 2994–3002 [DOI] [PMC free article] [PubMed] [Google Scholar]
- 35. Louhivuori M., Risselada H. J., van der Giessen E., Marrink S. J. (2010) Release of content through mechano-sensitive gates in pressurized liposomes. Proc. Natl. Acad. Sci. U. S. A. 107, 19856–19860 [DOI] [PMC free article] [PubMed] [Google Scholar]
- 36. Steinbacher S., Bass R., Strop P., Rees D. C. (2007) Structures of the prokaryotic mechanosensitive channels MscL and MscS. Curr. Top. Membr. 58, 1–24 [Google Scholar]
- 37. Berendsen H. J. C., Postma J. P. M., van Gunsteren W. F., DiNola A., Haak J. R. (1984) Molecular dynamics with coupling to an external bath. J. Chem. Phys. 81, 3684–3690 [Google Scholar]
- 38. Humphrey W., Dalke A., Schulten K. (1996) VMD: visual molecular dynamics. J. Mol. Graph. 14, 33−38 [DOI] [PubMed] [Google Scholar]
- 39. Ou X., Blount P., Hoffman R. J., Kung C. (1998) One face of a transmembrane helix is crucial in mechanosensitive channel gating. Proc. Natl. Acad. Sci. U. S. A. 95, 11471–11475 [DOI] [PMC free article] [PubMed] [Google Scholar]
- 40. Maurer J. A., Elmore D. E., Lester H. A., Dougherty D. A. (2000) Comparing and contrasting Escherichia coli and Mycobacterium tuberculosis mechanosensitive channels (MscL)—new gain of function mutations in the loop region. J. Biol. Chem. 275, 22238–22244 [DOI] [PubMed] [Google Scholar]
- 41. Moe P. C., Levin G., Blount P. (2000) Correlating a protein structure with function of a bacterial mechanosensitive channel. J. Biol. Chem. 275, 31121–31127 [DOI] [PubMed] [Google Scholar]
- 42. Folgering J. H., Moe P. C., Schuurman-Wolters G. K., Blount P., Poolman B. (2005) Lactococcus lactis uses MscL as its principal mechanosensitive channel. J. Biol. Chem. 280, 8784–8792 [DOI] [PubMed] [Google Scholar]
- 43. Moe P. C., Blount P., Kung C. (1998) Functional and structural conservation in the mechanosensitive channel MscL implicates elements crucial for mechanosensation. Mol. Microbiol. 28, 583–592 [DOI] [PubMed] [Google Scholar]
- 44. Martinac B., Buechner M., Delcour A. H., Adler J., Kung C. (1987) Pressure-sensitive ion channel in Escherichia coli. Proc. Natl. Acad. Sci. U.S.A. 84, 2297–2301 [DOI] [PMC free article] [PubMed] [Google Scholar]
- 45. Sukharev S. I., Martinac B., Arshavsky V. Y., Kung C. (1993) Two types of mechanosensitive channels in the Escherichia coli cell envelope: solubilization and functional reconstitution. Biophys. J. 65, 177–183 [DOI] [PMC free article] [PubMed] [Google Scholar]
- 46. Hase C. C., Le Dain A. C., Martinac B. (1995) Purification and functional reconstitution of the recombinant large mechanosensitive ion channel (MscL) of Escherichia coli. J. Biol. Chem. 270, 18329–18334 [DOI] [PubMed] [Google Scholar]
- 47. Nomura T., Cranfield C. G., Deplazes E., Owen D. M., Macmillan A., Battle A. R., Constantine M., Sokabe M., Martinac B. (2012) Differential effects of lipids and lyso-lipids on the mechanosensitivity of the mechanosensitive channels MscL and MscS. Proc. Natl. Acad. Sci. U. S. A. 109, 8770–8775 [DOI] [PMC free article] [PubMed] [Google Scholar]
- 48. Machiyama H., Tatsumi H., Sokabe M. (2009) Structural changes in the cytoplasmic domain of the mechanosensitive channel MscS during opening. Biophys. J. 97, 1048–1057 [DOI] [PMC free article] [PubMed] [Google Scholar]
- 49. Maingret F., Patel A. J., Lesage F., Lazdunski M., Honore E. (2000) Lysophospholipids open the two-pore domain mechano-gated K+ channels TREK-1 and TRAAK. J. Biol. Chem. 275, 10128–10133 [DOI] [PubMed] [Google Scholar]
- 50. Mandersloot J. G., Reman F. C., Van Deenen L. L., De Gier J. (1975) Barrier properties of lecithin/lysolecithin mixtures. Biochim. Biophys. Acta 382, 22–26 [DOI] [PubMed] [Google Scholar]
- 51. Morris D. A., McNeil R., Castellino F. J., Thomas J. K. (1980) Interaction of lysophosphatidylcholine with phosphatidylcholine bilayers. A photo-physical and NMR study. Biochim. Biophys. Acta 599, 380–390 [DOI] [PubMed] [Google Scholar]
- 52. Zhelev D. V. (1998) Material property characteristics for lipid bilayers containing lysolipid. Biophys. J. 75, 321–330 [DOI] [PMC free article] [PubMed] [Google Scholar]
- 53. Esteban-Martin S., Risselada H. J., Salgado J., Marrink S. J. (2009) Stability of asymmetric lipid bilayers assessed by molecular dynamics simulations. J. Am. Chem. Soc. 131, 15194–15202 [DOI] [PubMed] [Google Scholar]
- 54. Yoo J., Cui Q. (2009) Curvature generation and pressure profile modulation in membrane by lysolipids: insights from coarse-grained simulations. Biophys. J. 97, 2267–2276 [DOI] [PMC free article] [PubMed] [Google Scholar]
- 55. Wiggins P., Phillips R. (2004) Analytic models for mechanotransduction: gating a mechanosensitive channel. Proc. Natl. Acad. Sci. U. S. A. 101, 4071–4076 [DOI] [PMC free article] [PubMed] [Google Scholar]
- 56. Lundbaek J. A., Collingwood S. A., Ingólfsson H. I., Kapoor R., Andersen O. S. (2010) Lipid bilayer regulation of membrane protein function: gramicidin channels as molecular force probes. J. R. Soc. Interface 7, 373–395 [DOI] [PMC free article] [PubMed] [Google Scholar]
- 57. Lee A. G. (2004) How lipids affect the activities of integral membrane proteins. Biochim. Biophys. Acta 1666, 62–87 [DOI] [PubMed] [Google Scholar]
- 58. Marsh D. (2008) Protein modulation of lipids, and vice-versa, in membranes. Biochim. Biophys. Acta 1778, 1545–1575 [DOI] [PubMed] [Google Scholar]
- 59. Markin V. S., Sachs F. (2004) Thermodynamics of mechanosensitivity. Phys. Biol. 1, 110–124 [DOI] [PubMed] [Google Scholar]
- 60. Sachs F. (2010) Stretch-activated ion channels: What are they? Physiology 25, 50–56 [DOI] [PMC free article] [PubMed] [Google Scholar]
- 61. Suchyna T. M., Tape S. E., Koeppe R. E., 2nd, Andersen O. S., Sachs F., Gottlieb P. A. (2004) Bilayer-dependent inhibition of mechanosensitive channels by neuroactive peptide enantiomers. Nature 430, 235–240 [DOI] [PubMed] [Google Scholar]
- 62. Ollila O. H. S., Louhivuori M., Marrink S. J., Vattulainen I. (2011) Protein shape change has a major effect on the gating energy of a mechanosensitive channel. Biophys. J. 100, 1651–1659 [DOI] [PMC free article] [PubMed] [Google Scholar]
Associated Data
This section collects any data citations, data availability statements, or supplementary materials included in this article.