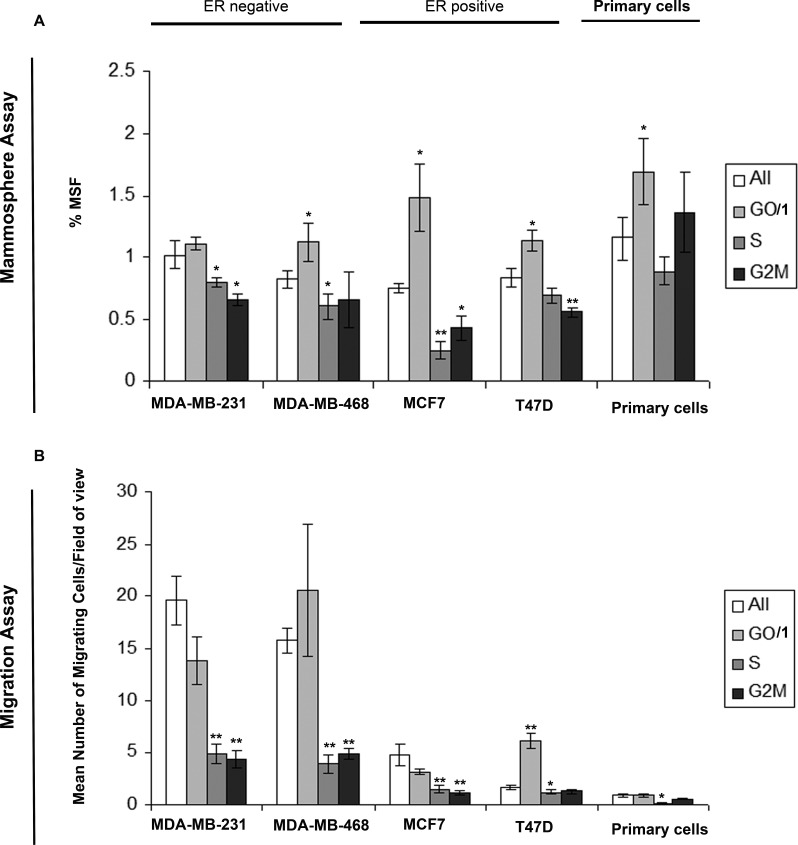
Figure 1. Cells within G0/1 cell cycle phase show increased mammosphere formation and migration.
Breast cell lines (MDA-MB-231, MDA-MB-468, MCF7 and T47D) and primary human breast cancer cells were live cell sorted by FACS according to DNA profiles (Hoechst staining) into G0/1, S, G2/M and for comparison the whole cell population (all). (A) mammosphere formation and (B) transwell migration assayed. Bar charts represent the mean number of migrated cells/field of view and % mammosphere formation, ±SEM. p values were generated using a two sided t-test assuming equal variance. * indicates significance, p<0.05.

