

Abstract
Background.
To compare the effect of obesity and related risk factors on 10-year mortality in two cohorts of older adults of African descent; one from the United States and one from Nigeria.
Methods.
Study participants were community residents aged 70 or older of African descent living in Indianapolis, Indiana (N = 1,269) or Ibadan, Nigeria (1,197). We compared survival curves between the two cohorts by obesity class and estimated the effect of obesity class on mortality in Cox proportional hazards models controlling for age, gender, alcohol use, and smoking history, and the cardiometabolic biomarkers blood pressure, triglycerides, high-density lipoprotein, low-density lipoprotein, and C-reactive protein.
Results.
We found that underweight was associated with an increased risk of death in both the Yoruba (hazards ratio = 1.35, 95% confidence interval: 1.12–1.63) and African American samples (hazards ratio = 2.49, 95% confidence interval: 1.40–4.43) compared with those with normal weight. The overweight and obese participants in both cohorts experienced survival similar to the normal weight participants. Controlling for cardiometabolic biomarkers had little effect on the obesity-specific hazard ratios in either cohort.
Conclusions.
Despite significant differences across these two cohorts in terms of obesity and biomarker levels, overall 10-year survival and obesity class–specific survival were remarkably similar.
Key Words: Older adults, African, Obesity, Mortality, Biomarkers.
Obesity is a long-established risk factor for disease, but evidence has raised questions about excess weight, including mild obesity, as a risk factor for mortality in older adults (1). Although the findings of two recent meta-analyses of body mass index (BMI) and mortality conflict slightly in regard to older adults (2,3), the largest and most recent of the two which used measured height and weight showed overweight was associated with less mortality risk and obesity was not associated with risk in comparison to normal BMI (3). Findings regarding BMI and mortality are even more striking for African American adults (4). Overweight and class I obesity (and class II obesity among women) were recently shown to be associated with less mortality than normal weight (5). These findings were based on a cohort study with a 7-year follow-up of over 50,000 men and women and were similar when restricted to adults of older ages. These counterintuitive findings may be understood under what has been termed an obesity paradox (6).
The obesity paradox refers to the observation that BMI has an inverse association with mortality among adults with chronic illness and among older adults. Some have hypothesized this to be a spurious finding; lower weight adults have advanced illness and BMI serves as a proxy for illness severity (7). African Americans and older adults have relatively high rates of chronic illness so this hypothesis may be playing out in these subpopulations.
Others have hypothesized that older adults benefit from excess adiposity, which provides more energy reserves to fight off acute illness (8). A very recent study showed that lower density tissue determined from computed tomography imaging, an indication of greater fat content, was associated with less mortality (9). Another hypothesis is that BMI is a poor proxy for excess body fat and does not capture nuances of fat storage (10). Biomarkers such as triglycerides, high-density lipoprotein (HDL), and C-reactive protein may better represent fat storage and risk (11,12).
In an effort to shed light on the so-called obesity paradox among African Americans, we compared the effect of obesity and related risk factors on mortality in older adults of African descent who resided in the Midwestern United States (Indianapolis) and older Yorubas who resided in Ibadan, Nigeria. In contrast to Indianapolis’ obesogenic environment, Ibadan can be characterized as a leptogenic environment. An obesogenic environment is one in which energy dense foods are palatable and relatively inexpensive and where daily physical activity demands are low for a majority of inhabitants. For unknown reasons, African Americans, particularly women, have proven to be particularly susceptible to the obesogenic environment of the United States (13). The leptogenic environment that the Yoruba of Ibadan experience, on the other hand, offers limited opportunity for energy dense foods and involves significant daily energy expenditure (14).
Given these contrasting environments, the two cohorts have very different levels of obesity. In fact, the BMI distributions of the two samples overlap little. In the Ibadan sample, over three fourths have a BMI that classifies as underweight or normal weight according to World Health Organization guidelines. In the Indianapolis sample, over three fourths have a BMI of overweight or obesity. The two cohorts also have different cardiometabolic biomarker risk factor levels with Ibadan generally having much more favorable levels than Indianapolis.
In light of the current literature and these contrasting environments and biomarker profiles, we tested four hypotheses in these two samples of older adults: (a) underweight adults have higher rates of chronic illness, (b) older Yorubas who were underweight or normal weight at baseline did not experience greater mortality in comparison to overweight or obese Yorubas, (c) obese older adults experience less mortality in comparison to normal weight older adults (fat confers survival), and (d) there is no association between BMI and mortality but a significant association between biomarker levels and mortality.
Methods
Study Populations
Data are from the Indianapolis–Ibadan Dementia Project, a population-based comparative epidemiological study of risk factors for dementia. Study participants were community residents aged 70 or older of African descent living in Indianapolis, Indiana, or Ibadan, Nigeria. The first cohorts were recruited in 1992. In 2001, survivors of the original cohorts were reinterviewed, and new participants were added. For the analyses reported here, we used the 1992 survivors available in 2001 and the 2001 cohort with 10-year mortality follow-up. Details of the study methodology have been described elsewhere (15). The study was approved by the Ethics Committee of the University of Ibadan/University College Hospital, Ibadan, Nigeria, as well as the Indiana University-Purdue University of Indianapolis Institutional Review Board. All enrolled participants provided informed consent for each phase of the study.
In the first recruitment in 1992, a cohort of African Americans aged 65 or older living in Indianapolis were enrolled in the study. The geographic target area used in the study consisted of 29 contiguous census tracts in which African Americans represented 80% of the population in the 1990U.S. census. Interviewers went door to door to randomly sampled addresses to invite African Americans aged 65 and older to participate. In 1992, 2,212 individuals were enrolled while 249 (9.6%) refused and 121 (4.7%) were too sick to participate. In the 2001 Indianapolis recruitment, potential study participants were screened for age, ethnicity, and county of residence from Medicare beneficiary files. There were 4,433 older adults meeting criteria and not already in our study that were contacted. A slight majority either refused (2,020) or was too ill, dead, or in a nursing home (523). There were 1,893 (43%) who agreed to participate and were enrolled in the study.
In Ibadan, a census was conducted in contiguous, politically defined geographic districts populated by the Yoruba. With the approval of community leaders, the study was highly regarded in the community and no one refused. In 1992, 2,486 participants were enrolled, and in 2001, 1,939 participants were enrolled.
In 2001, a separate consent for blood draw was completed in survivors and new enrollees. In Indianapolis, 1,516 of 2,631 surviving participants from both enrollments consented to the blood draw and 1,254 of 2,807 consented in Ibadan. For this analysis, we required biomarker data ascertained from the blood draw. Missing data, primarily blood pressure and C-reactive protein, in Indianapolis left a sample for the analyses reported here of 1,269 (83.7%). Missing data in the Ibadan sample, primarily C-reactive protein, left 1,197 (95.5%) for our analyses. See Figure 1; more study details are available in prior publications (15–17).
Figure 1.
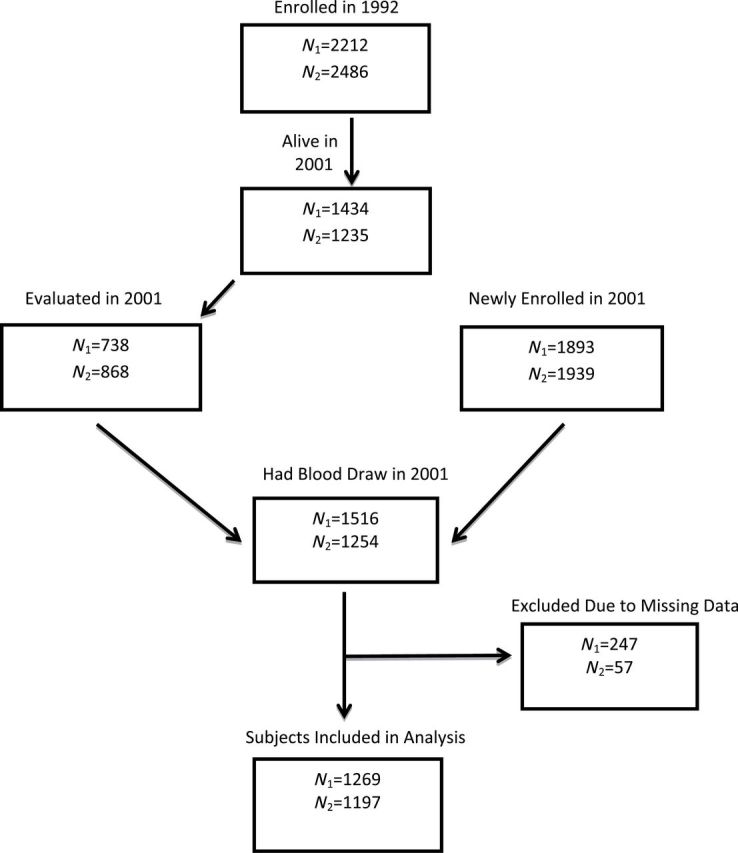
Sample size and recruitment flow diagram (N 1 = Indianapolis; N 2 = Ibadan).
Measures
Date of birth for Indianapolis participants was available from the Medicare files and confirmed by the participants. A standard practice for establishing date of birth among adults in Nigeria is from a table of historical landmarks well known to the population. This is a well-tested practice (18). In the Indianapolis cohort, date of death was obtained from obituaries and the Indiana State Vital Statistics. For the Ibadan cohort, interviewers monitored the community daily and recorded all deaths. The surviving participants from the Ibadan cohort were censored at the participant’s last visit, while those from Indianapolis were censored on the last day of the project in Ibadan, August 26, 2011.
At both sites, the participant or a family member responded to the questions “Do or did you drink alcoholic beverages” and “Has there ever been a period when you smoked cigarettes, cigars, a pipe, chewing tobacco, or snuff nearly every day?” BMI was determined from height and weight measurements and categorized according to the World Health Organization criteria (19) into underweight (<18.5), normal (18.5–24.9), overweight (25–29.9), and obese (≥30). Blood pressure was taken by trained interviewers with Omron digital units. In both samples, history of disease, illness, and injury was obtained by self- or proxy report. We included in this report history of angina, arthritis, depression, diabetes, epilepsy, head injury, heart attack, hypertension, kidney disease, liver disease, lung disease, Parkinson’s disease, stroke, thyroid disease, vascular disease, cancer, and heart problems.
Blood samples were drawn in 10-mL EDTA Vacutainer tubes. The specimens were transported on ice from the field to the laboratory at Ibadan University College Hospital. In the laboratory, erythrocytes, buffy coat, and plasma were separated. After labeling the plasma and buffy coat tubes with a unique bar code for each participant, the samples were stored in a −70°C freezer. Samples were shipped to Indiana University in approved blood shipping containers with dry ice and arrived usually within 3 days. Samples from Indianapolis were directly processed at Indiana University. Triglyceride and HDL cholesterol levels were determined by using commercial kits from Roche Diagnostics (Indianapolis, IN). Low-density lipoprotein (LDL) cholesterol levels were calculated by using the Friedewald equation. C-reactive protein was determined by using a commercial kit from BioRad, Hercules, CA.
Analysis
We first provide descriptive data and make comparisons across the cohorts on each of the variables using t tests for continuous variables and chi-square tests for categorical variables. Cox’s proportional hazard models were used with time to death from baseline as the outcome variable, and BMI groups as the independent variable in each cohort adjusting for age, gender, smoking history, and alcohol use. A global test of the proportional hazards assumption was performed by including time-dependent covariates representing interactions between a function of time and each independent variable. The normal weight group was designated as the reference group. To account for potential reverse causality in the relationship between BMI and serious illness, we reran the multivariate models excluding those who died within the first year of follow-up. We also investigated disease rates and biomarker levels of underweight, overweight, and obese participants from Indianapolis and Ibadan in comparison to normal weight participants using logistic regression and analysis of covariance models for each cohort. Finally, we present the results of multivariate cox proportional hazards models of death comparing hazard ratios (HRs) of select biomarkers and patient characteristics and BMI in each cohort. HR, 95% confidence intervals (CI), and p values are reported from the survival models. Log-rank tests were used to compare survival curves using Kaplan–Meier estimator between the BMI groups for each cohort.
Results
Table 1 shows that the prevalence of ever smoking and any alcohol use were considerably lower in the Yoruba. As noted earlier, BMI was dramatically different; 25% of the Yoruba had a BMI in the underweight category while just 1.3% of the African Americans did. Fifty-four percent of the Yoruba were in the normal weight category while 21% of the African Americans were in the normal weight category. African Americans were twice as likely to be overweight and over 7 times more likely to be obese in comparison to the Yoruba. The African American cohort had significantly lower mean blood pressure readings, but 77% reported use of antihypertensive medications (data not shown). The Yoruba rarely receive pharmaceutical treatment for high blood pressure and when they do it is not sustained in many due to affordability. Finally, in comparison to the Yoruba, African Americans had significantly higher LDL, triglycerides, and C-reactive protein.
Table 1.
Comparison of Mortality, Baseline Demographics, Body Mass Index, and Biomarker Measures in Yoruba-Nigerian (N = 1,197) and African American (N = 1,269) Samples
| Yoruba (N = 1,197) | African American (N = 1,269) | p Value | |
|---|---|---|---|
| Died within 10 years, % | 47.0 | 43.6 | .0926 |
| Age, mean (SD) | 76.5 (5.3) | 77.6 (5.2) | <.0001 |
| Female, % | 66.6 | 66.4 | .9031 |
| Use any alcohol, % | 21.7 | 55.2 | <.0001 |
| Ever smoked, % | 38.4 | 56.9 | <.0001 |
| BMI, mean (SD) | 22.3 (4.7) | 29.8 (6.0) | <.0001 |
| Underweight (BMI ≤ 18.5), % | 25.1 | 1.3 | |
| Normal weight (BMI 18.5–24.9), % | 54.2 | 20.9 | |
| Overweight (BMI 25–29.9), % | 15.0 | 34.1 | |
| Obese (BMI ≥ 30), % | 5.7 | 43.7 | |
| Systolic blood pressure, mean (SD) | 152.5 (30.8) | 145.5 (21.7) | <.0001 |
| Diastolic blood pressure, mean (SD) | 85.2 (15.4) | 78.9 (11.4) | <.0001 |
| Triglycerides, mean (SD) | 89.6 (36.7) | 114.2 (55.7) | <.0001 |
| High-density lipoprotein, mean (SD) | 50.1 (13.8) | 51.3 (15.6) | .0520 |
| Low-density lipoprotein, mean (SD) | 107.0 (33.3) | 112.7 (34.3) | <.0001 |
| C-reactive protein, mean (SD) | 8.0 (18.6) | 13.8 (26.0) | <.0001 |
Note: BMI, body mass index; SD, standard deviation.
Although 1.1 years younger on average, the Yoruba experienced a statistically similar 10-year mortality rate as the African Americans (Table 1). Figure 2 shows survival curves by BMI class separately for the Yoruba and African American cohorts. As can be seen, the overweight and obese participants in both cohorts experienced survival similar to the normal weight participants, whereas the underweight experienced higher mortality.
Figure 2.

Survival curves for underweight, normal weight, overweight, and obese for Yoruba-Nigerian and African American samples. Log rank p values for both the Ibadan-Nigerian and African American samples were less than .001.
Hypothesis 1, that underweight adults have higher rates of chronic illness, is not supported. The only diseases, illnesses, or injuries that were significantly elevated for the underweight compared with the normal weight class in the Indianapolis sample were depression (24% vs 8%) and liver disease (12% vs 1%; see Table 2). In the Yoruba, none of the 17 diseases, illnesses, or injuries was elevated in the underweight compared with normal weight Yoruba participants. In fact, hypertension was less prevalent in the underweight. Of the biomarkers blood pressure, triglycerides, HDL and LDL cholesterol, and CRP, the only one that differed significantly between the underweight and normal weight respondents in both cohorts was HDL cholesterol, which was significantly higher in the underweight participants (see Table 2). Also in the Ibadan cohort, diastolic blood pressure and triglycerides were significantly lower in the underweight participants compared with the normal weight participants.
Table 2.
Disease, Illness, and Injury Prevalence and Biomarker Values by Body Mass Index Categories for Older Yoruba-Nigerian and African Americans
| Ibadan | Indianapolis | |||||||
|---|---|---|---|---|---|---|---|---|
| Underweight (n = 300) | Normal (n = 649) | Overweight (n = 180) | Obese (n = 68) | Underweight (n = 17) | Normal (n = 265) | Overweight (n = 433) | Obese (n = 554) | |
| Angina, % | 4 | 5 | 4 | 7 | 0 | 4 | 7 | 9** |
| Arthritis, % | 19 | 23 | 30 | 31 | 53 | 55 | 68** | 80*** |
| Depression, % | 14 | 11 | 9 | 6 | 24* | 8 | 8 | 14* |
| Diabetes, % | 1 | 2 | 1 | 3 | 19 | 18 | 28** | 34*** |
| Epilepsy, % | 0 | 0 | 1 | 0 | 0 | 2 | 2 | 1 |
| Head injury, % | 5 | 4 | 3 | 1 | 6 | 13 | 7** | 8* |
| Heart attack, % | 5 | 3 | 5 | 6 | 13 | 14 | 13 | 13 |
| Hypertension, % | 16*** | 26 | 34 | 38* | 82 | 67 | 76* | 80*** |
| Kidney disease, % | 0 | 0 | 0 | 0 | 6 | 5 | 3 | 6 |
| Liver disease, % | 5 | 7 | 7 | 7 | 12** | 1 | 2 | 1 |
| Lung disease, % | 6 | 3 | 7 | 1 | 24 | 10 | 7 | 7 |
| Parkinson’s disease, % | 4 | 4 | 3 | 0 | 0 | 0 | 1 | 1 |
| Stroke, % | 1 | 2 | 2 | 1 | 24 | 15 | 16 | 16 |
| Thyroid disease, % | 0 | 1 | 0 | 1 | 12 | 13 | 12 | 16 |
| Vascular disease, % | 2 | 3 | 6 | 3 | 12 | 6 | 9 | 11* |
| Cancer, % | 1 | 1 | 1 | 0 | 18 | 16 | 19 | 14 |
| Heart problems, % | 9 | 8 | 9 | 12 | 24 | 29 | 34 | 32 |
| Number of comorbidities, mean (SD) | 0.9 (1.2) | 1.0 (1.3) | 1.2 (1.2) | 1.2 (1.1) | 3.2 (2.1) | 2.7 (1.6) | 3.1 (1.8)* | 3.4 (1.9)*** |
| Systolic blood pressure, mean (SD) | 151 (33) | 152 (30) | 155 (31) | 154 (30) | 140 (22) | 144 (22) | 146 (22) | 146 (21) |
| Diastolic blood pressure, mean (SD) | 83* (16) | 85 (15) | 87 (14) | 90* (15) | 74 (14) | 77 (12) | 79* (11) | 80** (11) |
| Triglycerides, mean (SD) | 82* (29) | 87 (35) | 105*** (43) | 105*** (49) | 92 (48) | 107 (52) | 113 (55) | 120** (58) |
| HDL, mean (SD) | 53*** (15) | 49 (13) | 48 (14) | 49 (12) | 67** (20) | 55 (16) | 51** (16) | 49*** (14) |
| LDL, mean (SD) | 102 (30) | 106 (33) | 119*** (38) | 112 (30) | 97 (35) | 114 (34) | 111 (35) | 114 (34) |
| CRP, mean (SD) | 9 (23) | 7 (17) | 7 (11) | 11 (28) | 5 (6) | 11 (18) | 12 (26) | 16** (29) |
| Died within 10 years, n (%) | 174 (58)*** | 300 (46) | 63 (35)** | 25 (37) | 13 (76)* | 125 (47) | 178 (41) | 237 (43) |
Note: SD, standard deviation. All tests of significance in reference to normal weight category.
*p < .05; **p < .01; ***p < .001
Despite no apparent elevated disease or biomarker risk levels, the underweight Yoruba experienced higher rates of death compared with the normal weight (see Table 2). In models adjusted for age, gender, smoking history, and alcohol use (see Table 3 models without biomarkers), we found that underweight was associated with an increased risk of death in both the Yoruba (HR = 1.35, 95% CI: 1.12–1.63) and African American samples (HR = 2.49, 95% CI: 1.40–4.43). Excluding those who died within the first year of follow-up (not shown: n = 26 Yoruba and n = 25 African Americans) from the multivariate model yielded little change in the HRs for underweight Yoruba (1.36, 95% CI: 1.12–1.64) or African Americans (2.29, 95% CI: 1.23–4.27). Therefore, hypothesis 2 is not supported.
Table 3.
Multivariate Cox Proportional Hazards Regressing Age, Gender, Alcohol Use, Smoking History, Body Mass Index, and Biomarkers on Survival in Yoruba-Nigerian and African American Samples
| Yoruba | African- American | |
|---|---|---|
| (n = 1,197) | (n = 1,269) | |
| Hazard Ratios (95% CI) | Hazard Ratios (95% CI) | |
| Model without biomarkers | ||
| BMI | ||
| Underweight | 1.35 (1.12–1.63) | 2.49 (1.40–4.43) |
| Normal weight | Reference | Reference |
| Overweight | 0.88 (0.67–1.16) | 0.90 (0.72–1.14) |
| Obese | 0.92 (0.61–1.39) | 1.06 (0.85–1.33) |
| Age in years | 1.06 (1.04–1.07) | 1.08 (1.06–1.09) |
| Female | 0.74 (0.61–0.90) | 0.61 (0.51–0.73) |
| Use any alcohol | 0.87 (0.71–1.07) | 0.89 (0.74–1.08) |
| Ever smoked | 1.23 (1.02–1.48) | 1.47 (1.21–1.79) |
| Model with biomarkers | ||
| BMI | ||
| Underweight | 1.34 (1.11–1.63) | 2.59 (1.44–4.65) |
| Normal weight | Reference | Reference |
| Overweight | 0.81 (0.61–1.07) | 0.91 (0.72–1.15) |
| Obese | 0.82 (0.54–1.24) | 1.04 (0.83–1.31) |
| Age in years | 1.06 (1.05–1.08) | 1.07 (1.06–1.09) |
| Female | 0.73 (0.60–0.89) | 0.62 (0.51–0.75) |
| Use any alcohol | 0.90 (0.73–1.12) | 0.90 (0.74–1.08) |
| Ever smoked | 1.16 (0.96–1.40) | 1.48 (1.22–1.80) |
| Systolic blood pressure, per 10 units | 1.04 (1.00–1.09) | 1.04 (0.99–1.10) |
| Diastolic blood pressure, per 10 units | 1.06 (0.96–1.16) | 0.88 (0.80–0.96) |
| Triglycerides, per 10 units | 1.03 (1.01–1.06) | 1.00 (0.98–1.01) |
| High-density lipoprotein, per 10 units | 1.04 (0.98–1.11) | 0.98 (0.92–1.04) |
| Low-density lipoprotein, per 10 units | 0.99 (0.97–1.02) | 0.99 (0.96–1.02) |
| C-reactive protein, per 10 units | 1.02 (0.98–1.06) | 1.04 (1.02–1.08) |
Note: BMI, body mass index. The assumption for proportional hazards was satisfied in all models shown in Table 3 (p > .07).
Hypothesis 3 is not supported by these data either. It is evident from the Table 3 models without biomarkers that in these two cohorts the overweight and obese participants did not experience a statistically significant survival advantage over normal weight participants.
For investigation of hypothesis 4, multivariate cox proportional hazards models of death were estimated with each of the covariates listed in Table 1 including biomarkers as well as BMI class. The results of these models are shown separately for the Yoruba and African Americans in the Table 3 models with biomarkers. Neither overweight nor obesity is associated with mortality in either cohort. In the Yoruba, higher triglycerides resulted in a statistically significant increased risk of death. In the African American sample, higher C-reactive protein resulted in an increased risk of death, but higher diastolic blood pressure resulted in a lower risk of death. Thus, hypothesis 4 (ie, that there is no association of BMI with mortality but an association of biomarkers with mortality) is partially supported. Finally, with biomarkers included in the multivariate model, HRs for underweight are significant and little changed from what is shown in Table 3.
Discussion
In reference to the four hypotheses presented in the introduction—low weight as illness proxy, underweight Yoruba will not experience excess mortality, excess weight provides physiological reserve, BMI is a poor proxy for body fat percent and storage—we conclude that excess mortality associated with underweight in relation to normal weight was not due to baseline clinical disease prevalence in these cohorts. Nor was it apparently related to the baseline levels of biomarkers studied in these analyses. And, excluding participants who died within 1 year of baseline did not change the HRs associated with underweight. We cannot, however, exclude the possibility that increased risk of mortality was due to illness severity or subclinical disease as we did not have such measures. One difficulty of analyses of underweight in U.S. older adults is that underweight is rare; just 1.3% of the African American participants in this study were underweight. Indeed, our sample size in this category is a significant limitation of the study. In Ibadan, however, 1 in 4 were underweight—the second most prevalent BMI class—yet underweight was associated with slightly greater than a one-third increased risk of death independent of the biomarker covariates included in the model. This one-third greater risk, however, was less than seen for underweight African Americans who had a greater than 150% elevated risk of death.
We found limited support for the hypothesis that excess weight provides a physiological reserve if excess weight refers to overweight and obesity classes. These classes were not associated with significantly less mortality than normal weight in either cohort. However, as noted, underweight was associated with significantly excess mortality risk in both samples. This may indicate that some weight is needed for physiological reserve, but the amount required may only be enough to maintain a normal weight status. In the African American cohort, the obese had higher prevalence of chronic disease and less favorable biomarker levels yet did not suffer higher rates of mortality. This is a paradox in itself, but the finding may be due to less than ideal lifestyle practices in every BMI class including the normal weight. A very recent analysis of African American Adventists supports this view. Adventists are encouraged to avoid tobacco, alcohol, and meat products, follow a plant-based diet, and keep a program of vigorous physical activity (20). In this sample with relatively positive health behaviors, instantaneous hazards indicated that obesity relative to normal weight was associated with an approximately 6-year decrease in life expectancy through 85 years of age (20).
Hypothesis 4 had two components; first, BMI is a poor proxy of amount and site of body fat, and second, biomarkers known to be associated with amount and type of body fat will be associated with mortality. We cannot directly address the first component but, other than underweight, BMI was not associated with mortality in either cohort, and the inclusion of biomarkers in the multivariate models did not change the findings. A recent study used plasma Leptin concentrations, a biomarker associated with percent body fat in the oldest old (21), to investigate whether BMI is a reasonable proxy for percent body fat. Lisko and colleagues showed that BMI did have a moderate positive correlation (r = .56–.59) with plasma Leptin concentration (22). In this same cohort, however, BMI class was not associated with mortality among women, but, in men, overweight participants had a lower mortality risk than normal weight participants. There were no underweight men and only three underweight women in the sample (23).
In regard to the second component of hypothesis 4, we investigated the association of HDL and LDL cholesterol, triglycerides, and CRP with mortality based on recent evidence that amount and type of body fat (ie, visceral fat) carry elevated carbiometabolic risk in large part through effects on blood pressure, lipids, and systemic inflammation, represented here by CRP (12). We found significant associations but the associated biomarkers differed across the cohorts. In the Yoruba, triglyceride had a positive association with mortality, whereas in the African Americans, CRP had a positive association. In addition, diastolic blood pressure had an inverse association with mortality in the African American sample. We do not have an explanation for this finding, but low blood pressure may be an indication of poor health in the oldest old; a recent study showed that frail older adults with high blood pressure experienced significantly lower mortality compared with those with low blood pressure (24). BMI class differences in systolic blood pressure were not significant but differences in diastolic blood pressure were. In African Americans, diastolic blood pressure was generally 2 points greater for each increase in BMI class such that the underweight had a mean diastolic pressure of 73.9 and the obese had a mean of 79.6. The same BMI–blood pressure pattern was apparent in the Yoruba, but overall mean blood pressures were 8–10 points greater in the Yoruba compared with the African Americans perhaps due to a high prevalence of antihypertensive use in the African Americans (>75%). Medication use in the Yoruba is uncommon and temporary, and no medication use data were collected for that cohort.
There are important limitations to consider in this report. First, with the study design and data available, we could not directly test any of the hypotheses. We used the hypotheses to organize an exploration of the role of BMI and biomarkers on mortality in two very different cohorts with the goal of contributing information to the obesity paradox observed in older adults in general and older African Americans in particular. Second, a large portion of participants could not be included in the analyses due to no blood draw. Third, as is the case with virtually all studies of underweight in the United States, our sample size of underweight African Americans was very small. Fourth, it is known that the U.S. and Sub-Saharan African environments differ markedly in ways highly relevant to cardiometabolic risk (25), but we do not have data specific to these cohorts on nutrition or energy expenditure. Similarly, we do not have data on socioeconomic status although relative poverty is known to be high in both cohorts. In Ibadan, the study was carried out in the Idikan area and adjacent wards in the more ancient parts of the city where residents are typically small traders and craftsmen. In Indianapolis, one fifth of African Americans lived below the poverty level in 2000 (26), and 46% of the sample had not completed high school.
Fifth, vastly different environments likely produce very different survivors, but our capacity to characterize the ways in which these two cohorts of survivors differ is limited to the relatively small set of variables reported. This substantially limits our interpretation of results and the conclusions that can be made. As one example, access to medical care may account for both the risk factor differences and the survival similarities. Medical care is of lower quality and more difficult to access in Ibadan relative to Indianapolis where a high-quality safety-net health system has existed for decades. In Ibadan, individuals unfortunate enough to contract disease or who are less resilient may have died earlier leaving an older cohort with relatively favorable risk factors. Although the diseases responsible for early and mid-life mortality differ substantially between the two cohorts—acute versus chronic (25)—it may be true under both acute and chronic disease scenarios that a higher level of resilience is required to reach late life in contexts that have limited access to high-quality medical care. That the African Americans in the study have higher rates of disease and less healthy biomarker values than the Yoruba sample yet survive at a similar rate may again represent the influence of medical care but in this case late life medical care. Stating this from another perspective, the Ibadan cohort was cardiometabolically healthier and achieved survival similar to that of the African Americans despite orders of magnitude less medical care access and spending.
Sixth, censoring differed between the two cohorts. In Indianapolis, due to the availability of county health records, dates of death were available for all deceased participants with censoring at the end of study. In Ibadan, death was ascertained during each follow-up evaluation. Censoring was caused by loss to follow-up and refusal, thus occurring throughout the study. To the best of our knowledge, most loss to follow-up in Ibadan resulted from participants moving away from the survey area for various reasons. It seems reasonable that the assumption of uninformative censoring holds for both cohorts. Hence, the difference in censoring between the cohorts should have little or no impact on our results. Finally, a recent publication showed evidence of cohort effects on the relationship between obesity and mortality with more recent cohorts suffering greater obesity-attributable mortality (27). Our participants were born in 1931 and earlier, and results may not generalize to more recent cohorts.
In sum, we found evidence of a mortality disadvantage in the underweight of both cohorts but little evidence that this is due to greater illness suggesting that possibly some body fat is required for favorable survival. However, we did not find a mortality advantage for the overweight or obese. Evidence for a significant effect of cardiometabolic biomarkers on mortality was limited. Despite significant differences across these two cohorts in terms of BMI distribution, disease rates, and biomarker levels, overall survival and BMI class–specific survival were remarkably similar.
Funding
Research reported in this publication was supported by the National Institute on Aging of the National Institutes of Health under award numbers (P30 AG024967, RO1 AG09956).
Conflict of Interest
All authors have no conflicts of interest regarding this work.
Acknowledgment
The content is solely the responsibility of the authors and does not necessarily represent the official views of the National Institute on Aging.
References
- 1. Bender R, Jöckel KH, Trautner C, Spraul M, Berger M. Effect of age on excess mortality in obesity. JAMA. 1999;281:1498–1504. 10.1001/jama.281.16.1498 [DOI] [PubMed] [Google Scholar]
- 2. Berrington de Gonzalez A, Hartge P, Cerhan JR, et al. Body-mass index and mortality among 1.46 million white adults. N Engl J Med. 2010;363:2211–2219. 10.1056/NEJMoa1000367 [DOI] [PMC free article] [PubMed] [Google Scholar]
- 3. Flegal KM, Kit BK, Orpana H, Graubard BI. Association of all-cause mortality with overweight and obesity using standard body mass index categories: a systematic review and meta-analysis. JAMA. 2013;309:71–82. 10.1001/jama.2012.113905 [DOI] [PMC free article] [PubMed] [Google Scholar]
- 4. Adams KF, Schatzkin A, Harris TB, et al. Overweight, obesity, and mortality in a large prospective cohort of persons 50 to 71 years old. N Engl J Med. 2006;355:763–778. 10.1056/NEJMoa055643 [DOI] [PubMed] [Google Scholar]
- 5. Cohen SS, Signorello LB, Cope EL, et al. Obesity and all-cause mortality among black adults and white adults. Am J Epidemiol. 2012;176:431–442. 10.1093/aje/kws032 [DOI] [PMC free article] [PubMed] [Google Scholar]
- 6. Andres R, Elahi D, Tobin JD, Muller DC, Brant L. Impact of age on weight goals. Ann Intern Med. 1985;103(6 (Pt 2)):1030–1033. 10.7326/0003-4819-103-6-1030 [DOI] [PubMed] [Google Scholar]
- 7. Manson JE, Stampfer MJ, Hennekens CH, Willett WC. Body weight and longevity. A reassessment. JAMA. 1987;257:353–358. 10.1001/jama.1987.03390030083026 [PubMed] [Google Scholar]
- 8. Hughes V. The big fat truth. Nature. 2013;497(7450):428–430. 10.1038/497428a [DOI] [PubMed] [Google Scholar]
- 9. Murphy RA, Register TC, Shively CA, et al. Adipose tissue density, a novel biomarker predicting mortality risk in older adults. J Gerontol A Biol Sci Med Sci. 2013. 10.1093/gerona/glt070 [DOI] [PMC free article] [PubMed] [Google Scholar]
- 10. Heymsfield SB, Cefalu WT. Does body mass index adequately convey a patient’s mortality risk? JAMA. 2013;309:87–88. 10.1001/jama.2012.185445 [DOI] [PubMed] [Google Scholar]
- 11. Arsenault BJ, Lemieux I, Després JP, et al. The hypertriglyceridemic-waist phenotype and the risk of coronary artery disease: results from the EPIC-Norfolk prospective population study. CMAJ. 2010;182:1427–1432. 10.1503/cmaj.091276 [DOI] [PMC free article] [PubMed] [Google Scholar]
- 12. Tchernof A, Després JP. Pathophysiology of human visceral obesity: an update. Physiol Rev. 2013;93:359–404. 10/1152/physrev.00033.2011 [DOI] [PubMed] [Google Scholar]
- 13. Ard JD. Unique perspectives on the obesogenic environment. J Gen Intern Med. 2007;22:1058–1060. 10.1007/s11606-007-0243.z [DOI] [PMC free article] [PubMed] [Google Scholar]
- 14. Onyemelukwe-Onuobia C. The dilemma of nutrition in Nigeria (1). Nigeria: Daily Times (NG). 2012. http://www.dailytimes.com.ng/opinion/dilemma-nutrition-nigeria-1 [Google Scholar]
- 15. Hendrie HC, Ogunniyi A, Hall KS, et al. Incidence of dementia and Alzheimer disease in 2 communities: Yoruba residing in Ibadan, Nigeria, and African Americans residing in Indianapolis, Indiana. JAMA. 2001;285:739–747. 10.1001/jama.285.6.739 [DOI] [PubMed] [Google Scholar]
- 16. Hall KS, Gao S, Baiyewu O, et al. Prevalence rates for dementia and Alzheimer’s disease in African Americans: 1992 versus 2001. Alzheimers Dement. 2009;5:227–233. 10.1016/j.jalz.2009.01.026 [DOI] [PMC free article] [PubMed] [Google Scholar]
- 17. Hendrie HC, Osuntokun BO, Hall KS, et al. Prevalence of Alzheimer’s disease and dementia in two communities: Nigerian Africans and African Americans. Am J Psychiatry. 1995;152:1485–1492 [DOI] [PubMed] [Google Scholar]
- 18. Ogunniyi A, Osuntokun BO. Determination of ages of elderly Nigerians through historical events: validation of Ajayi-Igun 1963 listing. West Afr J Med. 1993;12:189–190 [PubMed] [Google Scholar]
- 19. World Health Organization (WHO). Physical Status: The Use and Interpretation of Anthropometry. WHO Technical Report Series 854. Geneva, Switzerland: World Health Organization; 1995 [PubMed] [Google Scholar]
- 20. Singh PN, Clark RW, Herring P, Sabaté J, Shavlik D, Fraser GE. Obesity and life expectancy among long-lived Black adults. J Gerontol A Biol Sci Med Sci. 2014;69:63–72. 10.1093/gerona/glt049 [DOI] [PMC free article] [PubMed] [Google Scholar]
- 21. Ruhl CE, Harris TB, Ding J, et al. Body mass index and serum leptin concentration independently estimate percentage body fat in older adults. Am J Clin Nutr. 2007;85:1121–1126 [DOI] [PubMed] [Google Scholar]
- 22. Lisko I, Tiainen K, Stenholm S, et al. Are body mass index, waist circumference and waist-to-hip ratio associated with leptin in 90-year-old people? Eur J Clin Nutr. 2013;67:420–422. 10.1038/ejcn.2013.39 [DOI] [PubMed] [Google Scholar]
- 23. Lisko I, Tiainen K, Stenholm S, Luukkaala T, Hervonen A, Jylhä M. Body mass index, waist circumference, and waist-to-hip ratio as predictors of mortality in nonagenarians: the Vitality 90+ Study. J Gerontol A Biol Sci Med Sci. 2011;66:1244–1250. 10/1093.gerona/glr747 [DOI] [PubMed] [Google Scholar]
- 24. Odden MC, Peralta CA, Haan MN, Covinsky KE. Rethinking the association of high blood pressure with mortality in elderly adults: the impact of frailty. Arch Intern Med. 2012;172:1162–1168. 10.1001/archinternmed.2012.2555 [DOI] [PMC free article] [PubMed] [Google Scholar]
- 25. World Health Organization (WHO). World Health Statistics 2010. In: WHO, ed. WHO Technical Report. Geneva, Switzerland: World Health Organization; 2010 [Google Scholar]
- 26. Justis R. Indiana’s Income by Race. IU’s Kelley School of Business. Indianapolis, IN: Indiana Business Research Center; 2005 [Google Scholar]
- 27. Masters RK, Reither EN, Powers DA, Yang YC, Burger AE, Link BG. The impact of obesity on US mortality levels: the importance of age and cohort factors in population estimates. Am J Public Health. 2013;103:1895–1901. 10.2105/AJPH.2013.301379 [DOI] [PMC free article] [PubMed] [Google Scholar]