Abstract
The purpose of this study was to investigate the relationship between tumor size and blood volume for patients with lung tumors, using dual-energy computed tomography (DECT) and a gemstone spectral imaging (GSI) viewer. During the period from March 2011 to March 2013, 50 patients with 57 medically inoperable lung tumors underwent DECT before stereotactic body radiotherapy (SBRT) of 50–60 Gy in 5–6 fractions. DECT was taken for pretreatment evaluation. The region-of-interest for a given spatial placement of the tumors was set, and averages for CT value, water density and iodine density were compared with tumor size. The average values for iodine density in tumors of ≤2 cm, 2–3 cm, and >3 cm maximum diameter were 24.7, 19.6 and 16.0 (100 µg/cm3), respectively. The average value of the iodine density was significantly lower in larger tumors. No significant correlation was detected between tumor size and average CT value or between tumor size and average water density. Both the average water density and the average CT value were affected by the amount of air in the tumor, but the average iodine density was not affected by air in the tumor. The average water density and the average CT value were significantly correlated, but the average iodine density and the average CT value showed no significant correlation. The blood volume of tumors can be indicated by the average iodine density more accurately than it can by the average CT value. The average iodine density as assessed by DECT might be a non-invasive and quantitative assessment of the radio-resistance ascribable to the hypoxic cell population in a tumor.
Keywords: dual-energy CT, gemstone spectral imaging, lung tumor, iodine density, perfusion
INTRODUCTION
Stereotactic body radiotherapy (SBRT) has been increasingly used for patients with lung cancer and other malignant tumors in recent decades [1]. SBRT is expected to be one of the treatment alternatives to surgery for early-stage lung cancer [2]. Several available reports have focused on good tumor control by SBRT [3–4]. Although the local control rate for a T1 tumor is ∼90%, the local control rate for a T2 tumor is poor in comparison [5–7]. In other words, a more intensive treatment regimen should be considered for larger tumors. Fowler et al. [8] suggested that one reason for this could be an increase in the hypoxic cell population. In larger tumors, the hypoxic cell populations are likely to be increased due to the relatively lower blood volume in the tumor.
Recently, gemstone spectral imaging analysis using dual-energy computed tomography (DECT) was introduced, and material densities became measurable [9–11]. The basic principle of dual-energy is the acquisition of two datasets from the same anatomic location with different kilovoltage (kV: usually 80 and 140 kV). Currently, two kinds of DECT system have been introduced: using multidetector CT with two X-ray tubes, and rapid kV switching (gemstone spectral imaging) [12]. Regardless of the difference in device, DECT is based on two distinct capacities: material differentiation and material identification and quantification [13]. In addition, evaluation of the relative blood volume of tumors has become possible from measuring iodine densities [14, 15]. The purpose of this prospective study was to investigate the relationship between tumor size and blood volume for patients with lung tumors using DECT.
MATERIALS AND METHODS
Patients and tumor characteristics
During the period from March 2011 to March 2013, 50 patients with medically inoperable lung tumors (39 lung cancers, 11 lung metastases) underwent DECT before SBRT with a total dose of 50–60 Gy in 5–6 fractions. Total target doses were 50 Gy for T1 (≤3 cm in maximum diameter) tumors, and 60 Gy for T2 (>3 cm) tumors in our institution. Among the 50 patients, seven patients had multiple lung tumors, thus the subjects of this study had 57 lung tumors. Patient and tumor characteristics are summarized in Table 1. There was no relationship between the tumor size and the kind of histology.
Table 1.
Patients and tumor characteristics
| Patients (n = 50) | |
|---|---|
| Age (y), mean and range | 75.6 (57–86) |
| Sex (Male/Female) | 40/10 |
| Diagnosis | |
| Lung cancer | 39 |
| Lung metastasis | 11 |
| Tumors (n = 57) | |
| Type (Solid/GGO) | 51/6 |
| Size (in maximum diameter) | |
| ≤2 cm | 22 |
| 2–3 cm | 27 |
| >3 cm | 8 |
| GTV (ml), mean and range | 6.52 (0.75–25.8) |
| Histology | |
| Adenocarcinoma | 31 |
| SCC | 12 |
| NSCLC | 3 |
| Unknown | 11 |
GGO = ground-glass opacity, GTV = gross tumor volume, SCC = squamous cell carcinoma, NSCLC = non-small cell lung cancer.
Of the 57 lung tumors, six lung tumors had ground-glass opacity (GGO). The remaining 51 tumors were solid type tumors. GGO type was defined as the tumor including air density in the tumor. The histology was unknown for the lung tumors of 11 cases (9 metastases, 2 primaries) included in this study group. Although 11 cases were not confirmed histologically by bronchoscopy and/or CT-guided biopsy, these were diagnosed as malignant lung tumors clinically because of increasing size, an increase in tumor marker, and positive accumulation of tracer in an 18F-fluorodeoxyglucose (18F-FDG) positron emission tomography.
This study was approved by the institutional review board of our institution, and written informed consent was obtained from all patients.
Scanning procedure
CT was taken by a dual-energy gemstone spectral CT (Discovery CT 750 HD, GE Healthcare, Tokyo, Japan) for pretreatment evaluation. A fast kilovoltage (kV) switching method was used for CT imaging. The fast kV switching CT scanning is based on a new garnet crystal scintillator detector with a very fast optical response and a high-voltage generator equipped with an ultrafast tube kV switching mechanism. The dose of contrast medium was ∼600 mgI per kg body weight in iodine content of 300 or 350 (mgI/ml) of non-ionic, low osmolar contrast medium. The total amount of the contrast medium was injected intravenously within a period of 30 s. The scan was started 25 s after the start of injection of the contrast medium. The thickness of a data analysis slice was 0.63 mm.
In this study, all tumors were located in the peripheral lung. There were no artifacts from either the contrast medium or cardiac motion to affect the tumors.
Data analyses and considerations
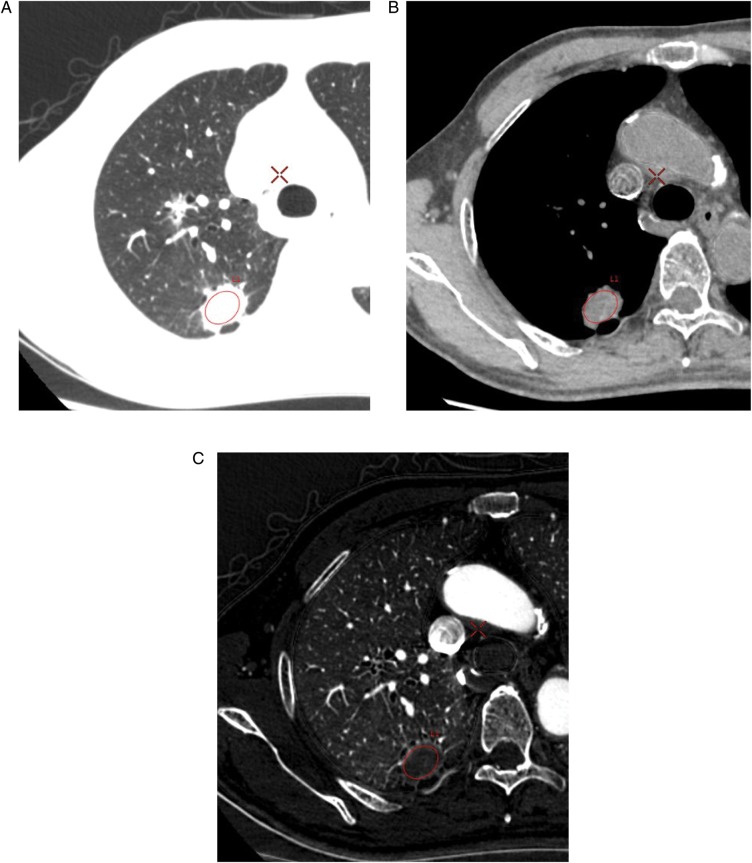
All CT images were transferred to a workstation (GSI Viewer, GE Healthcare, Tokyo, Japan) and were applied to the data analysis. Regions-of-interest (ROIs) of a same spatially located area at the maximum cross section of the tumor surrounding the whole tumors was set, and the average CT value (HU), average water density (mg/cm3) and average iodine density (100 µg/cm3) in the ROI were compared with the tumor size. The CT value was assessed by monochromatic CT imaging, of which the kilo-electron voltage was equivalent to 65 keV because the CT value was influenced by the strength of the monochromatic beam energy. After setting the ROI of the tumor on the monochromatic CT image using a pulmonary window (window width: 1000 HU; window level: −700 HU), the image was converted to a water density image and an iodine density image, as shown in Fig. 1.
Fig. 1.
One 74-year-old man with a non-small cell lung cancer. Locations of the ROIs for the lung tumor: CT image of pulmonary window (A); water density image (B); iodine density image (C).
Considerations in this study were as follows: (i) correlation between variables (CT values, water density, iodine density) and tumor size; (ii) influence of the amount of air on the measurement results; (iii) correlation between material densities and CT values; and (iv) changes in the mean values of the iodine density with change in tumor size.
Statistical analysis
All statistical analyses were performed with a commercial statistical software package (Dr. SPSS II for Windows, SPSS Inc., Tokyo, Japan). The difference between the mean values of variables was assessed with a Student's t-test. Pearson's product-moment correlation coefficient (r) was used to study the relationship between the CT values and the material densities. Differences were regarded as statistically significant at P < 0.05.
RESULTS
Correlation between variables and tumor size
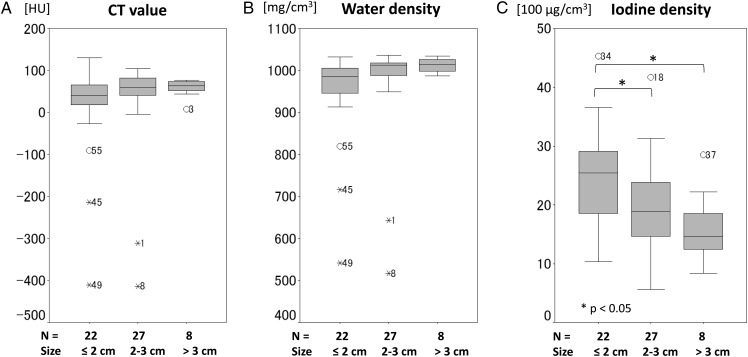
The average CT value and the average water density were slightly increased as the tumor become larger, but no statistically significant difference was observed. On the other hand, the average iodine density was decreased in large tumors. Significant difference in average iodine density was noted between tumors of from 2–3 cm and ≤2 cm (P < 0.05), and between those of >3 cm and ≤2 cm (P < 0.05), as shown in Fig. 2.
Fig. 2.
Correlation between variables and tumor size. Box-and-whisker plots demonstrating association between variable (CT values (A), water density (B), iodine density (C)) and subject's tumor size (≤2 cm, 2–3 cm, >3 cm). The box contains values between the 25th and 75th percentiles of variables (central line, median). Vertical lines represent 10th and 90th percentiles.
Influence of the amount of air on the measurement results
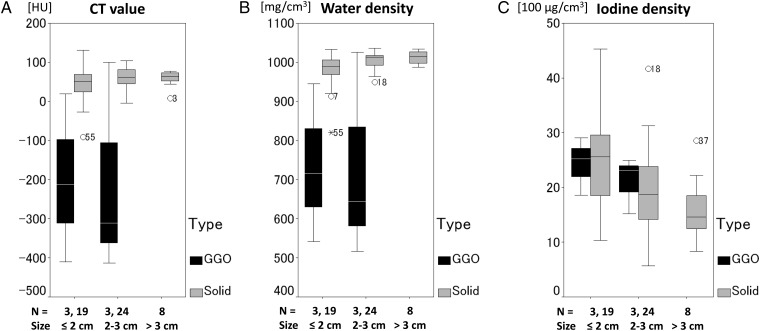
The mean values of the average CT value for solid type tumors and GGO type tumors were 53.4 and −204.9 HU, respectively (P < 0.05). The mean values of the average water density for solid type tumors and GGO type tumors were 996.6 and 731.5 mg/cm3, respectively (P < 0.05). The average CT value and the average water density were clearly reduced in the tumors of GGO type compared with those of solid type, as shown in Fig. 3.
Fig. 3.
Influence of the amount of air on the measurement results. Box-and-whisker plots demonstrating association between variable (CT value (A), water density (B), iodine density (C)) and subject's tumor size (≤2 cm, 2–3 cm, >3 cm) and tumor type (GGO type, black; solid type, gray). The CT values and water densities are affected by the amount of air, but the iodine densities are not affected by the amount of air in the tumor.
On the other hand, the average iodine density in tumors of the GGO type showed a similar pattern to those of the solid type. The mean values of the average iodine density for solid-type tumors and GGO-type tumors were 20.9 and 22.7 (100 µg/cm3), respectively. There was no statistically significant difference between solid-type tumors and GGO-type tumors with respect to the mean value of the average iodine density.
Correlation between average material densities and average CT values
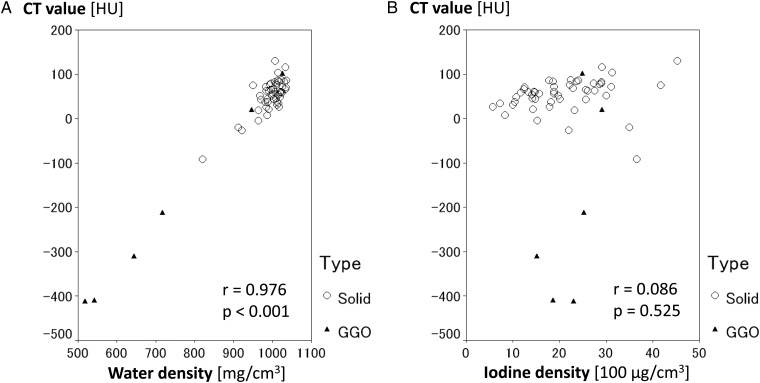
Regardless of the type of tumor, the average water density and the average CT values showed a positive correlation (P < 0.001). On the other hand, no significant correlation was noted between the average CT value and the average iodine density, as shown in Fig. 4.
Fig. 4.
Correlation between the material densities and the CT values. Scatter plots demonstrating correlation between the CT value and the water density (A), and between the CT value and the iodine density (B). Regardless of the tumor type (solid type, circle; GGO type, triangle), significant correlation was noted between the CT value and the water density (P < 0.001), but no correlation was noted between the CT value and the iodine density.
Difference in the mean values of the average iodine density with tumor size
The mean values of the average iodine density in primary lung cancer and lung metastases were 21.1 and 21.0 (100 µg/cm3), respectively (P = 0.943). The mean values of the average iodine density in squamous cell carcinoma and adenocarcinoma were 18.2 and 21.7 (100 µg/cm3), respectively (P = 0.224).
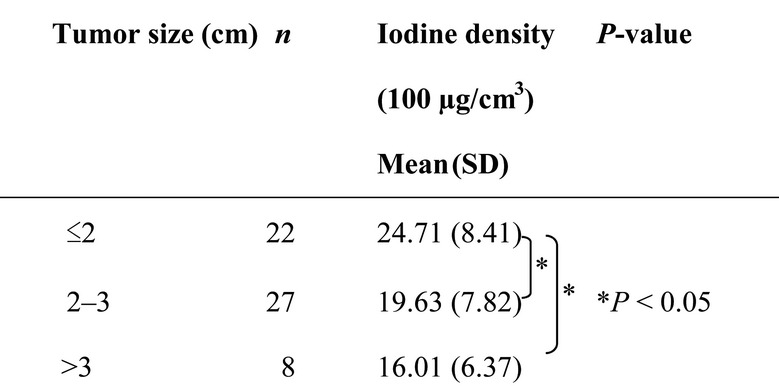
On the other hand, the mean values of the average iodine density in tumors of ≤2 cm, 2–3 cm, and >3 cm were 24.7, 19.6 and 16.0 (100 µg/cm3), respectively, as shown in Table 2. A 24% reduction in average iodine density was observed in 2–3 cm tumors compared with that in tumors of ≤ 2 cm (P < 0.05). Furthermore, a 35% reduction in the average iodine density was observed in >3 cm tumors compared with in ≤2 cm tumors (P < 0.05).
Table 2.
Mean value of the iodine density according to tumor size
 |
SD = standard deviation.
DISCUSSION
There were three major findings from this study. First, the average iodine density was decreased significantly in large tumors. Second, the average iodine density was not affected by the amount of air in the tumor. Third, no significant correlation was found between the average iodine density and the average CT value.
Tumor size and average iodine density
The reduction in average iodine density with increase in tumor size is related to a reduction in blood flow and blood volume. There are a number of reports concerning a correlation between perfusion parameters and iodine density [16, 17]. Zhang et al. [16] suggested the possibility of using an iodine density image instead of perfusion CT to evaluate hepatocellular carcinoma angiogenesis in animals. Our findings lead us to propose using DECT instead of perfusion CT for evaluating perfusion parameters (blood flow, blood volume, and vascular permeability). Similar findings indicating the feasibility of using DECT-perfusion for pancreatic carcinoma have been reported by Klauss et al. [17].
On the other hand, there is only one report on measuring tumor size and iodine density using DECT. Knöss et al. [18] assessed whether DECT can be used to detect iodine and to distinguish iodine from dispersed calcification in artificial pulmonary nodules in vitro, and reported that DECT can distinguish iodine from calcium in artificial nodules of diameter ≥16 mm in vitro. This finding suggests that iodine density images could have potential for assessment of the relative vascularity of small pulmonary nodules. In our study, reduction in iodine density was observed in lung cancer and lung metastases of >2 cm diameter. In other words, reduction in the relative blood volume of the lung tumor begins at an early stage, say T1b or T2a.
Average CT value and average iodine density
The reason why average iodine density is not affected by the amount of air, unlike the average CT value, is explained by the properties of DECT. Thieme et al. [19] assessed contrast material distribution in pulmonary parenchyma by dual-source DECT and suggested that DECT is reliable in the detection of defects in pulmonary parenchymal iodine distribution corresponding to embolic vessel occlusion. Kawai et al. [20] evaluated contrast enhancement for ground-glass attenuation (GGA) using contrast mapping images from dual-source DECT, and reported that contrast enhancement of GGA was evaluable on DECT. These reports suggest that iodine density is hardly affected by the amount of air; in contrast, the CT value is affected by the amount of water, air and calcification, as well as by the nature of the tumor, stroma and contrast medium. Because of this, the average iodine density is not always low, even if the average CT value is low in contrast-enhanced CT. Of course, the methods of analysis differ between dual-source DECT and dual-energy gemstone spectral CT, although the capabilities for material differentiation and identification are common to both DECT systems. Therefore, the average iodine density assessed by DECT can be superior to the average CT value for the evaluation of the blood volume in the tumor.
Relationship between tumor size and hypoxia
The relationship between tumor size and hypoxia has been well documented. Ping W et al. [21] investigated the expression and significance of hypoxia-inducible factor 1α (HIF-1α) in non-small cell lung cancer and reported that HIF-1α expression was associated with tumor size. Tumors >3 cm in diameter show significantly higher HIF-1α expression in comparison with those <3 cm. Similar findings of a relationship between tumor size and hypoxia in pancreatic carcinoma were reported by Kitada et al. [22]. These results suggest that the development of hypoxia is related to the size of the tumor.
Limitations
This study has a number of limitations. First, it has not directly proven the existence of hypoxic cell populations. Second, it is still unknown whether low iodine density indicates hypoxic conditions. Third, there are many factors that influence the iodine density of a tumor, including scan delay, total amount of contrast agent, injection rate, how the ROIs have been set with reference to tumor, and patient characteristics. Finally, the number of cases is small and the follow-up period is short, so further studies on the relationship between local control and iodine density will be necessary. However, this study indicates the potential of DECT for indicating radio-resistance associated with low blood volume (and probably hypoxic conditions).
CONCLUSIONS
In conclusion, the average iodine density is reduced significantly in large tumors. The average iodine density can indicate relative blood volume in tumors more accurately than the average CT values. The average iodine density estimated by dual-energy gemstone spectral CT imaging might be a useful, non-invasive and quantitative assessment of the radio-resistance caused by the hypoxic cell population in the tumor.
FUNDING
Funding to pay the Open Access publication charges for this article was provided by the Japan Society for the Promotion of Science (JSPS) KAKENHI Grant No. 24591830.
ACKNOWLEDGEMENTS
This work was presented at the 26th Annual Meeting of the Japanese Society for Therapeutic Radiology and Oncology, October 18–20, 2013, Aomori, Japan.
REFERENCES
- 1.Nagata Y, Wulf J, Lax I, et al. Stereotactic radiotherapy of primary lung cancer and other targets: results of consultant meeting of the International Atomic Energy Agency. Int J Radiat Oncol Biol Phys. 2011;79:660–9. doi: 10.1016/j.ijrobp.2010.10.004. [DOI] [PubMed] [Google Scholar]
- 2.Onishi H, Shirato H, Nagata Y, et al. Stereotactic body radiotherapy (SBRT) for operable stage I lung cancer: can SBRT be comparable to surgery? Int J Radiat Oncol Biol Phys. 2011;81:1352–8. doi: 10.1016/j.ijrobp.2009.07.1751. [DOI] [PubMed] [Google Scholar]
- 3.Shirata Y, Jingu K, Kubozono M, et al. Prognostic factors for local control of stage I non-small cell lung cancer in stereotactic radiotherapy: a retrospective analysis. Radiat Oncol. 2012;7:182. doi: 10.1186/1748-717X-7-182. [DOI] [PMC free article] [PubMed] [Google Scholar]
- 4.Lagerwaard FJ, Verstegen NE, Haasbeek CJ, et al. Outcomes of stereotactic ablative radiotherapy in patients with potentially operable stage I non-small cell lung cancer. Int J Radiat Oncol Biol Phys. 2012;83:348–53. doi: 10.1016/j.ijrobp.2011.06.2003. [DOI] [PubMed] [Google Scholar]
- 5.Dunlap NE, Larmer JM, Read PW, et al. Size matters: a comparison of T1 and T2 peripheral non-small-cell lung cancers treated with stereotactic body radiation therapy (SBRT) J Thorac Cardiovasc Surg. 2010;140:583–9. doi: 10.1016/j.jtcvs.2010.01.046. [DOI] [PubMed] [Google Scholar]
- 6.Koto M, Takai Y, Ogawa Y, et al. A phase II study on stereotactic body radiotherapy for stage I non-small cell lung cancer. Radiother Oncol. 2007;85:429–34. doi: 10.1016/j.radonc.2007.10.017. [DOI] [PubMed] [Google Scholar]
- 7.Onimaru R, Fujino M, Yamazaki K, et al. Steep dose–response relationship for stage I non–small-cell lung cancer using hypofractionated high-dose irradiation by real-time tumor-tracking radiotherapy. Int J Radiat Oncol Biol Phys. 2008;70:374–81. doi: 10.1016/j.ijrobp.2007.06.043. [DOI] [PubMed] [Google Scholar]
- 8.Fowler JF, Tome WA, Fenwick JD, et al. A challenge to traditional radiation oncology. Int J Radiat Oncol Biol Phys. 2004;60:1241–56. doi: 10.1016/j.ijrobp.2004.07.691. [DOI] [PubMed] [Google Scholar]
- 9.Matsumoto K, Jinzaki M, Tanami Y, et al. Virtual monochromatic spectral imaging with fast kilovoltage switching: improved image quality as compared with that obtained with conventional 120-kVp CT. Radiology. 2011;259:257–62. doi: 10.1148/radiol.11100978. [DOI] [PubMed] [Google Scholar]
- 10.Zhang D, Li X, Liu B. Objective characterization of GE Discovery CT750 HD scanner: gemstone spectral imaging mode. Med Phys. 2011;38:1178–88. doi: 10.1118/1.3551999. [DOI] [PubMed] [Google Scholar]
- 11.Pinho DF, Kulkarni NM, Krishnaraj A, et al. Initial experience with single-source dual-energy CT abdominal angiography and comparison with single-energy CT angiography: image quality, enhancement, diagnosis and radiation dose. Eur Radiol. 2013;23:351–9. doi: 10.1007/s00330-012-2624-x. [DOI] [PubMed] [Google Scholar]
- 12.Karçaaltıncaba M, Aktaş A. Dual-energy CT revisited with multidetector CT: review of principles and clinical applications. Diagn Interv Radiol. 2011;17:181–94. doi: 10.4261/1305-3825.DIR.3860-10.0. [DOI] [PubMed] [Google Scholar]
- 13.De Cecco CN, Darnell A, Rengo M, et al. Dual-energy CT: oncologic applications. AJR Am J Roentgenol. 2012;199:S98–105. doi: 10.2214/AJR.12.9207. [DOI] [PubMed] [Google Scholar]
- 14.Lee SH, Hur J, Kim YJ, et al. Additional value of dual-energy CT to difference between benign and malignant mediastinal tumors: an initial experience. Eur J Radiol. 2013;82:2043–9. doi: 10.1016/j.ejrad.2013.05.040. [DOI] [PubMed] [Google Scholar]
- 15.Moding EJ, Clark DP, Qi Y, et al. Dual-energy micro-computed tomography imaging of radiation-induced vascular changes in primary mouse sarcomas. Int J Radiat Oncol Biol Phys. 2013;85:1353–9. doi: 10.1016/j.ijrobp.2012.09.027. [DOI] [PMC free article] [PubMed] [Google Scholar]
- 16.Zhang LJ, Wu S, Wang M, et al. Quantitative dual energy CT measurements in rabbit VX2 liver tumors: Comparison to perfusion CT measurements and histopathological findings. Eur J Radiol. 2012;81:1766–75. doi: 10.1016/j.ejrad.2011.06.057. [DOI] [PubMed] [Google Scholar]
- 17.Klauss M, Stiller W, Pahn G, et al. Dual-energy perfusion-CT of pancreatic adenocarcinoma. Eur J Radiol. 2013;82:208–14. doi: 10.1016/j.ejrad.2012.09.012. [DOI] [PubMed] [Google Scholar]
- 18.Knöss N, Hoffmann B, Krauss B, et al. Dual energy computed tomography of lung nodules: differentiation of iodine and calcium in artificial pulmonary nodules in vitro. Eur J Radiol. 2011;80:e516–9. doi: 10.1016/j.ejrad.2010.11.001. [DOI] [PubMed] [Google Scholar]
- 19.Thieme SF, Johnson TRC, Lee C, et al. Dual-energy CT for the assessment of contrast material distribution in the pulmonary parenchyma. AJR Am J Roentgenol. 2009;93:144–9. doi: 10.2214/AJR.08.1653. [DOI] [PubMed] [Google Scholar]
- 20.Kawai T, Shibamoto Y, Hara M, et al. Can dual-energy CT evaluate contrast enhancement of ground-glass attenuation? Acad Radiol. 2011;18:682–9. doi: 10.1016/j.acra.2010.12.014. [DOI] [PubMed] [Google Scholar]
- 21.Ping W, Jiang WY, Chen WS, et al. Expression and significance of hypoxia inducible factor-1α and lysyl oxidase in non-small cell lung cancer. Asian Pac J Cancer Prev. 2013;14:3613–8. doi: 10.7314/apjcp.2013.14.6.3613. [DOI] [PubMed] [Google Scholar]
- 22.Kitada T, Seki S, Sakaguchi H, et al. Clinicopathological significance of hypoxia-inducible factor-1α expression in human pancreatic carcinoma. Histopathology. 2003;43:550–5. doi: 10.1111/j.1365-2559.2003.01733.x. [DOI] [PubMed] [Google Scholar]


