Abstract
We investigated the effect of different set-up error corrections on dose–volume metrics in intensity-modulated radiotherapy (IMRT) for prostate cancer under different planning target volume (PTV) margin settings using cone-beam computed tomography (CBCT) images. A total of 30 consecutive patients who underwent IMRT for prostate cancer were retrospectively analysed, and 7–14 CBCT datasets were acquired per patient. Interfractional variations in dose–volume metrics were evaluated under six different set-up error corrections, including tattoo, bony anatomy, and four different target matching groups. Set-up errors were incorporated into planning the isocenter position, and dose distributions were recalculated on CBCT images. These processes were repeated under two different PTV margin settings. In the on-line bony anatomy matching groups, systematic error (∑) was 0.3 mm, 1.4 mm, and 0.3 mm in the left–right, anterior–posterior (AP), and superior–inferior directions, respectively. ∑ in three successive off-line target matchings was finally comparable with that in the on-line bony anatomy matching in the AP direction. Although doses to the rectum and bladder wall were reduced for a small PTV margin, averaged reductions in the volume receiving 100% of the prescription dose from planning were within 2.5% under all PTV margin settings for all correction groups, with the exception of the tattoo set-up error correction only (≥5.0%). Analysis of variance showed no significant difference between on-line bony anatomy matching and target matching. While variations between the planned and delivered doses were smallest when target matching was applied, the use of bony anatomy matching still ensured the planned doses.
Keywords: intensity-modulated radiotherapy, set-up error correction, dosimetry, prostate cancer
INTRODUCTION
Intensity-modulated radiotherapy (IMRT) techniques allow the safe delivery of high-dose radiation to the prostate while sparing adjacent normal structures, including the rectum and bladder [1]. This requires accurate daily targeting throughout the entire course of IMRT. A number of researchers have investigated the localization and quantification of prostate displacement using implanted fiducial markers and several modalities, including kV X-ray planar images and cone-beam computed tomography (CBCT) [2–7]. Hammond et al. noted that residual set-up errors in the prostate with respect to the planned position remain, even after bone alignment [7]. In addition, several papers have described appropriate set-up error corrections for reducing residual set-up error using repeated CT scans [8, 9]. Hoogeman et al. and Snir et al. reported that residual set-up error in the prostate could be reduced using the data of four to five repeated CT scans with off-line corrections [8, 9]. Meanwhile, some researchers have analysed dose–volume metrics of the prostate, rectum and bladder after bone matching or target matching (using CT or CBCT images to assess the accuracy of the initial treatment plan) [5, 10]. To date, however, few studies have comprehensively investigated dose–volume metrics under the presence of residual set-up errors and different planning target volume (PTV) margin settings.
Here, we investigated the effect of different set-up error corrections on dose–volume metrics in IMRT for prostate cancer under different PTV margin settings using CBCT images.
MATERIALS AND METHODS
Patients
The study enrolled 30 consecutive patients who underwent IMRT for localized prostate cancer at our institution between April 2011 and November 2011 (Table 1). Written informed consent for IMRT was obtained from each patient before treatment planning. Patients were provided with written and verbal instructions regarding bowel and bladder preparation before simulation and treatment. They took one capsule of magnesium oxide (330 mg) orally three times per day to encourage defecation, and were instructed to empty their bowel and bladder, and then drink 300–500 ml water 1 h before the CT simulation and before each treatment.
Table 1.
Patient characteristics
| Age (years) |
||
|---|---|---|
| Median (range) | 71 (61–81) | |
| Prescription dose | ||
| 70 Gy | 8 | |
| 74 Gy | 12 | |
| 78 Gy | 10 | |
| CTV | ||
| Prostate + 1/3 SV | 9 | |
| Prostate + 2/3 SV | 20 | |
| Prostate + SV | 1 | |
CTV = clinical target volume, SV = seminal vesicles.
Planning CT data acquisition and IMRT planning
At the CT simulation, patients were positioned supine on the couch with the Hip-fix system, which includes the Pelvic-Board, Spread Leg Vac-lok cushion (CIVCO Medical Solutions, Kalona, IA), thermoplastic seat, and Foot-lok cushion (Med-Tech, Orange City, IA, USA) (Fig. 1). The Hip-fix system was developed in order to facilitate maintaining natural width of leg opening and leg rotations [11]. Planning CT images were then acquired using a 4-slice CT simulator (Light speed plus; General Electric Medical Systems, Waukesha, WI) with a 2.5-mm slice thickness without a gap from the iliac crest to 80 mm below the ischial tuberosities. When large amounts of bowel gas and stool in the rectal vault were observed, the patients were asked to empty their bowels and bladder by radiological technicians. After a second bowel and bladder preparation, a planning CT scan was done on the same day. A single experienced radiation oncologist removed bowel gas with a tube when large amounts of bowel gas were still present.
Fig. 1.
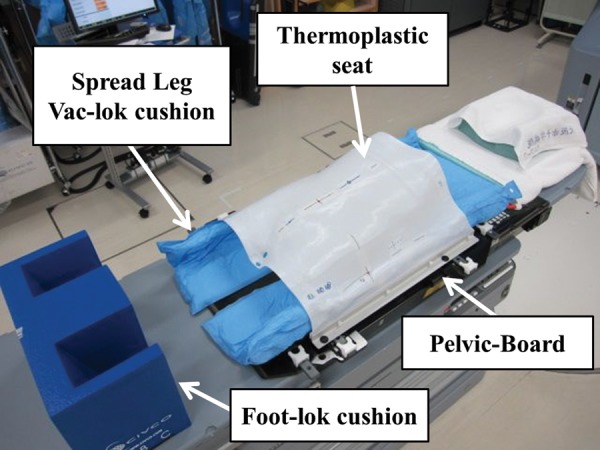
The Hip-fix system, which includes the Pelvic-Board, Spread Leg Vac-lok cushion, thermoplastic seat, and Foot-lok cushion.
After transfer of the CT images to a treatment-planning system [Eclipse Helios, ver. 8.6.15 (Varian Medical Systems, Palo Alto, CA)], the prostate, seminal vesicles (SVs), outer rectal wall, outer bladder wall, small bowel, and large bowel were manually contoured by the same medical physicist to eliminate interobserver variation. The rectal wall was automatically generated from the outer rectal wall using a wall-extraction function with a wall thickness of 4 mm from 10 mm below the apex of the prostate to 10 mm above the tips of the SVs. The bladder wall was also generated from the outer bladder wall in the same manner as the rectal wall, with a wall thickness of 4 mm. Clinical target volume (CTV) was determined as follows: (i) the union of prostate with the proximal one-third of the SVs for nine patients with a low- or intermediate-risk prostate cancer in Stage B, (ii) the union of prostate with the proximal two-thirds of the SVs for 20 patients with high-risk prostate cancer in Stage B, and (iii) the union of the prostate with the SVs for one patient with Stage T3b prostate cancer. In addition, the following two PTV margin settings were employed in the present study: (i) 8-mm margins isotropically, except for a 5-mm margin posteriorly (in the direction towards the rectum) and superiorly (in the caudal direction) (PTV8/5 groups), and (ii) 5-mm margins isotropically (PTV5/5 groups). Finally, all contours were reviewed by the radiation oncologist.
An IMRT plan was designed for each of the above PTV settings using Eclipse. The prescription doses were 70 Gy for eight patients, 74 Gy for 12 patients, and 78 Gy for 10 patients, at 2 Gy per fraction. Seven coplanar ports with gantry angles of 50°, 95°, 150°, 180°, 210°, 265° and 310° were selected for dose calculation. Beam energy and dose rate were a 10-MV photon beam and 300 MU/min, respectively. The well-commissioned Analytical Anisotropic Algorithm (ver. 8.6.15) with heterogeneity correction was used for dose calculation. Details regarding the dose–volume constraints were as follows (Table 2).
Table 2.
Dose–volume constraints in IMRT planning
| Structure | Dose–volume constraints |
|---|---|
| PTV | Maximum dose ≤110% |
| V90% > 96% (98%) | |
| D95% > 90% (95%) | |
| 99% ≤ Mean dose ≤103% | |
| Rectum wall | V40 Gy ≤ 60% |
| V60 Gy ≤ 30% | |
| V70 Gy ≤ 20% | |
| V78 Gy < 1% | |
| Bladder wall | V40 Gy ≤ 60% |
| V70 Gy ≤ 35% | |
| Large bowel | V65 Gy ≤ 0.5 ml |
| Small bowel | V60 Gy ≤ 0.5 ml |
Values in parentheses are preferable. PTV = Planning target volume, V90% = volume receiving 90% of the prescription dose, D95% = dose received by 95% volume, Vxx Gy = the volume receiving more than xx Gy.
PTV
(i) The maximum dose should be <110%; (ii) the volume receiving 90% of the prescription dose should generally be≥ 96% (≥98% is preferable); (iii) the dose received by 95% volume should generally be ≥90% (≥95% is preferable); and (iv) the mean dose should generally be 99–103% of the prescription dose.
Rectum wall
(i) No more than 60% of the rectum wall volume should receive >40 Gy; (ii) no more than 30% of the rectum wall volume should receive >60 Gy, (3) no more than 20% of the rectum wall volume should receive >70 Gy, and (4) no more than 1% of the rectum wall volume should receive >78 Gy.
Bladder wall
(i) No more than 60% of the bladder wall volume should receive >40 Gy, and (ii) no more than 35% of the bladder wall volume should receive >70 Gy.
Large bowel
No more than 0.5 ml of the large bowel should receive >65 Gy.
Small bowel
No more than 0.5 ml of the small bowel should receive >60 Gy.
Orthogonal kV X-ray planar images and CBCT data acquisition
Prior to irradiation, patients were first aligned based on tattoos on the skin indicating the planning isocenter (IC) location with a system of wall-mounted alignment lasers. A pair of orthogonal kV X-ray planar images was then obtained using the on-board imager systems of a Clinac iX (Varian Medical Systems, Palo Alto, CA). These kV X-ray planar images were manually aligned to their corresponding digitally reconstructed radiographs by therapists and independently verified by physicians. The manual alignment provided left–right (LR), anterior–posterior (AP), and superior–inferior (SI) couch shifts, which were applied to the treatment couch. Respective couch shift values show the matching difference between the laser and kV image.
After correcting initial set-up errors based on bony anatomy, a CBCT scan was sequentially acquired on first, second and third fractions, and thereafter on the first day of the week. The maximum reconstructed field-of-view was a circle of 450 mm diameter and 180 mm in length. For each patient, seven to 14 (average nine) CBCT datasets were acquired during the whole treatment course of 7–8 weeks. When target positions were deviated from the PTV, we confirmed the target position on second CBCT images after the initial target matching.
The prostate, bladder wall and rectum wall were again determined (in the same manner as described in ‘Planning CT data acquisition and IMRT planning’) on the acquired CBCT datasets. Center of mass (COM) mismatches for the prostate between the planning CT and each CBCT dataset were then calculated in the LR, AP and SI directions. In the present study, rotational errors were not evaluated. Subsequently, the systematic variation ∑ (standard deviation of the average shifts for the patient cohort) and the random variation σ (root-mean-square of the standard deviations of the shifts for all patients) were calculated for the LR, AP and SI directions.
Set-up corrections
To evaluate interfractional variations in dose–volume metrics under different set-up error corrections, six set-up error corrections were employed as follows.
SEtattoo
Patients were aligned only based on the tattoos.
SEbone
After aligning patients based on the tattoos, set-up error was corrected on-line based on bony anatomy using orthogonal kV X-ray planer images.
SECOM1
Set-up error on second and later fractions was corrected off-line based on the COM of the first CBCT acquisition only.
SECOM2
Set-up error on the third and later fractions was corrected off-line based on the averaged COM of the first two CBCT acquisitions.
SECOM3
Set-up error on the fourth and later fractions was corrected off-line based on the averaged COM of the first three CBCT acquisitions.
SECOMall
Set-up error was corrected virtually on-line based on the COM of every CBCT acquisition.
Dose recalculation on CBCT images under the different set-up corrections above
After incorporating these set-up errors into planning the IC position, dose distributions were recalculated on CBCT images under the same conditions as in planning using the electron density conversion table obtained from the planning CT scanner. Although CBCT-based treatment plans are dosimetrically comparable with planning CT-based plans [12], there are some differences in the electron density conversion tables between planning CT and CBCT [13]. In the present study, after comparing the IC dose on CBCT images with that on the planning CT, the IC dose on CBCT images was normalized to that on the planning CT plan based on the results presented by Hatton et al. [10]. Accordingly, monitor units were different from the planned ones.
Dose–volume metrics of the prostate, rectum wall and bladder wall were calculated from the relevant histograms. As for the rectum wall and bladder wall, V90% and V100% (volumes receiving 90% and 100%, respectively, of the prescription dose) were obtained, because higher doses have more impact on the complication probability [14]. Results for different set-up corrections were compared using analysis of variance (ANOVA) with Dunnett tests, where P < 0.05 was considered statistically significant.
RESULTS
COM distance
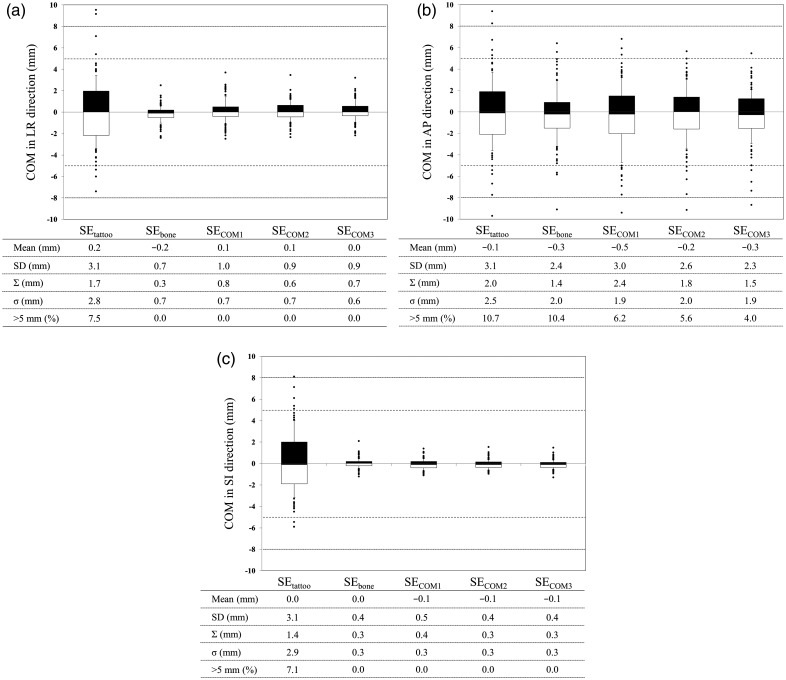
The COM distances with the respective set-up error corrections are shown in Fig. 2. Mean ± SD of set-up error in the LR, AP and SI directions was 0.2 ± 3.1 mm, −0.1 ± 3.1 mm, and 0.0 ± 3.1 mm, respectively, in the SEtattoo groups, versus −0.2 ± 0.7 mm, −0.3 ± 2.4 mm, and 0.0 ± 0.4 mm, respectively, in the SEbone groups, showing a significant difference between these two groups (P < 0.05). Mean ± SD of set-up errors for the SECOM groups (excluding the SECOM1 groups) was comparable with that of the SEbone groups in all directions (Fig. 2).
Fig. 2.
COM distance in the (a) LR, (b) AP, and (c) SI direction. Dose analysis parameters are graphically presented in box plots (showing medians, and 25th and 75th percentiles) with whiskers (10th and 90th percentiles); outliers are shown as dots. ‘ >n mm (%)’ means a frequency of displacement of >n mm.
∑ and σ were <1.0 mm in the LR and SI directions, respectively, except in the SEtattoo groups. ∑ was < 2.0 mm in the AP direction, except in the SECOM1 groups (2.4 mm), in which σ was <2.0 mm. ∑ in the SECOM3 groups was comparable with that in the SEbone groups in the AP direction. The frequency of >5.0 mm displacement in the AP direction was 10.7% in the SEtattoo, 10.4% in the SEbone, 6.2% in the SECOM1, 5.6% in the SECOM2, and 4.0% in the SECOM3 groups. Meanwhile, the frequency of > 8.0 mm displacement in the AP direction was 2.2% in the SEtattoo, 1.3% in the SEbone, 0.5% in the SECOM1, 0.6% in the SECOM2, and 0.7% in the SECOM3 groups.
Dosimetric evaluation
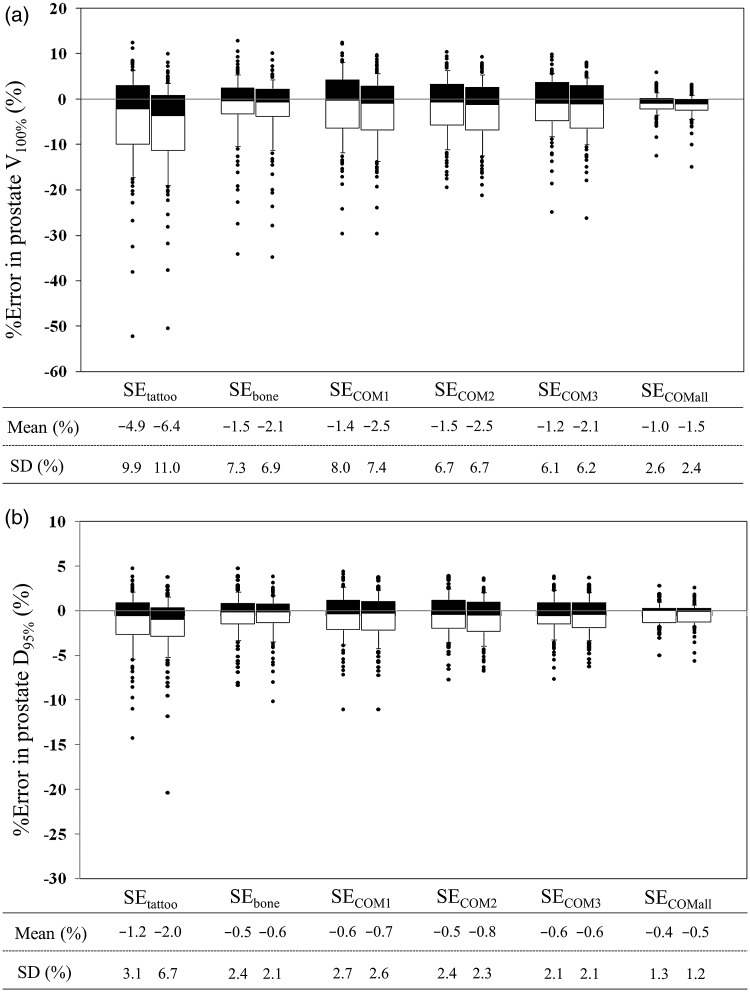
Figure 3 shows interfractional variation in prostate V100% and D95% (the dose delivered to 95% of the prostate volume) for the PTV8/5 and PTV5/5 groups. Averaged reductions in prostate V100% and D95% were within 2.5% and 1.0%, except for the SEtattoo groups. ANOVA showed a statistically significant difference between the SEtattoo and SEbone groups (P < 0.05); however, no significant difference was seen between the SEbone and other SECOM groups.
Fig. 3.
Interfractional variation in prostate (a) V100% and (b) D95%. Data are shown in percentage points. In each set-up correction policy, the left and right box plots show data in the PTV8/5 and PTV5/5 groups, respectively. Dose analysis parameters are graphically presented in box plots (showing medians, and 25th and 75th percentiles) with whiskers (10th and 90th percentiles); outliers are shown as dots.
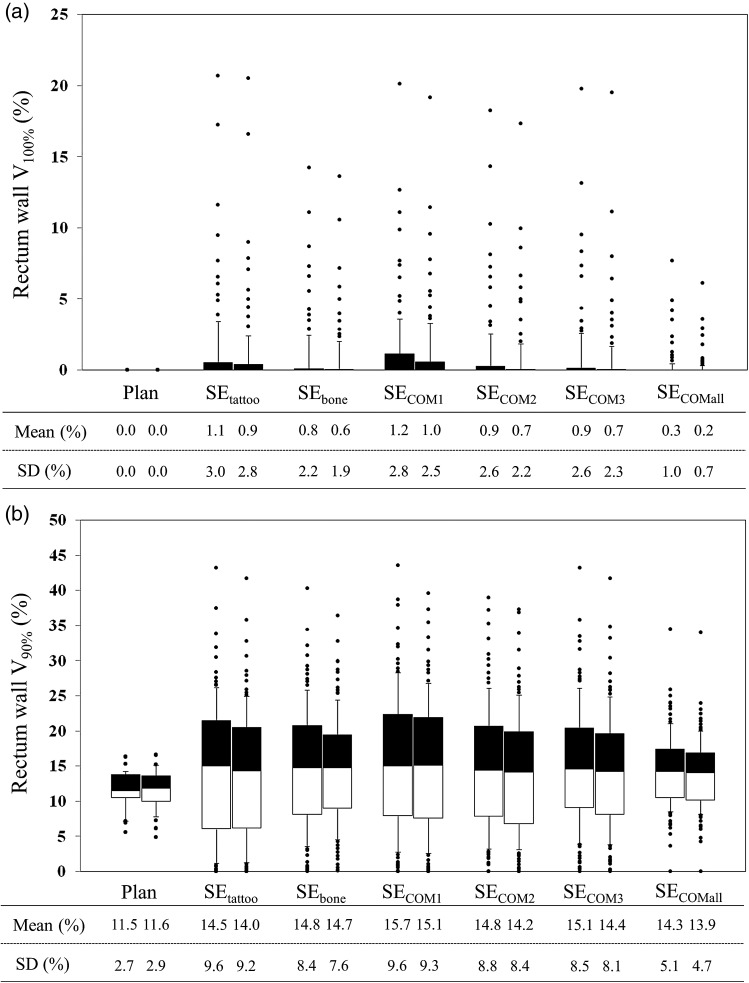
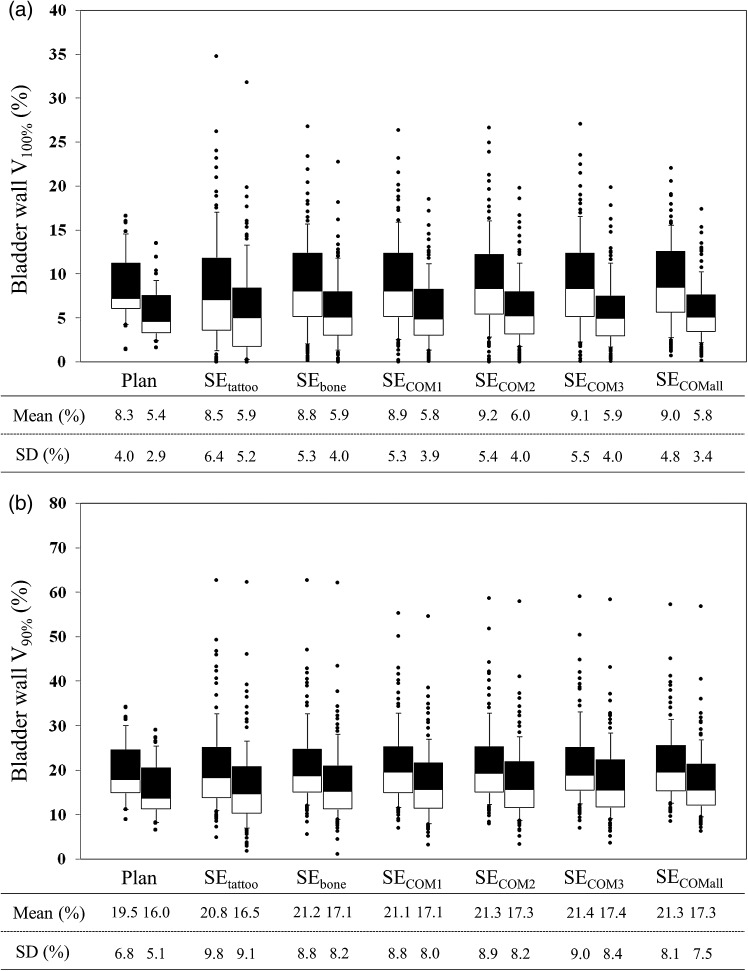
Compared with the planned dose for the rectum wall and bladder wall, V100% and V90% were delivered an excessive dose (Figs 4 and 5). Significant differences in these dose–volume metrics were seen between the SEtattoo and other groups (P < 0.05).
Fig. 4.
Interfractional change in rectum wall (a) V100% and (b) V90%. For each set-up correction policy, the left and right box plots show data in the PTV8/5 and PTV5/5 groups, respectively. Dose analysis parameters are graphically presented in box plots (showing medians, and 25th and 75th percentiles) with whiskers (10th and 90th percentiles); outliers are shown as dots.
Fig. 5.
Interfractional change in bladder wall (a) V100% and (b) V90%. For each set-up correction policy, the left and right box plots show data in the PTV8/5 and PTV5/5 groups, respectively. Dose analysis parameters are graphically presented in box plots (showing medians, and 25th and 75th percentiles) with whiskers (10th and 90th percentiles); outliers are shown as dots.
Compared with the PTV8/5 margin groups, the SD of the prostate V100% and D95% were increased, while the rectum V100% and V90% and bladder V100% and V90% were decreased for the PTV5/5 margin groups (Figs 4 and 5); however, there were no significant differences in averaged dose–volume metrics between the PTV8/5 margin and PTV5/5 margin groups.
DISCUSSION
Hammond et al. evaluated residual set-up errors using CBCT images, and reported that the total mean ± SD for five patients was 0.7 ± 0.6 mm, 1.6 ± 1.2 mm and 1.4 ± 1.0 mm in the LR, AP and SI directions, respectively [7]. Compared with the results of their study, residual set-up errors based on bony anatomy were smaller in our study. One possible reason for this difference is a decrease in statistical uncertainty, given the small number of patients (n = 5) in their study. Recently, many studies have reported on set-up error corrections using implanted fiducial markers. Interestingly, some of these reported the presence of prostate motion against the bony anatomy [15–17]. McNair et al. reported that systematic error (calculated using gold markers rather than bony anatomy) was >2.0 mm different in at least one direction in 50% of patients (with a difference >5.0 mm in 13% of patients) using fiducial markers as opposed to bony anatomy [17]. In the present study, fiducial markers were not implanted for all participating patients, and the COM mismatches were calculated based on the delineated prostate. Nevertheless, our results for prostate displacement from the bony anatomy were comparable with their results. Displacement in the AP direction may be attributable to contraction of pelvic muscles or a change in rectal volume [18, 19]. Of all set-up error correction policies, the SECOM1 groups had the largest ∑ in the AP direction (2.4 mm), indicating that systematic set-up error cannot be reduced by a single measurement only. Prostate position in the first fraction is less representative; a decrease in systematic set-up errors therefore requires multiple positional data for the prostate.
In order to reduce the risk of toxicity, it is important to set valid dose–volume constraints. According to the report published by Michalski et al., most dose–volume parameters significantly associated with late rectal toxicity considered doses ≥60 Gy [14]. Our dose–volume constraints to the rectum wall (Table 2) satisfied their recommended dose–volume limits [14]. However, it is generally known that interfractional variations in doses to organs at risk (OARs) occur. Kupelian et al. [5], Hatton et al. [10] and van Haaren et al. [20] all reported that rectal doses were generally higher than the planned dose. These results are consistent with those of our present study (Figs 4 and 5). Variations in the volume and shape of OARs (and a different set-up from the planning) cause interfractional variations in doses to OARs, which would result in unintentional toxicities, even with well-established dose–volume constraints; therefore, the preparation prior to treatment and the establishment of a matching protocol are required to control the variations. Figures 4 and 5 revealed that set-up error correction based on target matching was effective in minimizing the interfractional variations in doses to OARs, while the tattoos-based set-up error correction caused the largest ones. These results indicated that it is preferable to employ target matching when bowel gas and stool are present.
Our results showed that the margin reduction plan allowed sparing of the bladder and rectal high-dose regions as indicated by Hammond et al. [7]. Our present retrospective analysis found that no significant differences in the prostate V100% and D95% between the PTV8/5 margin and PTV5/5 margin groups were observed, even under bony set-up correction when employing our CTV determination policy and immobilization system. Recently, Engels et al. have reported a potential danger posed by image-guidance techniques with regard to PTV margin reduction [21]; thus, the differences in a treatment protocol, including CTV determinations, PTV margin settings and immobilization systems, would influence treatment outcomes, even with full use of the image-guidance function.
Three limitations of our study warrant mention. (i) CBCT was not scanned at the time of delivery of every fraction. Certainly, it is preferable to acquire CBCT data for accurate evaluation because the shape of the OAR and prostate changes daily; however, we decided not to do this with a view to minimizing exposure [22]. From our results, the number of CBCT data was sufficient to evaluate dosimetry. (ii) Intrafractional prostate motion was not considered. Several reports on the intrafractional motion have been published to date [23–25]. The representative intrafractional motions are respiratory motion and baseline drift of prostate position. In general, respiratory motion of the prostate was mostly less than our PTV margin size of 5 mm [23, 24]; therefore, respiratory motion would have little influence on the dosimetry. However, baseline drift will cause unpredictable systematic errors [25], which cannot be quantified on CBCT images. To address this issue, real-time monitoring is required. (iii) Deformable image registration (DIR) methods were not used. Song et al. previously reported that a change in the volume and shape of organs had only a moderate influence on dosimetry for prostate cancer, even if DIR methods were used [26]; accordingly, we expected that no significant difference would be seen in dosimetry between delivery with and without DIR.
CONCLUSION
We retrospectively analyzed the dose delivered to the prostate, rectal wall and bladder wall in a total of 270 CBCT sets from 30 consecutive prostate cancer patients treated with IMRT under the six different set-up error corrections and two PTV margin settings. The dose distributions obtained with a set-up correction based on tattoo only were significantly worse than those yielded by the others. As expected, variations between the planned and delivered doses were smallest when target matching was applied. However, the use of bony set-up correction still ensured the delivery of planned doses in IMRT for prostate cancer. In addition, doses to OARs were reduced by shrinking the PTV margin size; however, interfractional variations in dose–volume metrics were almost fully consistent in the PTV8/5 and PTV5/5 groups, even under different set-up error corrections.
FUNDING
This work was supported by a Grant-in-Aid for Young Scientists (B) from the Ministry of Education, Culture, Sports, Science, and Technology, Japan [Grant number 23791408]. Funding to pay the Open Access publication charges for this article was provided by a Grant-in-Aid for Scientific Research from the Japanese College of Medical Physics for 2012.
REFERENCES
- 1.Zelefsky M-J, Chan H, Hunt M, et al. Long-term outcome of high dose intensity modulated radiation therapy for patients with clinically localized prostate cancer. J Urol. 2006;176:1415–9. doi: 10.1016/j.juro.2006.06.002. [DOI] [PubMed] [Google Scholar]
- 2.Marta A, Piotrowskia T, Adamiak E. Evaluation of combining bony anatomy and soft tissue position correction strategies for IMRT prostate cancer patients. Rep Pract Oncol Radiother. 2012;17:104–9. doi: 10.1016/j.rpor.2012.01.005. [DOI] [PMC free article] [PubMed] [Google Scholar]
- 3.Barney B-M, Lee R-J, Handrahan D, et al. Image-guided radiotherapy (IGRT) for prostate cancer comparing kV imaging of fiducial markers with cone beam computed tomography (CBCT) Int J Radiat Oncol Biol Phys. 2011;80:301–5. doi: 10.1016/j.ijrobp.2010.06.007. [DOI] [PubMed] [Google Scholar]
- 4.Johnston M-L, Vial P, Wiltshire K-L, et al. Daily online bony correction is required for prostate patients without fiducial markers or soft-tissue imaging. Clin Oncol. 2011;23:454–9. doi: 10.1016/j.clon.2011.02.013. [DOI] [PubMed] [Google Scholar]
- 5.Kupelian P-A, Langen K-M, Zeidan O-A, et al. Daily variation in delivered doses in patients treated with radiotherapy for localized prostate cancer. Int J Radiat Oncol Biol Phys. 2006;66:876–82. doi: 10.1016/j.ijrobp.2006.06.011. [DOI] [PubMed] [Google Scholar]
- 6.Moseley D-J, White E-A, Wiltshire K-L, et al. Comparison of localization performance with implanted fiducial markers and cone-beam computed tomography for on-line image-guided radiotherapy of the prostate. Int J Radiat Oncol Biol Phys. 2007;67:942–53. doi: 10.1016/j.ijrobp.2006.10.039. [DOI] [PMC free article] [PubMed] [Google Scholar]
- 7.Hammoud R, Patel S-H, Pradhan D, et al. Examining margin reduction and its impact on dose distribution for prostate cancer patients undergoing daily cone-beam computed tomography. Int J Radiat Oncol Biol Phys. 2008;71:265–73. doi: 10.1016/j.ijrobp.2008.01.015. [DOI] [PubMed] [Google Scholar]
- 8.Hoogeman M-S, van Herk M, de Bois J, et al. Strategy to reduce the systematic error due to tumor and rectum motion in radiotherapy of prostate cancer. Radiother Oncol. 2005;74:177–85. doi: 10.1016/j.radonc.2004.12.010. [DOI] [PubMed] [Google Scholar]
- 9.Snir J-A, Battista J-J, Bauman G, et al. Evaluation of inter-fraction prostate motion using kilovoltage cone beam computed tomography during radiotherapy. Clin Oncol. 2011;23:625–31. doi: 10.1016/j.clon.2011.03.007. [DOI] [PubMed] [Google Scholar]
- 10.Hatton J-A, Greer P-B, Tang C, et al. Does the planning dose–volume histogram represent treatment doses in image-guided prostate radiation therapy? Assessment with cone-beam computed tomography scans. Radiother Oncol. 2011;98:162–8. doi: 10.1016/j.radonc.2011.01.006. [DOI] [PubMed] [Google Scholar]
- 11.van Herk M, Bruce A, Guus Kroes A-P, et al. Quantification of organ motion during conformal radiotherapy of the prostate by three dimensional image registration. Int J Radiat Oncol Biol Phys. 1995;33:1311–20. doi: 10.1016/0360-3016(95)00116-6. [DOI] [PubMed] [Google Scholar]
- 12.Yoo S, Yin F-F. Dosimetric feasibility cone-beam CT-based treatment planning computed to CT-based treatment planning. Int J Radiat Oncol Biol Phys. 2006;66:1553–61. doi: 10.1016/j.ijrobp.2006.08.031. [DOI] [PubMed] [Google Scholar]
- 13.Boggula R, Lorenz F, Abo-Madyan Y, et al. A new strategy for online adaptive prostate radiotherapy based on cone-beam CT. Z Med Phys. 2009;19:264–76. doi: 10.1016/j.zemedi.2009.05.007. [DOI] [PubMed] [Google Scholar]
- 14.Michalski J-M, Gay H, Jackson A, et al. Radiation dose–volume effects in radiation-induced rectal injury. Int J Radiat Oncol Biol Phys. 2010;76:S123–9. doi: 10.1016/j.ijrobp.2009.03.078. [DOI] [PMC free article] [PubMed] [Google Scholar]
- 15.Moseley D-J, White E-A, Wiltshire K-L, et al. Comparison of localization performance with implanted fiducial markers and cone-beam computed tomography for on-line image-guided radiotherapy of the prostate. Int J Radiat Oncol Biol Phys. 2007;67:942–53. doi: 10.1016/j.ijrobp.2006.10.039. [DOI] [PMC free article] [PubMed] [Google Scholar]
- 16.Beltran C, Herman M-G, Davis B-J. Planning target margin calculations for prostate radiotherapy based on intrafraction and interfraction motion using four localization methods. Int J Radiat Oncol Biol Phys. 2008;70:289–95. doi: 10.1016/j.ijrobp.2007.08.040. [DOI] [PubMed] [Google Scholar]
- 17.McNair H-A, Hansen V-N, Parker C-C, et al. A comparison of the use of bony anatomy and internal markers for offline verification and an evaluation of the potential benefit of online and offline verification protocols for prostate radiotherapy. Int J Radiat Oncol Biol Phys. 2008;71:41–50. doi: 10.1016/j.ijrobp.2007.09.002. [DOI] [PubMed] [Google Scholar]
- 18.Onishi H, Kuriyama K, Komiyama T, et al. Large prostate motion produced by anal contraction. Radiother Oncol. 2012;104:390–4. doi: 10.1016/j.radonc.2012.04.005. [DOI] [PubMed] [Google Scholar]
- 19.Keros L, Bernier V, Aletti P, et al. Qualitative estimation of pelvic organ interactions and their consequences on prostate motion: study on a deceased person. Med Phys. 2006;33:1902–10. doi: 10.1118/1.2198190. [DOI] [PubMed] [Google Scholar]
- 20.van Haaren P-M, Bel A, Hofman P, et al. Influence of daily setup measurements and corrections on the estimated delivered dose during IMRT treatment of prostate cancer patients. Radiother Oncol. 2009;90:291–8. doi: 10.1016/j.radonc.2008.12.021. [DOI] [PubMed] [Google Scholar]
- 21.Engels B, Soete G, Verellen D, et al. Conformal arc radiotherapy for prostate cancer: increased biochemical failure in patients with distended rectum on the planning computed tomogram despite image guidance by implanted markers. Int J Radiat Oncol Biol Phys. 2009;74:388–91. doi: 10.1016/j.ijrobp.2008.08.007. [DOI] [PubMed] [Google Scholar]
- 22.NCRP. Implementation of the principle of as low as reasonably achievable (ALARA) for medical and dental personnel. NCRP Report 107, National Council on Radiation Protection & Measurements, 1990. [Google Scholar]
- 23.Kitamura K, Shirato H, Seppenwoolde Y, et al. Three-dimensional intrafractional movement of prostate measured during real-time tumor-tracking radiotherapy in supine and prone treatment positions. Int J Radiat Oncol Biol Phys. 2002;53:1117–23. doi: 10.1016/s0360-3016(02)02882-1. [DOI] [PubMed] [Google Scholar]
- 24.Bittner N, Butler W-M, Reed J-L, et al. Electromagnetic tracking of intrafraction prostate displacement in patients externally immobilized in the prone position. Int J Radiat Oncol Biol Phys. 2010;77:490–5. doi: 10.1016/j.ijrobp.2009.05.033. [DOI] [PubMed] [Google Scholar]
- 25.Xie Y, Djajaputra D, King C-R, et al. Intrafractional motion of the prostate during hypofractionated radiotherapy. Int J Radiat Oncol Biol Phys. 2008;72:236–46. doi: 10.1016/j.ijrobp.2008.04.051. [DOI] [PMC free article] [PubMed] [Google Scholar]
- 26.Song W-Y, Wong E, Bauman G-S, et al. Dosimetric evaluation of daily rigid and nonrigid geometric correction strategies during on-line image-guided radiation therapy (IGRT) of prostate cancer. Med Phys. 2007;34:352–65. doi: 10.1118/1.2405325. [DOI] [PubMed] [Google Scholar]


