What is ECS and why is it important?
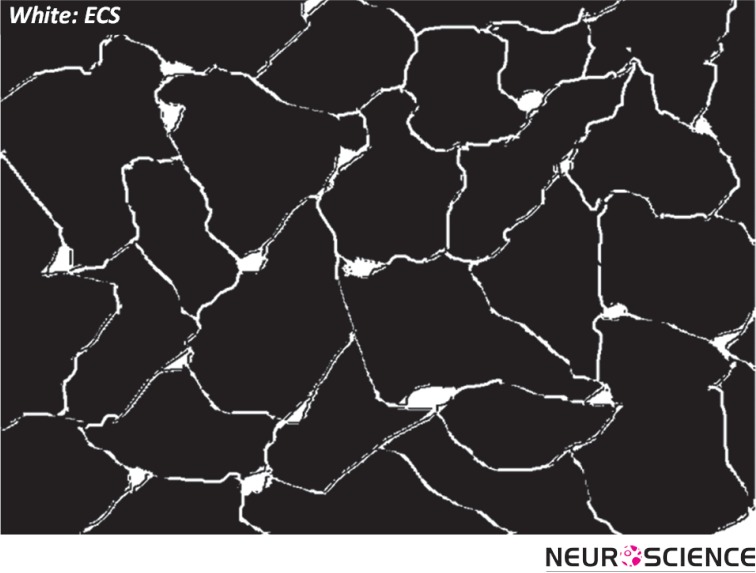
Brain tissue is essentially composed of two regions: cellular elements (neurons and glial cells), and the gap between the elements, which is known as the extracellular space (ECS; Figure 1) (Sykova & Nicholson, 2008). The ECS resembles the water phase of a foam and remains a highly connected domain even though it is convoluted in shape and may form deadspace microdomains (e.g. local expansions or voids) (Hrabetova, Hrabe, & Nicholson, 2003). The width of the ECS is about 20-60 nm (Thorne & Nicholson, 2006), nevertheless in totality it occupies approximately 20% of the entire tissue volume (Sykova & Nicholson, 2008) The surprisingly large relative volume of the ECS makes it an important area for neuroscience research.
Figure 1.
Schematic of brain cells and ECS. The ECS may have local expansions.
Extracellular space is the immediate external environment of brain cells. This proximity to the cell membrane makes the structure and content of the ECS important for cellular homeostasis and function. The ECS contains a fluid similar in composition to that found in the brain ventricles that maintains an ionic balance for Ca2 +, Na+, K+ and Cl- across the cell membrane. Such an ionic balance establishes the cellular resting potential and permits neuronal action potentials and synaptic transmission. The ECS also provides a communication channel between cells through which chemical signals travel; this is known as volume transmission (Agnati, Fuxe, Nicholson, & Sykova, 2000). Clinically, the ECS is an important route for the delivery of drugs after they have entered the brain (Wolak & Thorne, 2013).
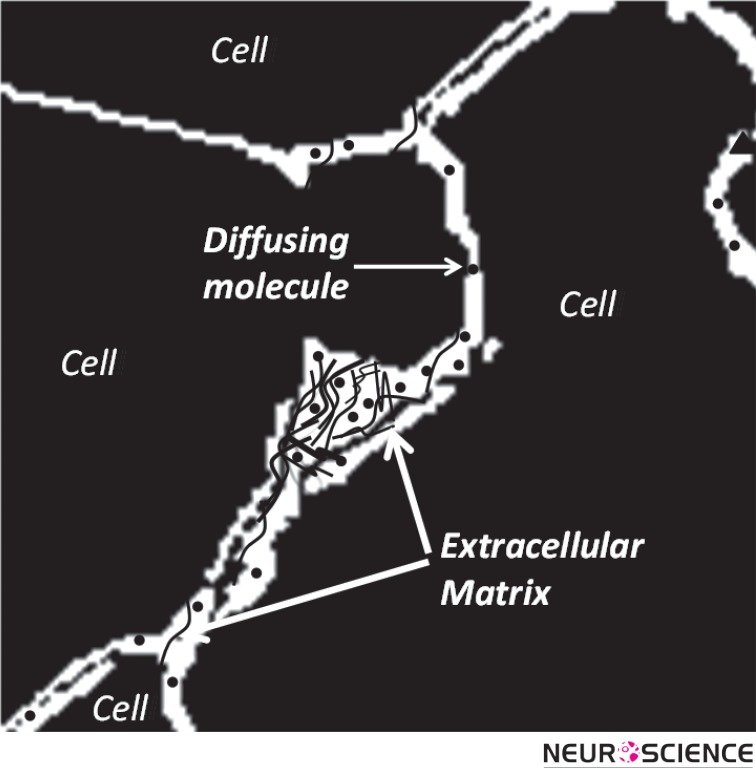
Besides an ionic fluid, the ECS accommodates an extracellular matrix formed from a meshwork of long-chain polymeric molecules and proteins (Figure 2). These include chondroitin sulfate, heparin sulfate and tenasin that often branch off from a hyaluronic acid backbone (Zimmermann & Dours-Zimmermann, 2008).
Figure 2.
Schematic of the extracellular matrix as a meshwork of long-chain molecules distributed in ECS.
Molecular Diffusion in ECS
Diffusion is the dominant mechanism for transport of substances in ECS and determines both the local and global distribution of many molecules.
Both geometry of ECS and the properties of the extracellular matrix affect diffusion. The geometry of the ECS hinders free diffusion of molecules in general, while the matrix may increase local viscosity or act more specifically on molecules that undergo steric or electrostatic binding with the matrix.
Among other factors, such as the local sources or sinks of molecules, diffusion depends on the space or volume fraction accessible to the molecules and the geometry of their path through the ECS. Volume fraction of ECS, α, is defined as the dimensionless parameter:
| 1 |
where VECS and VTissue are the volumes of ECS and the whole tissue respectively.
Molecular diffusion in ECS is similar to that in a porous medium and surprisingly, using only the classical theoretical framework for diffusion, we are able to characterize molecular diffusion in the brain (Nicholson & Phillips, 1981; Nicholson, 2001). This enables us to use a single diffusion coefficient (D*) to capture all the effects of the environment. Therefore D* is called the ‘effective diffusion coefficient’.
The magnitude of D* reflects the hindrance imposed by the geometry of the path, therefore D* < D, where D is the free diffusion coefficient. The dimensionless parameter tortuosity, λ, may be used to characterize the hindrance to diffusion where:
| 2 |
In addition to being affected by the geometry, the diffusing molecule may also interact with the matrix; this too can be incorporated into the tortuosity (Nicholson, Kamali-Zare, & Tao, 2011).
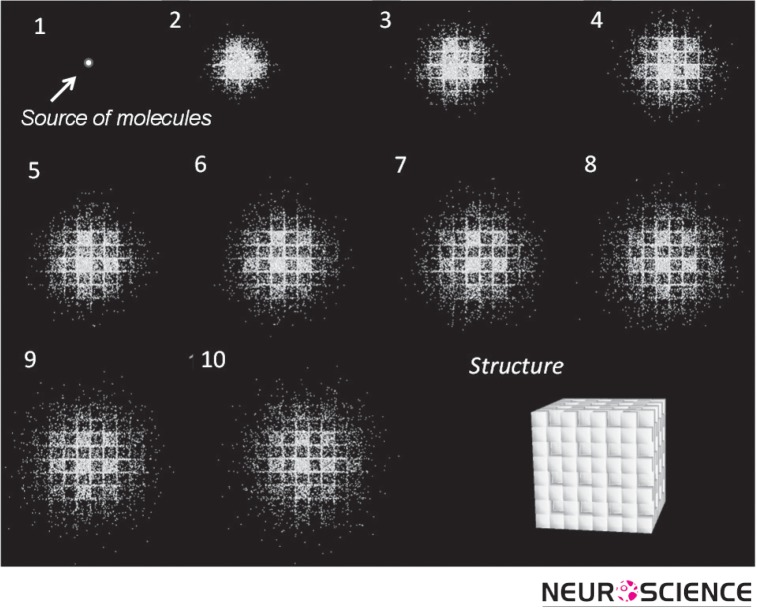
A measurement of tortuosity may be thought of as revealing properties of ECS itself (Nicholson & Sykova, 1998). When molecules are released from a source and make multiple random walks that are reflected from the multiple boundaries of the ECS, they effectively explore their microenvironment. If their collective behavior can be visualized, the local structure will ‘appear’. The simulation shown in Figure 3 exemplifies this concept by tracking a number of molecules released from a point source in the ECS at the center of an initially unseen structure. Then, following the molecules in time, the shape of the structure emerges. The structure is revealed to be an ensemble of cubes where one in every eight is missing, providing a local expansion of ECS that constitutes a dead-space (Figure 3, last panel).
Figure 3.
Projection from top of a simulation with a population of molecules released from a point source located at the center of a structure. As molecules diffuse, they make random walks and thereby reveal the structure of the local environment. The MCell program was used for simulation and DReAMM for visualization (see Modeling section).
The ECS has been most studied in neocortex, however there have been measurements in corpus callosum, hippocampus, cerebellum, caudate nucleus and spinal cord. In the cerebellar molecular layer and in regions containing major fiber bundles, diffusion is anisotropic, being different in different axes (Rice, Okada, & Nicholson, 1993).
How to Characterize ECS
Experiments provide values for volume fraction, tortuosity and some other parameters. Complementing experiments, modeling tests hypotheses about the factors that determine these parameter values. In addition, modeling establishes a solid theoretical framework for molecular diffusion in ECS. Modeling may provide a simpler alternative to experiments and sometimes may be the only way to proceed.
Experiments
The properties of the ECS have been studied with three main experimental techniques. The first is the radiotracer method in which a radio-labeled molecule, such as sucrose, is infused in a brain ventricle and its diffusion pattern is measured at later times in fixed brain tissue samples (Fenstermacher & Kaye, 1988). In the second technique, called the real-time iontophoretic (RTI) method, a small molecule, typically tetramethylammonium (TMA+) is released from a point source and its concentration at a short distance away, measured with an ionselective microelectrode (Nicholson & Phillips, 1981). The third method, known as integrative optical imaging (IOI), uses a fluorescently labeled macromolecule, such as dextran, or a protein molecule as a probe (Nicholson & Tao, 1993). The RTI and IOI methods were introduced by the Nicholson laboratory and provide real-time data in small brain regions.
Modeling
Here we summarize one modeling approach based on Monte Carlo simulation using the program MCell, (Stiles & Bartol, 2001; Nicholson, Kamali-Zare, & Tao, 2011). MCell was developed at the University of Pittsburgh, Supercomputing Center and Salk Institute for Biological Studies, as a modeling tool for realistic simulation of the behavior of molecules in the complex 3D microenvironments found in biological tissue. The main advantage of using MCell in ECS studies is that it can represent both the ramified geometry and the molecular interactions with the extracellular matrix.
The Monte Carlo method mimics actual diffusion. A large population of ‘molecules’ is released from an appropriate source and the molecules execute random walks in a specified geometry. They may interact with other molecules or sites through suitable kinetic reactions. After a certain time the distribution of the molecules is analyzed. In our applications the main output of an MCell simulation is D* (which is easily converted to the tortuosity). For a population of molecules released from the origin in a 3D medium, D* is calculated using the classical equation:
| 3 |
where r is the distance of each molecule from the source and <r2> represents the mean square distance of all molecules at time t after the molecules have been released.
Key Facts about ECS Derived from Experiments and Modeling
The basic quantitative parameters of ECS structure are volume fraction, α, and tortuosity, λ. Using the RTI method with TMA+ as a small probe molecule it has been established that α = 0.2 (this implies that the ECS occupies 20% of the brain) and λ = 1.6 (this implies that D* ≅ 0.4 D). This value of tortuosity is valid for molecules that are much smaller than the width of the ECS and do not interact with the extracellular matrix. If the molecules are much larger (Thorne & Nicholson, 2006) or reversibly bind to the matrix (Hrabetova, Masri, Tao, Xiao, & Nicholson, 2009), λ may be greater than 1.6. Figure 4 summarizes the two key players in all ECS narratives: ‘Geometry’ and ‘matrix’ and emphasizes that a study of diffusion is a key to understanding ECS structure and content.
Figure 4.
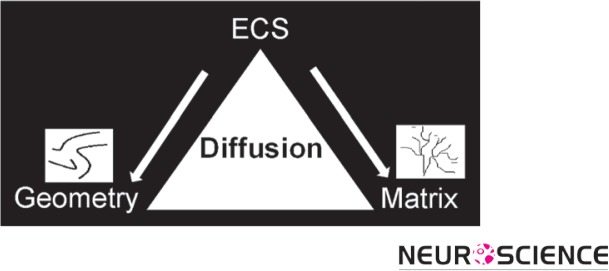
Schematic of major players in ECS: geometry and matrix. Diffusion can characterize both players.
Geometry of the Extracellular Space
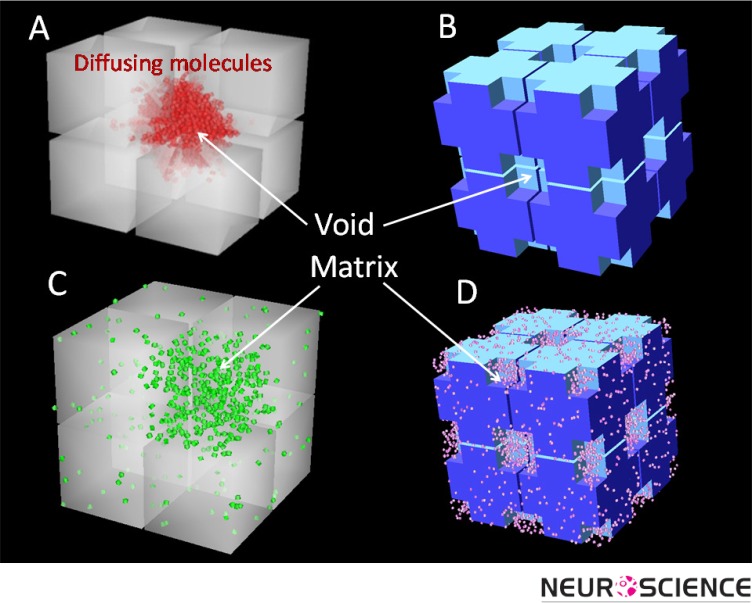
It appears that λ = 1.6 represents a fundamental constant of the ECS and it is pertinent to ask where the value comes from. Assuming that no matrix interaction is involved it is reasonable to look to ECS geometry for the answer.To address the role of structure, the Nicholson laboratory developed several models to explore idealized ECS geometry. The basic element of these structures is a single cube with a size similar to that of a brain cell body. In MCell simulations where many such cubes are packed together in a 3D geometry and separated from each other by a uniform ECS with a realistic width to ensure α = 0.2, it is found that λ = 1.18 (Tao & Nicholson, 2004). Clearly, this value is much smaller than the experimentally measured value of λ = 1.6. To try to increase this low tortuosity, a number of local voids, or dead-spaces, were introduced in the cube-ensembles (Figure 5). This strategy was able to increase λ to about 1.6 because when molecules enter these local voids, they are transiently held up in the region and their diffusion time is prolonged (Tao, Tao, & Nicholson, 2005). Dead-spaces in real biological tissue may be formed by local expansions of the ECS (voids), membrane invaginations or by glial cells wrapping around neurons (Hrabetova, Hrabe, & Nicholson, 2003; Hrabetova & Nicholson, 2004).
Figure 5.
Geometrical elements used to construct representative geometries of the brain for MCell simulations. Length of each cube side = 0.6 µm and the gap between cubes equals the width of the ECS (46 nm). A) Geometry with one out of eight cubes is missing to represent a local void. B) Geometry with voids generated from cutting off the corners of each cube (length of the void = 0.15 µm). C) The same geometry as Panel A filled with uniform matrix. D) The same geometry as Panel B filled with uniform matrix. Note that these ensembles of eight cubes are replicated many times to form a medium for the simulation.
Extracellular Matrix
In addition to the effect of the complex geometry of ECS, molecular diffusion is affected by the extracellular matrix. The matrix may react with suitable molecules through electrostatic or steric (actual binding and unbinding) interactions with the chondroitin sulfate (Hrabetova, Masri, Tao, Xiao, & Nicholson, 2009) or heparan sulfate (Thorne, Lakkaraju, Rodriguez-Boulan, & Nicholson, 2008) components of the matrix. Our current modeling studies aim to combine geometry and matrix to study how the two components interact to affect molecular diffusion (Figure 5C and 5D; Nicholson, Kamali-Zare, Tao, 2011).
ECS Applications
Research involving ECS ranges from basic to applied. Basic research aims to answer fundamental questions about how simple mechanisms lead to complex functions. For example, it is extending the concept of the ‘microdomain’ from being only the small region around single channels to being a larger domain spanning the spaces surrounding groups of cells. This links molecular and cellular level events to networks of cells with subtle interactions. This perspective may help our understanding of complex diseases, such as cancer, (Vargova et al., 2003) and brings ECS research into the realm of translational research where the knowledge of basic science is applied to find innovative ways to treat diseases.
Another translational research area where ECS studies are essential is drug delivery (Wolak & Thorne, 2013). Drugs may be introduced to the brain by infusion into ventricular or spinal cavities; this offers good distribution to the targets near the cavity, but poor penetration to more distant regions. Drugs may also enter the brain via the blood supply (following oral, intramuscular or intravenous administration) but they have to pass through blood-brain-barrier, which often restricts drug candidates to small lipophilic compounds. This method also lacks targeting to specific brain regions.
Finally, drugs may be introduced via direct injection through a cannula into brain or spinal cord. This method is called convection enhanced delivery (CED) and allows focal application to the target but it is invasive and has the potential for damage (Morrison, Laske, Bobo, Oldfield, & Dedrick, 1994). In all these methods of delivery the final common path for the drug to arrive at its destination is usually diffusion through the ECS.
Conclusions
The ECS is a vital but neglected component of the cell microenvironment. The properties of the ECS affect diffusion and local concentrations of many molecules within this narrow but complex space. It is important for creating the conditions that permit neuronal electrical and chemical activity and extracellular signaling via volume transmission.
The geometry of extracellular space and interaction with matrix combine to modify the free diffusion of molecules in the brain. This gives ECS the potential to regulate diffusion of each molecule individually and dispatch them to specific targets.
Research on the ECS has a wide range of applications from addressing fundamental questions to finding innovative ways to treat diseases and deliver drugs.
References
- Agnati, L. F., Fuxe, K., Nicholson, C., Sykova, E., 2000. Volume Transmission Revisited. Progress in Brain Research, vol. 125. Amsterdam: Elsevier [Google Scholar]
- Fenstermacher, J., & Kaye, T. (1988). Drug diffusion within the brain. Annals of the New York Academy of Sciences, 531, 29-39 [DOI] [PubMed] [Google Scholar]
- Hrabetova, S., Hrabe, J. & Nicholson, C. (2003). Dead-space microdomains hinder extracellular diffusion in rat neocortex during ischemia. Journal of Neuroscience 23(23): 8351-8359 [DOI] [PMC free article] [PubMed] [Google Scholar]
- Hrabetova, S., Masri, D., Tao, L., Xiao, F., & Nicholson, C. (2009). Calcium diffusion enhanced after cleavage of negatively charged components of brain extracellular matrix by chondroitinase ABC. Journal of Physiology, 587(16), 4029-4049 [DOI] [PMC free article] [PubMed] [Google Scholar]
- Hrabetova, S., & Nicholson, C. (2004). Contribution of deadspace microdomains to tortuosity of brain extracellular space. Neurochemistry International 45(4): 467-477 [DOI] [PubMed] [Google Scholar]
- Morrison, P. F., Laske, D. W., Bobo, H., Oldfield, E. H., Dedrick, R. L. (1994). High-flow microinfusion: tissue penetration and pharmacodynamics. American Journal of Physiology 266, R292-R305 [DOI] [PubMed] [Google Scholar]
- Nicholson, C. (2001). Diffusion and related transport mechanisms in brain tissue. Reports on Progress in Physics, 64(7): 815-884 [Google Scholar]
- Nicholson, C., Kamali-Zare, P., & Tao, L. (2011). Brain extracellular space as a diffusion barrier. Computing and Visualization in Science 14(7): 309-325 [DOI] [PMC free article] [PubMed] [Google Scholar]
- Nicholson, C., & Phillips, J. M. (1981). Ion diffusion modified by tortuosity and volume fraction in the extracellular microenvironment of the rat cerebellum. Journal of Physiology 321: 225-257 [DOI] [PMC free article] [PubMed] [Google Scholar]
- Nicholson, C., & Sykova, E. (1998). Extracellular space structure revealed by diffusion analysis. Trends in Neuroscience, 21(5), 207-215 [DOI] [PubMed] [Google Scholar]
- Nicholson, C., & Tao, L. (1993). Hindered diffusion of high molecular weight compounds in brain extracellular microenvironment measured with integrative optical imaging. Biophysical Journal, 65(6), 2277-2290 [DOI] [PMC free article] [PubMed] [Google Scholar]
- Rice, M. E., Okada, Y. C., & Nicholson, C. (1993). Anisotropic and heterogeneous diffusion in the turtle cerebellum: implications for volume transmission. Journal of Neurophysiology, 70(5): 2035-2044 [DOI] [PubMed] [Google Scholar]
- Stiles, J., & Bartol, T. (2001). Monte Carlo methods for simulating realistic synaptic microphysiology using MCell. Computational Neuroscience: Realistic Modeling for Experimentalists, ed. De Schutter E.CRC Press, Boca Raton: 87-127 [Google Scholar]
- Sykova, E., & Nicholson, C. (2008). Diffusion in brain extracellular space. Physiological Reviews, 88(4), 1277-1340 [DOI] [PMC free article] [PubMed] [Google Scholar]
- Tao, L., & Nicholson, C. (2004). Maximum geometrical hindrance to diffusion in brain extracellular space surrounding uniformly spaced convex cells. Journal of Theoretical Biology, 229(1), 59-68 [DOI] [PubMed] [Google Scholar]
- Tao, A., Tao, L., & Nicholson, C. (2005). Cell cavities increase tortuosity in brain extracellular space. Journal of Theoretical Biology, 234(4), 525-536 [DOI] [PubMed] [Google Scholar]
- Thorne, R. G., Lakkaraju, A., Rodriguez-Boulan, E., & Nicholson, C. (2008). In vivo diffusion of lactoferrin in brain extracellular space is regulated by interactions with heparan sulfate. Proceedings of the National Academy of Sciences of the United States of America, 105(24), 8416-8421 [DOI] [PMC free article] [PubMed] [Google Scholar]
- Thorne, R. G., & Nicholson, C. (2006). In vivo diffusion analysis with quantum dots and dextrans predicts the width of brain extracellular space. Proceedings of the National Academy of Sciences of the United States of America 103(14): 5567-5572 [DOI] [PMC free article] [PubMed] [Google Scholar]
- Vargova, L., Homola, A. Zamecnik, J., Tichy, M., Benes, V., & Sykova, E. (2003). Diffusion parameters of the extracellular space in human gliomas. Glia 42(1): 77-88 [DOI] [PubMed] [Google Scholar]
- Wolak, D. J., & Thorne, R. G. (2013). Diffusion of macromolecules in the brain: implications for drug delivery. Molecular Pharmaceutics. doi: 10.1021/mp300495e [DOI] [PMC free article] [PubMed] [Google Scholar]
- Zimmermann, D. R. & Dours-Zimmermann, M. T. (2008). Extracellular matrix of the central nervous system: from neglect to challenge. Histochemistry and Cell Biology 130(4): 635-653 [DOI] [PubMed] [Google Scholar]


