Summary
Our goal was to determine whether relative cerebral blood volume (rCBV) can serve as an adjunct to histopathologic grading in the assessment of gliomas, with the hypothesis that rCBV can predict two-year survival. We evaluated 29 newly diagnosed gliomas (13 WHO grade II, seven grade III, nine grade IV; 17 astrocytomas, 12 oligodendroglial tumors). Dynamic susceptibility-weighted contrast-enhanced perfusion MR images and CBV maps were obtained. rCBVmax measurements (maximum tumor CBV/contralateral normal tissue CBV) and progression-free survival (PFS) were recorded. Receiver operating characteristic curves and Kaplan-Meier survival curves were calculated for rCBVmax and histologic grade. rCBVmax measurements differed between gliomas without (2.38 +/– 1.22) and with progression (5.57 +/– 2.84) over two years. The optimal rCBVmax cut-off value to predict progression was 2.95. rCBVmax < 2.95 was a significant predictor of two-year PFS, almost as accurate as WHO grade II. In the pure astrocytoma subgroup, the optimal rCBVmax cut-off value to predict progression was 2.85. In this group rCBVmax < 2.85 was a significant predictor of two-year PFS, an even better predictor of two-year PFS than WHO grade II. rCBVmax can be used to predict two-year PFS in patients with gliomas, independent of pathologic findings, especially in tumors without oligodendroglial components.
Keywords: brain tumors, glioma, MR imaging, MR perfusion, progression-free survival
Introduction
Gliomas include tumors with heterogeneous biological aggressiveness and prognosis. Treatment strategies vary greatly, with the most aggressive multimodal treatment (surgery, chemotherapy and radiation) reserved for the most malignant neoplasms, in an attempt to improve their prognosis 1,2.
Various prognostic factors have been identified, including clinical characteristics, therapeutic measures, morphological neuroimaging findings, and more recently bio-molecular features 1-9. Nevertheless, the actual gold standard in the stratification of tumor prognosis remains the histopathological WHO grading system 10, requiring invasive tissue sampling through biopsy or surgical excision. Histopathological grading has its own limitations, including the risks of death (0.9%) and major morbidity (4%) related to tissue sampling, and inaccurate or imprecise diagnosis in one-third to one-half of cases 11. Diagnostic inaccuracy may result from intratumoral grade heterogeneity, leading to sampling errors, and inter- and intra-individual disagreement in pathology interpretation, especially when the sample is obtained by means of a stereotactic biopsy 1,4,12-14.
Hence, less invasive, more reliable and objective criteria to assess tumor malignancy and biological aggressiveness would have a positive impact on prognosis prediction and treatment planning 7,15. In particular, magnetic resonance perfusion-weighted imaging (PWI) using a dynamic susceptibility-weighted contrast-enhanced (DSC) technique with relative cerebral blood volume (rCBV) measurements has the capability to assess tumor vascularity, one of the well-recognized histological parameters that correlates with malignancy in brain gliomas 16,17.
Various studies 14,16,18-22 have shown that rCBV measurements predict prognosis in parallel with histological grade and overcome the limitation of sampling errors 10. rCBV measurements were useful to predict low-grade glioma prognosis also when data obtained at two different institutions were combined 23. In a recent retrospective study Bisdas et al. 18 established that rCBV values are predictive of recurrence and one-year survival in pure astrocytomas, but not when the entire study cohort including astrocytic and oligodendroglial tumors was considered, and that rCBV values may be a useful adjunct to histopathologic grading in predicting prognosis. The purpose of this study was to retrospectively assess whether rCBV measurements can predict two-year progression-free survival (PFS) in treatment-naïve gliomas. Our hypothesis was that rCBV values are reliable predictors of two-year PFS in all patients with glioma, including oligodendroglial tumors.
Materials and Methods
Subjects
This study was approved by the Institutional Review Board and the study was compliant with the requirements of the Health Insurance Portability and Accountability Act. Informed consent for this study was waived given its retrospective nature. In an earlier study 18, we retrospectively evaluated patients with pathologically confirmed gliomas treated by the neurosurgical and neuro-oncology services at our institution between October 2002 and November 2007. We again retrospectively assessed all glioma patients evaluated at our institution during the same time frame and therefore our study population substantially overlaps with the group of patients described by Bisdas et al. Specifically nine grade II (four astrocytomas, three oligodendrogliomas, two oligoastrocytomas), five grade III (four astrocytomas, one oligoastrocytoma), and eight grade IV gliomas included in our study were also previously reported. However a clinical follow-up of at least 24 months or until the occurrence of clinical-radiological progression was available for all patients, while in our previous report a follow-up of only 12 months was available 20.
Inclusion criteria for the study were: a) histopathologic diagnosis of cerebral glioma according to the World Health Organization (WHO) criteria; b) availability in our Picture Archiving and Communication System of a preoperative brain MRI scan obtained before biopsy or surgical resection at our institution including perfusion-weighted imaging; c) clinical follow-up of at least 24 months or until clinical-radiological progression. The exclusion criteria were as follows: a) evidence of systemic malignancy or metastatic disease; b) immune status compromise; c) prior stereotactic biopsy; d) any form of treatment before imaging including radiotherapy, chemotherapy, surgery and corticosteroids; e) grade I gliomas, because we were not interested in the correlation between rCBV values and two-year PFS in these neoplasms with very low malignant potential. Finally, retrospective analyses yielded 29 patients (15 male, median age 46 years, range 13-82 years). All patients had pathology proven gliomas and pathologic specimens had been obtained either by stereotactically guided biopsy or surgical resection. Biopsies were performed in the region of the tumor with the highest rCBV to minimize sampling error. All tumors were examined by one experienced neuropathologist and graded according to the WHO classification system 24,25: 17 patients with astrocytomas (four WHO II, four WHO III, nine WHO IV), 12 patients with oligodendroglial tumors (nine WHO II, six oligodendrogliomas, three oligoastrocytomas; three WHO III oligoastrocytomas).
Histopathological diagnosis was established by means of surgical biopsy in two patients with WHO grade II gliomas, and subtotal or gross total tumor resection in 11 WHO grade II gliomas. After surgery four patients with low grade glioma with oligodendroglial components received adjuvant chemotherapy with a high dose of temozolomide (five days per week every 28 days) and three patients with low grade astrocytomas received adjuvant radiotherapy (45-54 Gy in 1.8-2.0 fractions) 25. Fifteen patients with high-grade tumors (WHO grades III and IV) underwent surgical resection. In one case the diagnosis of anaplastic astrocytoma was made following stereotactic biopsy. After surgery all patients with high-grade tumors were treated with radiation therapy with 60 Gy (five days per week for six weeks). Patients with WHO grade IV tumors also received concomitant chemotherapy for six weeks; adjuvant chemotherapy was subsequently administered for six additional cycles 26. Chemotherapy consisted of temozolomide in standard doses of 150 mg/m2 for the first cycle and 200 mg/m2 for subsequent cycles. All patients underwent routine clinical follow-up from the time of initial diagnosis until disease progression. In subjects without disease progression clinical data were available from the time of initial diagnosis until December 2010.
We reviewed clinical and MRI data available for all patients. Clinical evaluation, including the Karnofsky Performance Score (KPS), was conducted by a neuro-oncologist and MR imaging occurred at two to six month intervals or upon symptoms deterioration as per standard of care. PFS was retrospectively calculated from the medical records considering the date of the initial PWI scan as the reference point. We divided patients into two groups based on the presence or absence of disease progression within 24 months from the date of the MRI scan. Progression was defined based on established guidelines 27.
MR Imaging
MR imaging was performed on a 1.5 T scanner (Intera; Philips Medical Systems, Best, The Netherlands). The perfusion study was included in the standard clinical MRI protocol for evaluation of brain tumors. The MRI protocol consisted of a three-plane localizer sequence, sagittal T1-weighted images, axial 3D T1-weighted gradient-echo images, axial diffusion-weighted images, axial fast spin-echo FLAIR and T2-weighted sequences, first-pass DSC perfusion weighted-images, and post-contrast axial 3D T1-weighted gradient-echo images. DSC imaging was conducted using the following technique: single-shot GRE echo-planar images were acquired before, during, and after rapid administration of a contrast bolus (40 sections with a section thickness of 5 mm, TR/TE 17/17 ms, flip angle 7°, matrix size 64×64 interpolated to 128×128, field of view 230 mm). A single standard dose (0.1 mmol/ kg) of gadopentetate dimeglumine contrast agent was administered intravenously using a power injector through an 18 gauge intravenous line at a rate of 5 mL/s, followed by 20 mL of saline at the same injection rate. Each perfusion series consisted of 50 dynamic images with a total acquisition time of 128 seconds.
rCBV Maps and Measurements
DSC studies were loaded and postprocessed on a free-standing Viewforum workstation (Philips Medical Systems) and CBV maps were calculated off-line. CBV maps were determined by numerically integrating the area under the fitted concentration-time curve. Conventional MR images, raw T2* images and processed CBV maps were reviewed at the workstation by two neuroradiologists working in consensus, blinded to the histological diagnosis, clinical data and treatment. First of all, a 6×6 pixel (corresponding to an area of 10.8 mm2) region of interest (ROI) was placed within the tumor on the CBV maps in the area with the highest visually identifiable CBV values and with the lowest possible SD between adjacent pixels. The mean CBV value within this first ROI was recorded. Secondly, the entire tumor was outlined and a single pixel region of interest with the maximum tumor CBV value across all tumor sections was chosen. We inspected dynamic perfusion series to verify that no tumor ROIs were placed over macroscopic blood vessels. The values of the two ROIs were recorded for each patient. The CBV values in the corresponding contralateral normal tissue were used to obtain normalized rCBV values. The normalized rCBV values were computed as the ratio of the mean and maximal tumor CBV divided by contralateral normal tissue CBV and were recorded as normalized mean and maximum rCBV (rCBVmean and rCBVmax, respectively). Selection of very small ROIs allowed the acquisition of measurements from tumor sites with the highest rCBV values, the lowest standard deviation (SD) and the least partial volume averaging with neighbouring vascular structures and CSF-containing spaces 28.
Statistical Analysis
All analyses and graphs were performed with the Statistical Package for the Social Sciences, Version 16.0 for Windows (SPSS, Chicago, IL, USA). Continuous variables are presented as mean ± SD. Normality of distribution for all continuous variables was determined by the Shapiro-Wilk test. Comparisons of variables were performed using parametric and non-parametric tests based on normality of data. Spearman correlation coefficient analysis was used to detect any significant correlation among continuous and interval-scaled variables. Receiver operating characteristic (ROC) curves were constructed using various cut-off rCBV values to distinguish patients with survival shorter or longer than two years. The ROC curves were also calculated with WHO grade as an input parameter. The areas under the ROC curves, a measure of diagnostic accuracy, were calculated and compared. Kaplan-Meier survival curves were generated for the dichotomized perfusion values and histological grade parameters (WHO grade II versus III-IV). Results were considered significant at the two-sided 5% significant level (p< .05).
Results
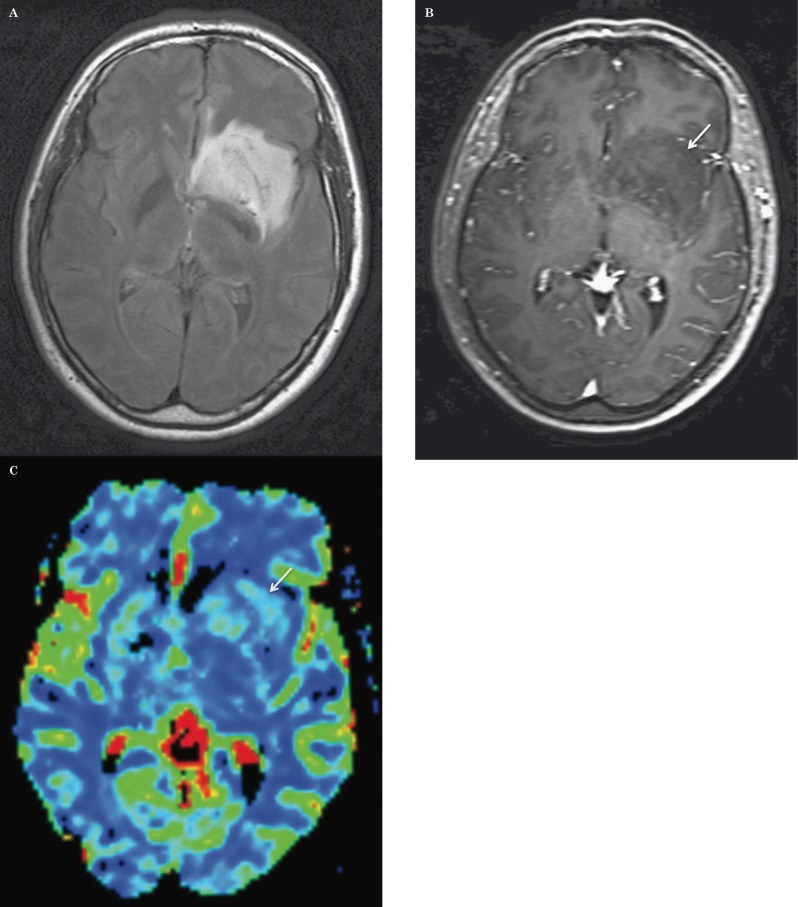
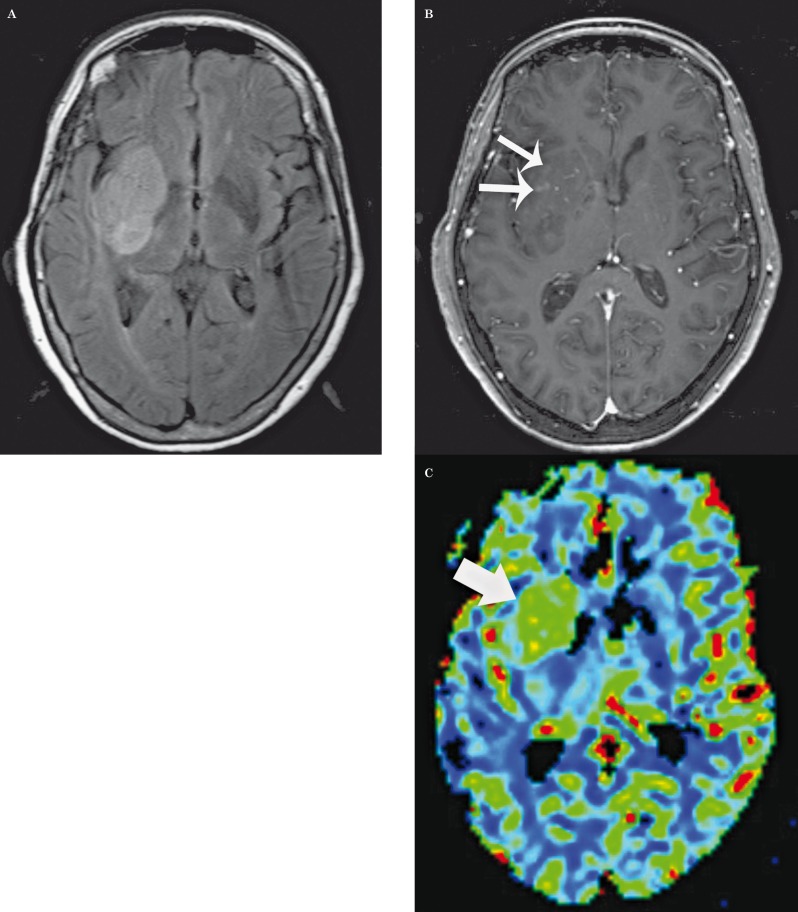
Average progression-free survival was 847 (+/−699) days for the entire sample and 632 (+/−762) for the pure astrocytic tumor group. Thirteen patients (five WHO grade III, two of which had oligodendroglial components; eight WHO grade IV tumors) experienced tumor progression during the first two years after the initial diagnosis (Figures 1 and 2).
Figure 1.
Low grade astrocytoma: axial FLAIR (A), post-contrast T1-weighted (B) images, and corresponding relative cerebral blood volume (CBV) map (C) demonstrate a left basal ganglia mass with subtle punctate areas of enhancement and without increased CBV. There was no progression of disease during two years of follow-up.
Figure 2.
Glioblastoma multiforme: axial FLAIR (A), post-contrast T1-weighted (B) images, and corresponding relative CBV map (C) demonstrate a relatively homogenous and well-defined right basal ganglia mass with only a few ill-defined foci of enhancement (small arrows), but with increased CBV (large arrow). There was progression of disease within 90 days.
Correlation coefficients were calculated between interval and continuous variables for the entire glioma population (Table 1). In the mixed glioma population we found statistically significant correlations between rCBVmax, PFS, KPS, and WHO grading (Figure 3). We also found statistically significant correlations between rCBVmean, PFS, KPS, and WHO grading. When tumors with oligodendroglial components were excluded, we found even stronger correlations between rCBV measurements, clinical variables and WHO grading than in the whole glioma population Table 2.
Table 1.
Correlation coefficients between interval and continuous variables in mixed glioma population.
| rCBVmax | rCBVmean | PFS | KPS | WHO | |||
| rCBVmax | Correlation/Coefficient Significance (2-tailed) |
. |
.935 .000 |
−.590 .001 |
−.536 .012 |
.553 .002 |
|
| rCBVmean | Correlation/Coefficient Significance (2-tailed) |
.935 .000 |
. |
−.563 .002 |
−.575 .006 |
.559 .002 |
|
rCBVmax: maximum relative cerebral blood volume
rCBVmean: mean relative cerebral blood volume
PFS: progression-free survival
KPS: Karnofsky Performance Score
WHO: World Health Organization grading of cerebral gliomas
Table 2.
Correlation coefficients between interval and continuous variables in pure astrocytic tumors.
| rCBVmax | rCBVmean | PFS | KPS | WHO | |||
| rCBVmax | Correlation/Coefficient Significance (2-tailed) |
. |
.941 .000 |
-.768 .001 |
-.720 .008 |
.591 .012 |
|
| rCBVmean | Correlation/Coefficient Significance (2-tailed) |
.941 .000 |
. |
-.743 .001 |
-.744 .005 |
.707 .001 |
|
rCBVmax: maximum relative cerebral blood volume
rCBVmean: mean relative cerebral blood volume
PFS: progression-free survival
KPS: Karnofsky Performance Score
WHO: World Health Organization grading of cerebral gliomas
Figure 3.
Scatter plot of relative cerebral blood volume max versus progression-free survival in days by WHO grade.
Given the strong correlation between rCBVmax and rCBVmean (correlation coefficients of 0.935 for all gliomas, and of 0.941 for pure astrocytic tumors) we only used rCBVmax in subsequent analyses, as we thought it was a more reproducible measure than rCBVmean.
Maximal normalized rCBV measurements were significantly different (p = 0.001) between gliomas with clinical and radiological progression (average rCBVmax 5.57 +/− 2.84) and without progression (average rCBVmax 2.38 +/− 1.22) over the course of two years. When tumors with oligodendroglial components were excluded, rCBVmax was also significantly greater (p = 0.001) in the recurrent/progressive neoplasm group (rCBVmax 6.30 +/− 2.42) than in tumors without disease progression over two years (rCBVmax 1.93+/− 0.59).
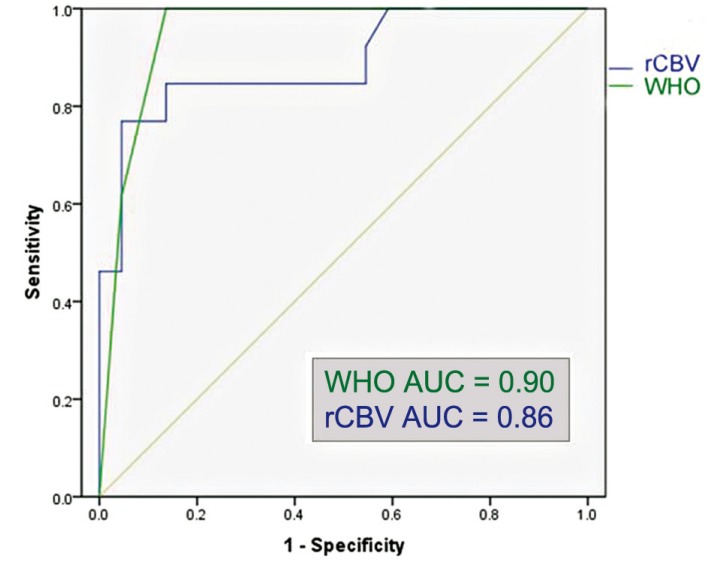
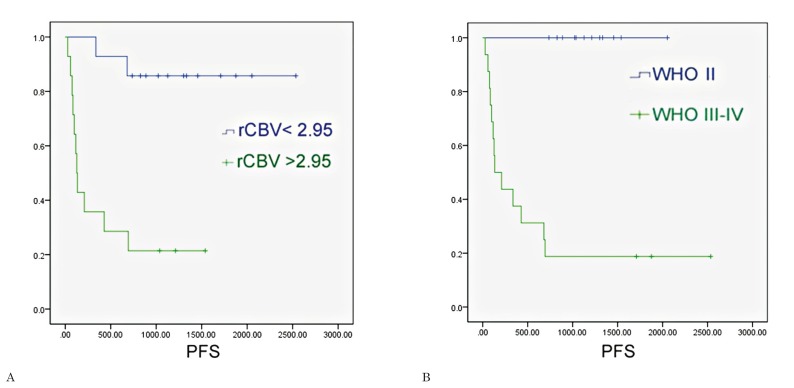
The ROC analysis for the entire glioma population showed that the optimal rCBVmax cut-off value in the identification of gliomas with progression within two years was 2.95 (sensitivity of 84.6%, specificity of 81.2%, area under the curve = 0.86); the ROC analysis showed that WHO grade III-IV had a sensitivity of 81.2% and specificity of 100% in the identification of gliomas with progression within two years (area under the curve = 0.90) (Figure 4). The Kaplan Meier analysis showed that rCBVmax < 2.95 was found to be a significant predictor of two-year PFS (χ2=13.61, p<0.001), almost as accurate as the WHO grade II (χ2=17.38, p<0.001) (Figure 5).
Figure 4.
Region operating characteristic (ROC) curve of normalized maximal relative cerebral blood volume (rCBV) and World Health Organization grading (WHO) versus 2-year progression-free survival in all gliomas (N = 29). AUC = area under the curve.
Figure 5.
Survival curves were generated for all gliomas using (A) dichotomized perfusion values (threshold of normalized maximal relative cerebral blood volume = 2.95); (B) histological grading (WHO = II versus WHO = III-IV).
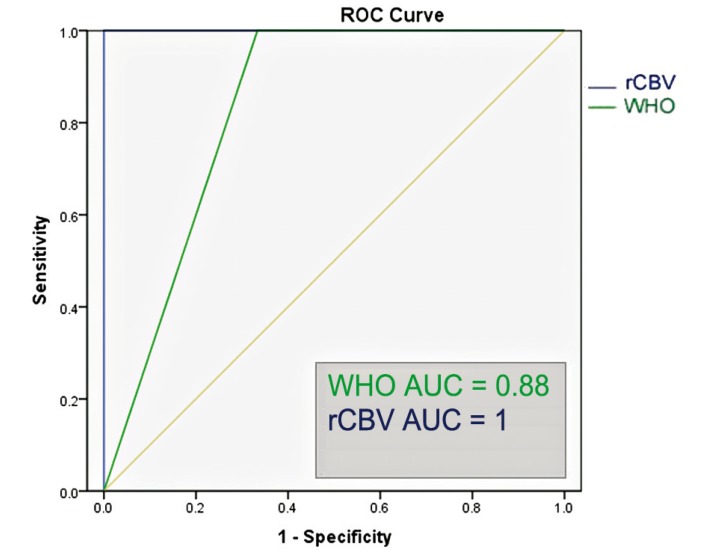
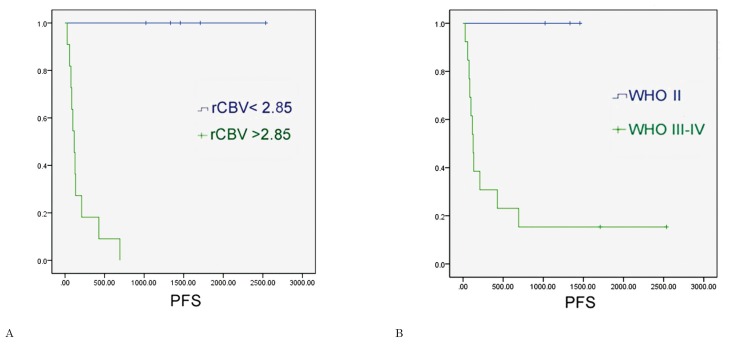
In the subgroup of gliomas without oligodendroglial tumors, the ROC analysis showed that the optimal rCBV cut-off value in the identification of progressive gliomas was 2.85 (sensitivity of 100%, specificity of 100%, area under the curve = 1); the ROC analysis showed that WHO grade III-IV had a sensitivity of 84.6% and specificity of 100% in the identification of astrocytic gliomas with progression within two years (area under the curve = 0.88) (Figure 6). The Kaplan Meier analysis showed that rCBVmax < 2.85 was a significant predictor of two-year PFS (χ2=12.20, p<0.001), and an even better predictor of two-year PFS than WHO grade II (χ2=4.91, p=0.027) (Figure 7). We did not conduct statistical analyses on the oligodendroglial tumor subgroup because of the small sample size (N = 12).
Figure 6.
Region operating characteristic (ROC) curve of relative maximal cerebral blood volume and World Health Organization grading (WHO) versus 2-year progression-free survival in pure astrocytic tumors (N = 17). AUC = area under the curve.
Figure 7.
Survival curves were generated for pure astrocytic tumors using (A) dichotomized perfusion values (threshold of relative maximal cerebral blood volume = 2.85); (B) histological grading (WHO = II versus WHO =III-IV).
Discussion
In our retrospective series of pathologically proven gliomas (pure astrocytomas, oligoastrocytomas, oligodendrogliomas) rCBVmax measurements on pre-treatment MRI strongly correlated with KPS at diagnosis and WHO grading, and more importantly with two-year PFS. In addition, rCBVmax was a better predictor of two-year survival than WHO grading in the pure astrocytoma subgroup.
To date, management of cerebral gliomas remains a challenge. Therapeutic strategies for gliomas are based at present on the WHO grading obtained by means of stereotactic biopsy or surgical resection. However pathological diagnosis suffers from inherent limitations, due to sampling errors and intra- and inter-observer interpretative errors that in turn may result in inappropriate treatment 10. In fact gliomas with pathological diagnosis of WHO grade II may show an aggressive course 32, while some high-grade gliomas behave less aggressively than expected 33. Furthermore, neurosurgical tumor sampling carries the potential risk of complications and morbidity. Therefore a non-invasively obtained outcome-based classification would be of greater value, allowing the use of prognostic factors to tailor individual therapy regimens 14,29.
Our findings indicate that rCBV measurements can be useful in the prediction of PFS, tumor aggressiveness, and clinical outcome. rCBVmax measurements were significantly higher in gliomas that showed progression (either clinically, as indicated by decrease in KPS, or based on radiological signs of progression) than gliomas which were stable over a two-year follow-up period. The difference in rCBVmax values between tumors with and without two-year PFS was stronger in the pure astrocytic glioma group. However, a statistically significant difference persisted even when oligodendroglial tumors were included. The ROC analysis and Kaplan-Meyer survival curves showed that a rCBVmax value of 2.95 was the optimal cut-off in the stratification of patients with and without disease progression over the course of two years, with accuracy similar to the WHO grading. When we evaluated the pure astrocytic glioma group, an rCBVmax cut-off value of 2.85 proved to be an even better indicator of PFS at two years than WHO grading.
These findings confirm and expand the results of prior studies on the use of PWI measurements to establish glioma prognosis. Law et al. found that rCBV measurements significantly differ among gliomas with complete treatment response, stable disease, progressive disease and death 20. In this study, survival was significantly different between patients with rCBV higher and lower than 1.75, a threshold value which had previously proved useful in the identification of high-grade gliomas by the same group 30. These authors found that rCBV measurements correlated more accurately with time-to-progression than initial WHO grading and suggested that rCBV may be a useful in vivo second reference standard in the management of low-grade gliomas. Danchaivijitir et al. longitudinally evaluated low-grade gliomas using PWI measurements and found that DSC perfusion imaging can demonstrate significant increase in rCBV months before contrast enhancement becomes apparent on T1-weighted images in low-grade gliomas with malignant transformation 15. Hirai et al. assessed the prognostic value of perfusion MRI in a population of high-grade gliomas, excluding neoplasms with oligodendroglial components, and found that pre-treatment rCBV measurements can be used to predict two-year PFS 19. Mills et al. evaluated the correlation between survival and T1-weighted dynamic MR perfusion metrics in a population of WHO grade II-IV gliomas and found a linear relationship between length of survival and volume transfer coefficient (Ktrans), a measure of endothelial permeability 22. Bisdas et al. evaluated 34 patients with WHO grade I-IV gliomas and found that rCBV measurements significantly correlated with one-year PFS and disease progression only when oligodendroglial tumors were excluded 18. This is likely due to the confounding effect of low-grade oligodendroglial tumors which often display foci of elevated rCBV, despite a more indolent clinical course 21.
In our series there were eight cases in which WHO grading and rCBV estimates based on the above-described thresholds were discordant. Three high-grade gliomas had rCBVmax <2.95 and PFS greater than 1500 days (two WHO grade III gliomas with PFS of 1709 and 1876; one WHO grade IV glioma with PFS of 2536 days). Previous studies have shown that 3-5% of patients with glioblastoma, the so-called long-term survivors, survive for more than three years 31. Our observation of an unusually long PFS and relatively low rCBVmax in a patient with GBM confirms the role of MR perfusion in the prognostic stratification of patients with high-grade gliomas 19. Three WHO grade II oligodendroglial tumors with rCBVmax > 2.95 had a PFS greater than 1000 days (1213, 1540, and 1037 respectively). This is not an unexpected finding due to the known relative hypervascularity and more indolent clinical behaviour of low-grade oligodendroglial compared to low-grade pure astrocytic gliomas 21. Furthermore, increased tumor perfusion has been described in WHO grade II oligodendroglial tumors in association with 1p/19q loss of heterozygosity, a predictor of radio and chemosensitivity and better survival, than in tumors with intact allele or 19q loss of heterozygosity only 32. Furthermore, Jenkinson et al. found that high tumoral rCBV measurements were predictors of 1p/19q loss of heterozygosity in oligodendroglial tumors 33. Unfortunately, the 1p and 19q status was not tested in our series of tumors, therefore the incidence of 1p and 19q heterozygosity in the oligodendroglial tumors and its correlation with tumor perfusion cannot be determined. In our sample there were no additional WHO grade II tumors with rCBVmax > 2.95 aside from the above-mentioned oligodendroglial tumors, in particular there were no cases of pathology proven low-grade glioma with elevated rCBVmax and rapid progression. Finally, two WHO grade III oligodendroglial tumor had rCBVmax < 2.95 and a clinical and radiological progression within two years (PFS= 337 and 681 days). The inclusion of survival and perfusion data obtained from these five patients with oligodendroglial tumors might explain why the correlation of PFS and rCBV was slightly weaker in the whole glioma group compared to the pure astrocytic tumors.
One of the strengths of our study was the fact that we avoided the bias of using the WHO grading as a standard of reference. We did not attempt to predict cut-off rCBVmax values with respect to the WHO grading in the evaluation of gliomas. In our series maximal rCBVmax obtained at the time of diagnosis proved useful to non-invasively predict prognosis at two years, irrespective of WHO grading. Our results highlight the potential role of rCBVmax as an independent prognostic indicator and as an adjunct to WHO grading, able to overcome some of the limitations of the histopathological grading. Specifically, in patients with histologically confirmed high-grade gliomas low rCBVmax values may indicate a relatively favorable prognosis. By contrast, in patients with imaging features of low-grade tumors high rCBVmax values would suggest the need for a more aggressive therapeutic approach, timely biopsy-surgical resection, and/or closer interval MR imaging. In patients with a diagnosis of low-grade glioma based on stereotactic biopsy or limited resection, rCBV sampling of the entire tumor would be an important adjunct to better understand the true malignant potential of a neoplasm and in guiding further therapeutic intervention 14. Baseline rCBV measurements were useful to predict two-year PFS in gliomas regardless of the specific glioma subtype. Our results suggest that the previously described confounding effect of elevated rCBV measurements in low-grade oligodendroglial tumors 18,21 becomes less significant in the prediction of disease progression when evaluating a longer endpoint, specifically two-year PFS. This study shows that the use of baseline rCBV measurements is a robust method to predict glioma prognosis, as our findings are similar to those of Law et al. 23 and Caseiras et al. 27 despite the fact that we used commercially available perfusion post-processing software (instead of a program developed in-house), data from a different MR scanner manufacturer, a different methodology to calculate rCBVmax, and we evaluated a smaller cohort of patients.
An important limitation of this study is its retrospective nature. Given this limitation and the small size of our sample, we do not suggest that the cut-off values of rCBVmax measurements estimated in this study be used to make therapeutic decisions. Our goal was to evaluate the potential usefulness of non-invasive MR techniques in predicting glioma prognosis. Only larger prospective studies will clarify the role of rCBV measurement as an imaging biomarker of glioma malignancy that may guide therapeutic decisions. Since rCBVmax cut-off values correlating with survival and prognosis would be of paramount practical importance, we believe that prospective investigations of larger series, using standardized data collection and post-processing techniques are warranted. Another important limitation of our study is that intra- and interobserver reproducibility were not tested.
Conclusion
Our results suggest that rCBVmax measurements obtained at the time of diagnosis can be used to predict PFS at two years in patients with brain gliomas. rCBVmax measurements strongly correlate with WHO grading, but might serve as an independent indicator to predict prognosis. Although the strongest correlation between two-year PFS and rCBVmax measurements was found in the pure astrocytomas group, there was a significant correlation between two-year PFS and rCBVmax measurements also for the entire glioma group, including oligodendroglial tumors.
References
- 1.Mineo JF, Bordron A, Baroncini M, et al. Low HER2-expressing glioblastomas are more often secondary to anaplastic transformation of low-grade glioma. J Neurooncol. 2007;85(3):281–287. doi: 10.1007/s11060-007-9424-1. [DOI] [PubMed] [Google Scholar]
- 2.Devaux BC, O’Fallon JR, Kelly PJ. Resection, biopsy, and survival in malignant glial neoplasms. A retrospective study of clinical parameters, therapy, and outcome. J Neurosurg. 1993;78(5):767–775. doi: 10.3171/jns.1993.78.5.0767. [DOI] [PubMed] [Google Scholar]
- 3.Stark AM, Nabavi A, Mehdorn HM, et al. Glioblastoma multiforme-report of 267 cases treated at a single institution. Surg Neurol. 2005;63(2):162–169. doi: 10.1016/j.surneu.2004.01.028. discussion 169. [DOI] [PubMed] [Google Scholar]
- 4.Maia AC, Jr, Malheiros SM, da Rocha AJ, et al. MR cerebral blood volume maps correlated with vascular endothelial growth factor expression and tumor grade in nonenhancing gliomas. Am J Neuroradiol. 2005;26(4):777–783. [PMC free article] [PubMed] [Google Scholar]
- 5.Basu S, Alavi A. Molecular imaging (PET) of brain tumors. Neuroimaging Clin N Am. 2009;19(4):625–646. doi: 10.1016/j.nic.2009.08.012. [DOI] [PubMed] [Google Scholar]
- 6.Kong DS, Song SY, Kim DH, et al. Prognostic significance of c-Met expression in glioblastomas. Cancer. 2009;115(1):140–148. doi: 10.1002/cncr.23972. [DOI] [PubMed] [Google Scholar]
- 7.Price SJ. Advances in imaging low-grade gliomas. Adv Tech Stand Neurosurg. 2010;35:1–34. doi: 10.1007/978-3-211-99481-8_1. [DOI] [PubMed] [Google Scholar]
- 8.Okamoto Y, Di Patre PL, Burkhard C, et al. Population-based study on incidence, survival rates, and genetic alterations of low-grade diffuse astrocytomas and oligodendrogliomas. Acta Neuropathol. 2004;108(1):49–56. doi: 10.1007/s00401-004-0861-z. [DOI] [PubMed] [Google Scholar]
- 9.Piepmeier J, Christopher S, Spencer D, et al. Variations in the natural history and survival of patients with supratentorial low-grade astrocytomas. Neurosurgery. 1996;38:872–878. doi: 10.1097/00006123-199605000-00002. discussion 878-879. [DOI] [PubMed] [Google Scholar]
- 10.Arvinda HR, Kesavadas C, Sarma PS, et al. Glioma grading: sensitivity, specificity, positive and negative predictive values of diffusion and perfusion imaging. J Neurooncol. 2009;94:87–96. doi: 10.1007/s11060-009-9807-6. [DOI] [PubMed] [Google Scholar]
- 11.Jackson RJ, Fuller GN, Abi-Said D, et al. Limitations of stereotactic biopsy in the initial management of gliomas. Neuro Oncol. 2003;3(3):193–200. doi: 10.1093/neuonc/3.3.193. [DOI] [PMC free article] [PubMed] [Google Scholar]
- 12.Sugahara T, Korogi Y, Kochi M, et al. Correlation of MR imaging-determined cerebral blood volume maps with histologic and angiographic determination of vascularity of gliomas. Am J Roentgenol. 1998;171(6):1479–1486. doi: 10.2214/ajr.171.6.9843274. [DOI] [PubMed] [Google Scholar]
- 13.Rosen BR, Belliveau JW, Vevea JM, et al. Perfusion imaging with NMR contrast agents. Magn Reson Med. 1990;14(2):249–265. doi: 10.1002/mrm.1910140211. [DOI] [PubMed] [Google Scholar]
- 14.Law M, Oh S, Babb JS, et al. Low-grade gliomas: dynamic susceptibility-weighted contrast-enhanced perfusion MR imaging--prediction of patient clinical response. Radiology. 2006;238:658–667. doi: 10.1148/radiol.2382042180. [DOI] [PubMed] [Google Scholar]
- 15.Danchaivijitr N, Waldman AD, Tozer DJ, et al. Low-grade gliomas: do changes in rCBV measurements at longitudinal perfusion-weighted MR imaging predict malignant transformation? . Radiology. 2008;247(1):170–178. doi: 10.1148/radiol.2471062089. [DOI] [PubMed] [Google Scholar]
- 16.Chaskis C, Stadnik T, Michotte A, et al. Prognostic value of perfusion-weighted imaging in brain glioma: a prospective study. Acta Neurochir (Wien) 2006;148(3):277–285. doi: 10.1007/s00701-005-0718-9. discussion 285. [DOI] [PubMed] [Google Scholar]
- 17.Daumas-Duport C, Scheithauer B, O’Fallon J, et al. Grading of astrocytomas. A simple and reproducible method. Cancer. 1988;62(10):2152–2165. doi: 10.1002/1097-0142(19881115)62:10<2152::aid-cncr2820621015>3.0.co;2-t. [DOI] [PubMed] [Google Scholar]
- 18.Bisdas S, Kirkpatrick M, Giglio P, et al. Cerebral blood volume measurements by perfusion-weighted MR imaging in gliomas: ready for prime time in predicting short-term outcome and recurrent disease? . Am J Neuroradiol. 2009;30(4):681–688. doi: 10.3174/ajnr.A1465. [DOI] [PMC free article] [PubMed] [Google Scholar]
- 19.Hirai T, Murakami R, Nakamura H, et al. Prognostic value of perfusion MR imaging of high-grade astrocytomas: long-term follow-up study. Am J Neuroradiol. 2008;29:1505–1510. doi: 10.3174/ajnr.A1121. [DOI] [PMC free article] [PubMed] [Google Scholar]
- 20.Law M, Young RJ, Babb JS, et al. Gliomas: predicting time to progression or survival with cerebral blood volume measurements at dynamic susceptibility-weighted contrast-enhanced perfusion MR imaging. Radiology. 2008;247(2):490–498. doi: 10.1148/radiol.2472070898. [DOI] [PMC free article] [PubMed] [Google Scholar]
- 21.Lev MH, Ozsunar Y, Henson JW, et al. Glial tumor grading and outcome prediction using dynamic spin-echo MR susceptibility mapping compared with conventional contrast-enhanced MR: confounding effect of elevated rCBV of oligodendrogliomas [corrected] Am J Neuroradiol. 2004;25:214–221. [PMC free article] [PubMed] [Google Scholar]
- 22.Mills SJ, Patankar TA, Haroon HA, et al. Do cerebral blood volume and contrast transfer coefficient predict prognosis in human glioma? . Am J Neuroradiol. 2006;27(4):853–858. [PMC free article] [PubMed] [Google Scholar]
- 23.Caseiras GB, Chheang S, Babb J, et al. Relative cerebral blood volume measurements of low-grade gliomas predict patient outcome in a multi-institution setting. Eur J Radiol. 2012;73(2):215–220. doi: 10.1016/j.ejrad.2008.11.005. [DOI] [PubMed] [Google Scholar]
- 24.Louis DN, Ohgaki H, Wiestler OD, et al. The 2007 WHO classification of tumours of the central nervous system. Acta Neuropathol. 2007;114(2):97–109. doi: 10.1007/s00401-007-0243-4. [DOI] [PMC free article] [PubMed] [Google Scholar]
- 25.Brem SS, Bierman PJ, Black P, et al. Central nervous system cancers. J Natl Compr Canc Netw. 2008;6(5):456–504. doi: 10.6004/jnccn.2008.0037. [DOI] [PubMed] [Google Scholar]
- 26.Stupp R, Mason WP, van den Bent MJ, et al. Radiotherapy plus concomitant and adjuvant temozolomide for glioblastoma. N Engl J Med. 2005;352(10):987–996. doi: 10.1056/NEJMoa043330. [DOI] [PubMed] [Google Scholar]
- 27.Wen PY, Macdonald DR, Reardon DA, et al. Updated response assessment criteria for high-grade gliomas: response assessment in neuro-oncology working group. J Clin Oncol. 2010;28(11):1963–1972. doi: 10.1200/JCO.2009.26.3541. [DOI] [PubMed] [Google Scholar]
- 28.Wetzel SG, Cha S, Johnson G, et al. Relative cerebral blood volume measurements in intracranial mass lesions: interobserver and intraobserver reproducibility study. Radiology. 2002;224(3):797–803. doi: 10.1148/radiol.2243011014. [DOI] [PubMed] [Google Scholar]
- 29.Pignatti F, van den Bent M, Curran D, et al. Prognostic factors for survival in adult patients with cerebral low-grade glioma. J Clin Oncol. 2002;20(8):2076–2084. doi: 10.1200/JCO.2002.08.121. [DOI] [PubMed] [Google Scholar]
- 30.Law M, Yang S, Wang H, et al. Glioma grading: sensitivity, specificity, and predictive values of perfusion MR imaging and proton MR spectroscopic imaging compared with conventional MR imaging. Am J Neuroradiol. 2003;24(10):1989–1998. [PMC free article] [PubMed] [Google Scholar]
- 31.Krex D, Klink B, Hartmann C, et al. Long-term survival with glioblastoma multiforme. Brain. 2007;130(Pt 10):2596–2606. doi: 10.1093/brain/awm204. [DOI] [PubMed] [Google Scholar]
- 32.Whitmore RG, Krejza J, Kapoor GS, et al. Prediction of oligodendroglial tumor subtype and grade using perfusion weighted magnetic resonance imaging. J Neurosurg. 2007;107(3):600–609. doi: 10.3171/JNS-07/09/0600. [DOI] [PubMed] [Google Scholar]
- 33.Jenkinson MD, Smith TS, Joyce KA, et al. Cerebral blood volume, genotype and chemosensitivity in oligodendroglial tumours. Neuroradiology. 2006;48(10):703–713. doi: 10.1007/s00234-006-0122-z. [DOI] [PMC free article] [PubMed] [Google Scholar]


