Abstract
This study investigated the effect of 10 or 100 mg/kg/day quercetin on the uterus of ovariectomized adult female rats receiving sex-steroid replacement regime mimicking changes in hormonal profiles during the reproductive cycle. Following seven days of treatment with estrogen and progesterone with or without quercetin, uteri were harvested for histological and proliferative cell nuclear antigen (PCNA) protein and mRNA expression and PCNA protein distribution analyses. Our findings indicated that co-administration of 10 mg/kg/day quercetin with estrogen and progesterone caused a significant decrease in the size of uterine lumen and epithelial heights with lower PCNA protein and mRNA expression as compared to estrogen plus progesterone-only treatment (P < 0.05). Concomitant treatment with estrogen and progesterone with 100 mg/kg/day quercetin resulted in a marked increase in the number of glands with increased PCNA protein and mRNA expression. Significantly higher PCNA distribution was observed in the stroma and glands as compared to estrogen plus progesterone-only treatment (P < 0.05). In conclusion, at 10 mg/kg/day, quercetin affects uterine morphology but not proliferation, however at 100 mg/kg/day, quercetin induced significant stromal and glandular proliferation which could predispose the uterus towards neoplastic development.
Keywords: Quercetin, uterus, PCNA, proliferation
Introduction
Quercetin, a flavanoid present in food sources such as apples, berries and onions and in beverages such as tea and red wine has been reported to possess many health effects on multiple organ systems [1]. Quercetin is known to exert a strong antioxidant [2], anti-inflammatory [3], anti-carcinogenic [4], anti-viral [5], cardioprotective [6] as well as estrogenic [7] and anti-estrogenic [8] effects. This plant-derived compound was able to bind at high affinity to type-II estrogen binding site, resulting in inhibition of estrogen-regulated cell growth and proliferation [9]. At high dose, quercetin has also been reported to bind to type I estrogen receptor, which trigger various tissue estrogenic effects [10]. In view of this, quercetin has been classified as phytoestrogen [11].
Uterus is a highly dynamic organ which morphology changes throughout phases of the reproductive cycle [12]. In the first half of the cycle, under estrogen influence, extensive tissue growth and proliferation occur while in the second half of the cycle, under progesterone influence, active glandular secretion with stromal decidualization prepare the uterus for embryo implantation [13]. Following ovulation, uterus acquires a receptive state [14]. Introduction of estrogen or progesterone-like compounds either synthetic or plant-derived may induce morphological changes during both phases of the cycle therefore could affect normal uterine growth, development and function [15]. These changes may result in failure of the embryo to implant, predisposing female to infertility. Some exogenous plant-related compounds may also induce hyperplastic changes which could trigger neoplastic development [16].
We hypothesized that quercetin affect morphology and proliferation of the uterus. This argument was supported by a recent evidence which indicated that the outer scale of onion, known to contain a high amount of quercetin and diadzein, induced morphological changes in the uterus in mice [17]. However, the active compounds responsible for mediating these effects were not identified. Our study therefore aimed to investigate quercetin effect on uterine morphology and proliferation to confirm the involvement of this compound in mediating changes in the uterus during the normal reproductive cycle. While low amount of quercetin can be obtained from food source, high amount of this compound can be obtained through the consumption of quercetin-rich dietary supplement.
Materials and methods
Animals preparation
Three month-old adult female Sprague-Dawley (SD) rats, weighted 225 ± 10 g were housed in a clean and well ventilated animal room with a standardized conditions (lights on 12 hr from 06:00 hours to 18:00 hours: room temperature 24 ± 2°C; with 5-6 animals per cage). Animals had a free access to soy-free diet (Harlan Diet, UK) and tap water ad libitum. All procedures were approved by the Faculty of Medicine, Animal Care and Use Committee (ACUC), University of Malaya with ethics number: FIS/01/12/2008 (NFK). Quercetin, estrogen, progesterone and peanut oil were purchased from Sigma Aldrich Co. (St. Louis, MS, USA). Bilateral ovariectomy was performed under isoflurane anesthesia. After surgery, animals were given intramuscular injection of 0.1 ml Kombitrim antibiotic to prevent post-surgical wound infection. Animals were divided into four (4) groups and were treated with sex-steroid replacement regime according to the protocol as described by Kennedy et al. [18] and Salleh et al. [19]:
Group 1: 7 days treatment with peanut oil (vehicle).
Group 2: 3 days treatment with estrogen at 0.2 µg/ml, a day without treatment followed by 3 days treatment with 4 mg/rat/day progesterone to mimic hormonal changes during reproductive cycle [18,19].
Group 3 and 4: Similar treatment as in group 2 however with addition of quercetin at 10 [20,21] or 100 [22] mg/kg body weight/day daily for seven days period.
All drugs were injected at least fourteen days after ovariectomy to eliminate the effect of endogenous sex-steroids [23]. Quercetin was dissolved in 0.1 ml DMSO which were serially diluted to achieve the desired final concentrations prior to mixing with peanut oil. A day after the last day of treatment, rats were humanely sacrificed and uterus was removed for histology and protein and mRNA expression analyses. No differences were observed in these parameters between DMSO and peanut oil only treatments.
Uterine histology preparation
Uterine horns were immediately removed and fixed in 4% paraformaldehyde (PFD) at 4°C for 4 to 5 hours. Tissues were then processed through different grades of ethanol, incubated overnight in chloroform, transferred into paraffin wax for 3 hours, placed into the molds prefilled with melted wax and cooled immediately at -60°C to harden the wax. Tissues were then cut into 5 µm sections and mounted onto glass slide. The slides were then stained with hematoxylin and eosin (H & E), visualized under a light microscope under magnifications of 4, 20 and 40 times. Inner luminal and outer uterine circumferences and heights (H) of luminal epithelia were measured by using NIS-Elements AR program. Epithelial heights were measured from the basolateral to the apical membranes. All images were captured using Nikon Eclipse 80i that was attached to a light microscope (Olympus, Japan).
PCNA protein expression analysis by Western blotting
Whole uterine tissues were snapped frozen in liquid nitrogen and were then stored at -80°C prior to protein extraction. Following total extraction with PRO-PREP solution (Intron, Korea), equal amount of protein from each tissue lysate were mixed with a loading dye, boiled for 5 min and separated with SDS-PAGE 12%. Protein was then transferred onto a PVDF membrane (BIORAD, USA) and blocked with 5% BSA for 90 min at room temperature. The membrane was exposed for 90 min to goat polyclonal PCNA primary antibody (Santa Cruz: sc-9857), at a dilution of 1:200 in PBS containing 1% BSA and Tween-20 overnight. The blots were then rinsed three times in PBS-T, 5 minutes each. The membranes were then incubated with anti-goat, anti-mouse and anti-rabbit horseradish peroxidase (HRP) conjugated secondary antibody (Santa Cruz, CA, USA) at a dilution of 1:500, for 1 hr. The membranes were then rinsed and subjected to Opti-4CN™ Substrate Kit (Bio-Rad, USA) to visualize the protein bands. Photos of the blots were captured by a gel documentation system and density of each band was determined by using Image J software NIH Image J (version 1.46j; National Institutes of Health, Bethesda, MD, USA). The ratio of each target band/β-actin was calculated and was considered as expression levels of the target proteins.
PCNA mRNA quantification by real time PCR (qPCR)
Whole uterine tissues were kept in RNALater (Ambion, USA) solution prior to RNA extraction. Total RNA was freshly isolated from rat uteri by using RNeasy Plus Mini Kit (Qiagen, USA). Purity and concentration of RNA was assessed by using 260/280 UV absorption ratios (Gene Quant 1300, UK). Two steps Real Time PCR was used to evaluate gene expression with application of TaqMan® RNA-to-CT 1-Step Kit (Ambion, Austin, TX, USA) [24]. Reverse transcription into cDNA was performed by using High Capacity RNA-to-cDNA Kit (Applied Biosystems, USA). Controls include amplifications performed on samples identically prepared however with no reverse transcriptase (-RT) and amplifications performed with no added substrate.
In real-time PCR, amplified region of cDNA was probed with fluorescence-labeled probe. Specificity of primer and probe ensures that expression of target DNA was specifically evaluated. Real time PCR does not require time consuming post amplification gel electrophoresis due to high sensitivity [24]. TaqMan probe has a sensitivity of 100% and specificity of 96.67% and was capable of detecting as few as 50 copies of RNA/ml and as low as 5-10 molecules. The assay used (TaqMan®-Rn01514538-g1) amplifies 94 bp segment of PCNA. Target assay was validated in-silico using whole rat genome sequences and in-vitro using whole rat cDNA sequences which ensures target sequences were detected (Applied Biosystems, USA). GAPDH (assay number: Rn99999916-s1) was used as a reference or house-keeping gene for endometrial tissue as its expression was the most stable during oestrus cycle [25].
PCR program includes 2 minutes at 50°C for UNG activity, 20 seconds 95°C activation of ampliTaq gold DNA polymerase, and 1 minute denaturation at 95°C, 20 second and annealing/extension at 60°C for 1 minute. Denature and annealing was performed for 40 cycles. All measurements were normalized using GenEx software (MultiD, Sweden) followed by Data Assist v3 software from Applied Biosystems (USA) which was used to evaluate RNA fold changes. All experiments were carried out in triplicates. Data was analyzed according to comparative Ct (2-ΔΔCt) method.
PCNA distribution analyses by immunohistochemistry (IHC) and immunofluorescence
Uterine tissues were fixed in 4% paraformaldehyde (PFD) overnight before processing and dehydrated through increasing concentrations of ethanol, cleared in chloroform and blocked in paraffin wax. For IHC, tissues were cut into 5 µm sections, deparaffinised in xylene, rehydrated in reducing concentration of ethanol. Tri sodium citrate (pH 6.0) was used for antigen retrieval, while 1% H2O2 in PBS was used to neutralize endogenous peroxidase. Sections were then blocked in 5% BSA for non-specific binding, prior to incubation with goat polyclonal PCNA primary antibody (Santa Cruz, USA) at a dilution of 1:200 in 5% BSA at room temperature for an hour. After four times rinsing with PBS, sections were then incubated with biotinylated secondary antibody for 30 minutes at room temperature, and were exposed to avidin and biotinylated HRP complex (Santa Cruz, US) in PBS for another half an hour. The sites of antibody binding were visualized by DAB (Diaminobenzidine HCl) (Santa Cruz, US) staining, which gave dark-brown stains. Sections were counterstained with hematoxylin for nuclear staining. In this experiment, non-immune normal donkey serum was used as a negative control with no staining detected. For immunofluorescence, sections were blocked in 10% normal rabbit serum (SC-2338) (Santa Cruz Biotechnology, Santa Cruz, CA) prior to incubation with PCNA primary antibody (Santa Cruz: sc-9857) (Santa Cruz Biotechnology, Santa Cruz, CA) at a dilution of 1:100 in PBS with 1.5% normal blocking serum at room temperature for an hour. After three times rinsing with PBS, sections were incubated with rabbit anti-goat IgG-fluorochrome-conjugated secondary antibody (sc-2777) (Santa Cruz Biotechnology, Santa Cruz, CA) at a dilution of 1:250 in PBS with 1.5% normal blocking serum at room temperature for 45 minutes. The slides were rinsed three times with PBS and were mounted with Ultracruz Mounting Medium (Santa Cruz Biotechnology, Santa Cruz, CA) and counterstain to visualize the nuclei. All images were viewed by using a Nikon Eclipse 80i camera which was attached to a light microscope.
Fluorescence intensity measurement
Immunofluorescence images were captured under standard condition of illumination with the voltage chosen and photographs taken at a fixed exposure time. Tiff images (1280 × 1024 pixels) were taken at objective lens magnification of 40 × and 100 ×. By using NIS-Element AR program (Nikon Instruments Inc, Melville, NY, USA), exposure time and sensitivity were set prior to image capturing. At the outset of the session, part of the slide with no tissue (blank field) was viewed under the microscope and auto white balance was performed. Area of interest on the image was selected under hue-saturation-intensity (HSI) mode and the total counts (fluorescence spots) were obtained. Mean intensity of the counts (which could be restricted) was determined which represents average amount of protein expressed in the tissue.
Statistical analysis
Statistical differences were evaluated by analysis of variance (ANOVA). A probability level of less than 0.05 (P < 0.05) was considered as significant. Post-hoc statistical power analysis was performed and all values obtained were > 0.8 which indicate adequate sample size. Meanwhile, Shapiro-Wilk test was performed to test for data normality with P values > 0.05 which indicate normal distribution. For mRNA analyses, the number of samples used was six (6) samples while for immunofluorescence, four (4) samples were used per treatment group.
Results
Uterine morphological changes
Figure 1 shows appearance of uterine cross sections at low magnification in vehicle-treated, estrogen plus progesterone and estrogen plus progesterone with addition of 10 mg/kg/day or 100 mg/kg/day quercetin daily for seven consecutive days. Meanwhile, Table 1 shows the ratio of inner/outer uterine circumference in different treatment groups. Our findings indicate that a slight but significant decrease in the ratio was observed following 10 mg/kg/day quercetin treatment however no significant changes in the ratio was observed following administration of 100 mg/kg/day quercetin as compared to estrogen plus progesterone-only treatment. Table 2 shows the height of luminal and glandular epithelia which were significantly reduced following 10 mg/kg/day quercetin administration. A remarkable increase in glands number was noted following treatment with 100 mg/kg/day quercetin (Figure 1; Table 2).
Figure 1.
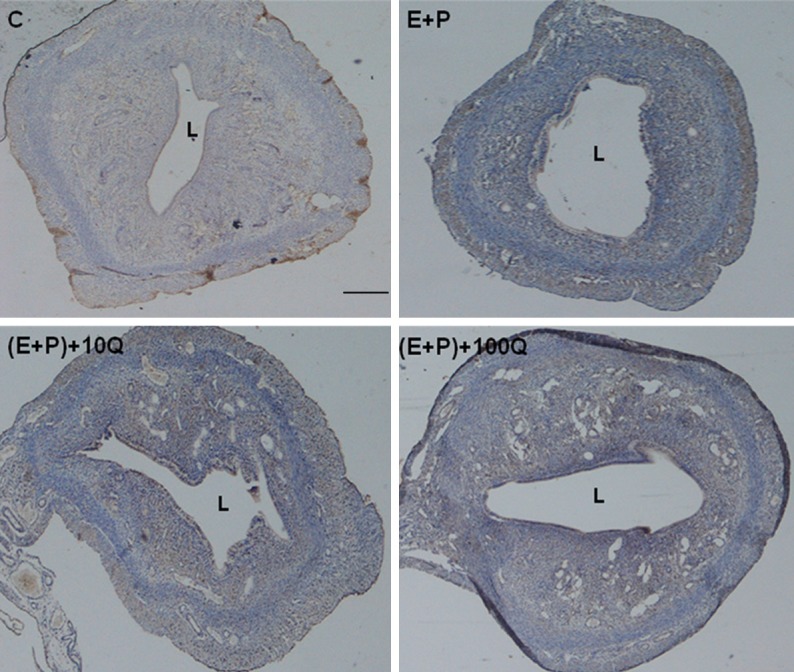
Low magnification image of the uterus in different treatment groups. A lumen in (E+P)+10Q is relatively smaller than E+P and (E+P)+100Q group. A significantly high number of glands could be seen in the (E+P)+100Q group. E+P = estrogen plus progesterone, (E+P)+10Q = estrogen plus progesterone with 10 mg/kg/day quercetin, (E+P)+100Q = estrogen plus progesterone with 100 mg/kg/day quercetin. L, lumen. scale bar = 100 µm
Table 1.
Ratio of uterine inner/outer circumference between various treatment groups
| Groups | Inner/Outer uterine circumference ratio |
|---|---|
| C | 0.36 ± 0.09 |
| E+P | 0.511391 ± 0.16 |
| (E+P)+10Q | 0.441 ± 0.18* |
| (E+P)+100Q | 0.513532 ± 0.1 |
A significant decrease in ratio was noted following treatment with 10 mg/kg/day quercetin but not 100 mg/kg/day quercetin.
P < 0.05 as compared to E+P group.
Table 2.
Luminal and glandular epithelial heights between various treatment groups
| Groups | Number of glands | Luminal Epithelial Height (mm) | Glandular Epithelial Height (mm) |
|---|---|---|---|
| C | 4 ± 1 | 8.55 ± 1.78 | 7.15 ± 2.11 |
| E+P | 13 ± 2 | 32.90 ± 3.28 | 13.35 ± 2.06 |
| (E+P)+10Q | 16 ± 4 | 15.81 ± 2.66* | 9.01 ± 2.38* |
| (E+P)+100Q | 24 ± 5* | 25.43 ± 5.40 | 11.46 ± 3.65 |
The heights were significantly reduced following 10 mg/kg/day quercetin treatment.
P < 0.05 as compared to E+P group.
Uterine PCNA mRNA expression
Figure 2 shows PCNA mRNA fold changes in uterine tissue homogenates in various treatment groups. Our findings indicate that administration of 100 mg/kg/day quercetin resulted in an approximately four fold increase in PCNA mRNA expression as compared to estrogen plus progesterone-only treatment. However, PCNA mRNA expression was significantly reduced in the group which received estrogen plus progesterone with 10 mg/kg/day quercetin as compared to estrogen plus progesterone-only treatment (P < 0.05).
Figure 2.
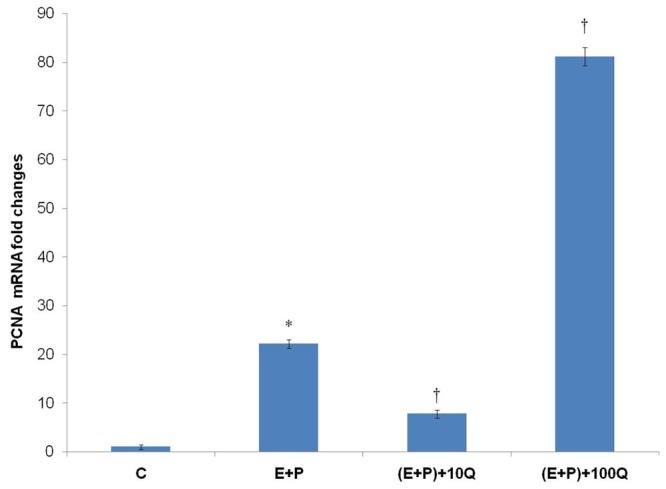
PCNA mRNA fold changes in different treatment group. A marked increase in PCNA mRNA expression was observed following concomitant treatment of estrogen plus progesterone with 100 mg/kg/day quercetin. Meanwhile, significant decrease in PCNA mRNA expression was also noted following co-administration of 10 mg/kg/day quercetin with estrogen plus progesterone. C = vehicle, E+P = estrogen plus progesterone, (E+P)+10Q = estrogen plus progesterone with 10 mg/kg/day quercetin, (E+P)+100Q = estrogen plus progesterone with 100 mg/kg/day quercetin. *P < 0.05 as compared to C. †P < 0.05 as compared to E+P.
Uterine PCNA protein expression
Figure 3 shows Western Blot images and ratio of PCNA/β-actin proteins in uterine tissue homogenates of rats receiving different treatment. Our findings indicate that PCNA protein was expressed the highest in the group which received estrogen plus progesterone and 100 mg/kg/day quercetin, consistent with the mRNA findings. However, in the group receiving 10 mg/kg/day quercetin, PCNA protein expression was significantly lower as compared to estrogen plus progesterone-only treatment (P < 0.05).
Figure 3.
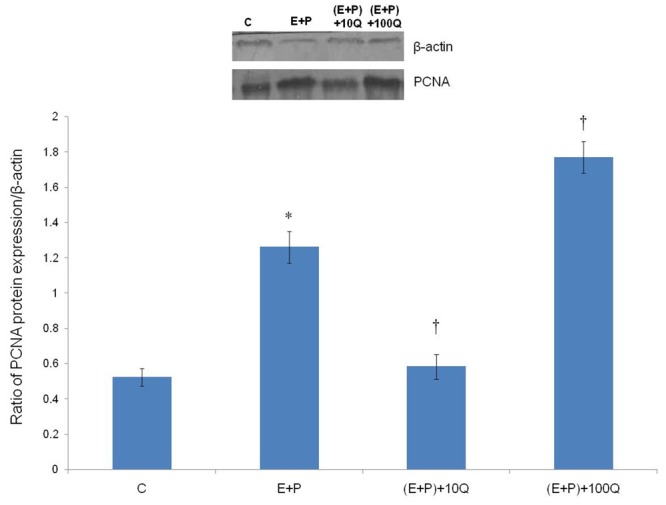
PCNA protein expression in different treatment groups. A significant increase in PCNA protein expression was noted following concomitant treatment of estrogen and progesterone with 100 mg/kg/day quercetin. Meanwhile, significantly lower expression of PCNA protein was noted following co-administration of 10 mg/kg/day quercetin with estrogen plus progesterone. C = vehicle, E+P = estrogen plus progesterone, (E+P) +10Q = estrogen plus progesterone with 10 mg/kg/day quercetin, (E+P)+100Q = estrogen plus progesterone with 100 mg/kg/day quercetin. *P < 0.05 as compared to C. †P < 0.05 as compared to E+P.
Uterine PCNA protein distribution
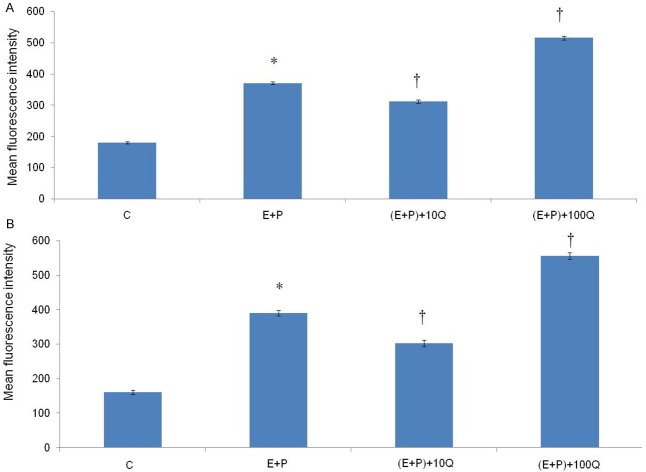
Figures 4 and 5 show the representative fluorescence microscopic images of the uterine glands and stroma respectively in different treatment groups. Fluorescence signals could be seen in the group which received estrogen plus progesterone and estrogen plus progesterone in the presence of 100 mg/kg/day quercetin. In estrogen plus progesterone treatment, the signals arise mainly from the glands, whereas in the presence of 100 mg/kg/day quercetin, widely distributed high intensity signals could be seen arising from the glands and stroma. Figure 6A and 6B show the mean fluorescence intensity in different treatment groups which was the highest in the glands and stroma following treatment with estrogen plus progesterone in the presence of 100 mg/kg/day quercetin. Administration of 10 mg/kg/day quercetin however resulted in a significantly lower fluorescence intensity as compared to estrogen plus progesterone-only treatment (P < 0.05).
Figure 4.
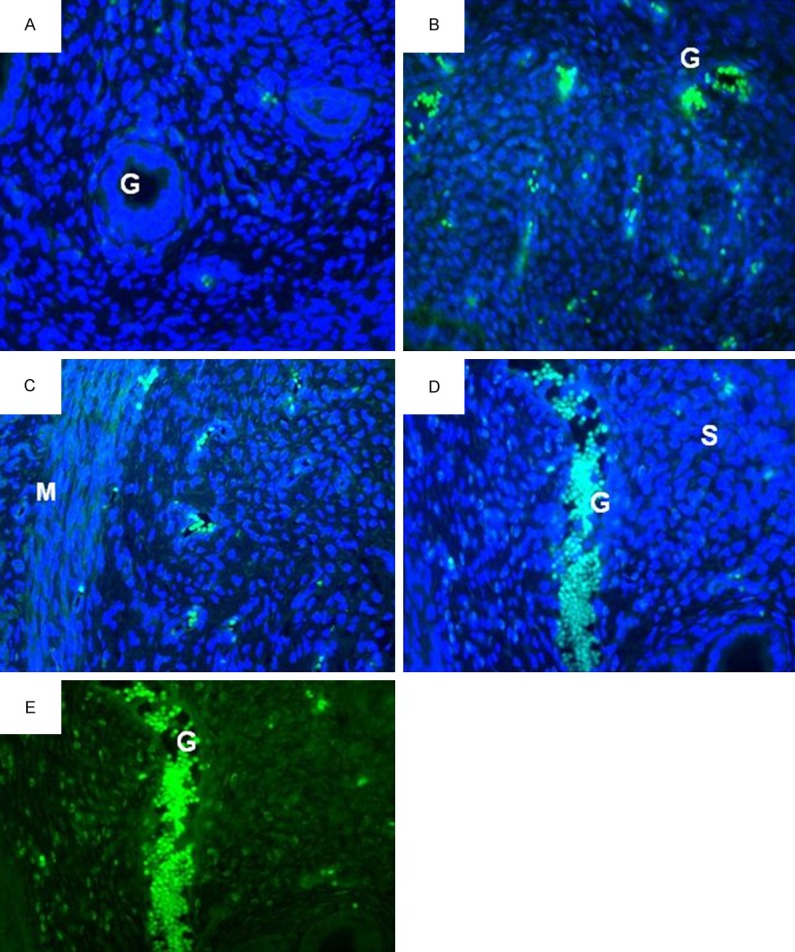
PCNA distribution in the glands of different treatment groups. A-D: FTIC with DAPI staining and E: FTIC staining alone for PCNA. Fluorescence signal could be seen arising from the glands. The highest intensity could be seen arising from (E+P)+100Q group (D & E images). L, lumen; G, glands; S, stroma; M, myometrium. A = control, B = estrogen plus progesterone, C = estrogen plus progesterone with 10 mg/kg/day quercetin, D & E = estrogen plus progesterone with 100 mg/kg/day quercetin.
Figure 5.
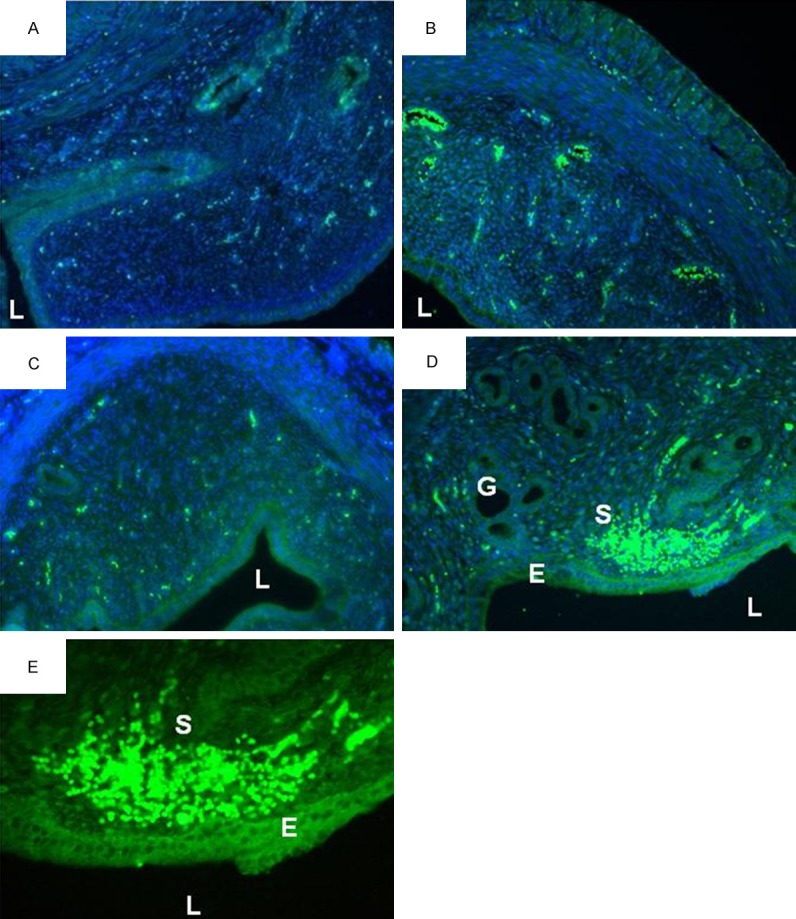
PCNA distribution in the stroma in different treatment groups. (A-D) FTIC with DAPI staining and (E) FTIC staining alone for PCNA. Fluorescence signal could be seen arising from the stroma. The highest intensity could be seen arising from (E+P)+100Q group (D & E images). L, lumen; G, glands; S, stroma; E, epithelium. A = control, B = estrogen plus progesterone, C = estrogen plus progesterone with 10 mg/kg/day quercetin, D & E = estrogen plus progesterone with 100 mg/kg/day quercetin.
Figure 6.
Mean fluorescence intensity in different treatment group. The highest fluorescence intensity in both (A) glands and (B) stroma could be seen in the group which received estrogen plus progesterone in the presence of 100 mg/kg/day quercetin. The intensity in the group receiving 10 mg/kg/day quercetin was significantly lesser than estrogen plus progesterone-only treatment group. C = vehicle, E+P = estrogen plus progesterone, (E+P)+10Q = estrogen plus progesterone with 10 mg/kg/day quercetin, (E+P)+100Q = estrogen plus progesterone with 100 mg/kg/day quercetin. *P < 0.05 as compared to C. †P < 0.05 as compared to E+P.
Figure 7 shows immunoperoxidase staining in different treatment group. High number of PCNA -stained nuclei could be seen in estrogen plus progesterone with and without 100 mg/kg/day quercetin, with the latter relatively higher than the former. However low number of PCNA-stained nuclei was seen in estrogen plus progesterone in the presence of 10 mg/kg/day quercetin.
Figure 7.
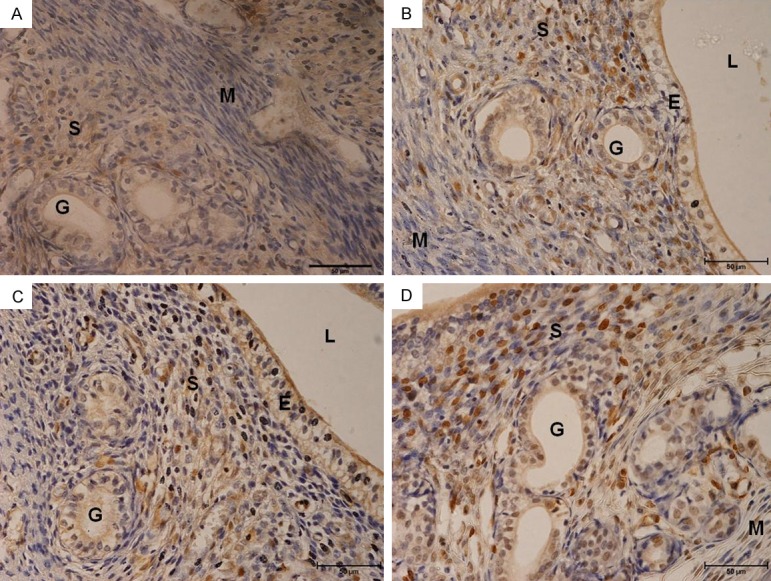
PCNA immunoperoxidase-stained cell nuclei. High number nuclei staining could be seen in the group which received estrogen plus progesterone-only treatment and estrogen plus progesterone in the presence of 100 mg/kg/day quercetin, with the latter has a relatively higher number of peroxidase reaction in the nuclei than the former. Stainings were mostly seen in the stroma. In E+P plus 100 mg/kg/day group, stainings were also seen in the glands. A = control, B = estrogen plus progesterone, C = estrogen plus progesterone with 10 mg/kg/day quercetin, D & E = estrogen plus progesterone with 100 mg/kg/day quercetin.
Discussion
To the best of our knowledge, this study reported for the first time the differential effects of quercetin at 10 and 100 mg/kg/day on uterine morphology and proliferation in ovariectomised rats receiving steroid replacement to mimic the hormonal changes during the reproductive cycle. Administration of 10 mg/kg/day quercetin has induced morphological changes in the stroma and epithelia that line the lumen and glands. At this dose however, no significant proliferative changes was noted in the uterus as compared to estrogen plus progesterone-only treatment. Administration of 100 mg/kg/day quercetin did not cause a marked change in the size of the uterine lumen with the heights of luminal and glandular epithelia remains insignificantly different from estrogen plus progesterone-only treatment. The number of glands however was markedly increased suggestive of glandular hyperplasic changes.
Evidence of hyperplasia was confirmed by immunofluorescence which revealed extensive proliferation in both glands and stromal which was reflected by high intensity PCNA signals. Similarly, immunoperoxidase staining also supports active stromal and glandular proliferation in the group which received 100 mg/kg/day quercetin treatment. Quercetin at 100 mg/kg/day induced an approximately four fold increase in PCNA mRNA and two folds increase in PCNA protein expression in the uterus which confirmed active proliferation. A markedly high amount of cellular proliferation could trigger uterine neoplastic changes. In view of this, further investigation is needed to investigate expression of neoplastic markers under high dose quercetin effect. In addition to quercetin, several other plant compounds including high dose (100 mg/kg/day) genistein was also found to induce proliferation of uterus [15] that could trigger neoplasic changes [16]. Therefore, it is possible that quercetin may also trigger neoplasia as both compounds shared similar phytoestrogenic properties.
A significantly low PCNA expression following administration of 10 mg/kg/day quercetin indicated that quercetin antagonized estrogen effect on the uterus. The morphometric analyses indicated that the average heights of luminal and glandular epithelia were significantly lower in this group as compared to estrogen plus progesterone-only treatment which suggest epithelial growth retardation. Meanwhile, the amount of fluid accumulated within the uterine lumen which was reflected by changes in the ratio of inner/outer uterine circumference [26] was markedly reduced suggestive of decreased endometrial secretory function. No significant changes in these parameters were noted in the group which received 100 mg/kg/day quercetin. These findings indicated that the anti-estrogenic of high dose quercetin was lesser than at lower doses. Estrogen is known to induce fluid accumulation while progesterone induces fluid loss from the uterine lumen [26] in which disturbances to this precise regulation could affect multiple reproductive processes that may have significant impact on fertility.
The reduced proliferation under 10 mg/kg/day quercetin may interfere with epithelial and stromal growth and secretions of growth factors such as heparin-binding growth factor (HB-EGF) by the stromal cells [27]. Adequate stromal growth is essential for decidualization in preparation for implantation [28]. The reduced stromal cells growth could affect their response towards sex-steroids [29]. Adequate growth is also essential for achieving receptive state required for implantation [14]. Retarded endometrial growth may produce effect which resemble luteal phase defect, a pathological condition associated with failure of embryo to implant [30]. Despite of the effect that resemble estrogen and anti-estrogen, quercetin was found to possess neither progesterone nor anti-progesterone-like effect. In view of this, it is highly unlikely that this compound might interfere with progesterone-induced uterine changes.
In conclusion, this study has displayed dual effect of quercetin on the uterus. At 10 mg/kg/day, quercetin displays predominantly anti-estrogenic effect which could be due to the binding to type-2 estrogen receptor. A significant inhibition on estrogen-induced changes by this quercetin dose is potentially useful as quercetin could be considered as oral contraceptive agent. At high dose (100 mg/kg/day) intake such as that occur with quercetin-rich dietary supplement, the exaggerated estrogenic activities rendered this compound a potential hazard that could trigger neoplastic development.
Acknowledgements
Authors would like to thank PPP grant, University of Malaya for supporting this study.
Disclosure of conflict of interest
None.
References
- 1.Formica J, Regelson W. Review of the biology of quercetin and related bioflavonoids. Food Chem Toxicol. 1995;33:1061–1080. doi: 10.1016/0278-6915(95)00077-1. [DOI] [PubMed] [Google Scholar]
- 2.Kurzeja E, Stec M, Synowiec-Wojtarowicz A, Jowsa A, Pawłowska-Góral K. Studies on the effect of quercetin and nitrates on the redox homeostasis using in vitro model. Environ Toxicol Pharmacol. 2014;38:24–30. doi: 10.1016/j.etap.2014.04.024. [DOI] [PubMed] [Google Scholar]
- 3.García-Lafuente A, Guillamón E, Villares A, Rostagno MA, Martínez JA. Flavonoids as anti-inflammatory agents: implications in cancer and cardiovascular disease. Inflamm Res. 2009;58:537–552. doi: 10.1007/s00011-009-0037-3. [DOI] [PubMed] [Google Scholar]
- 4.Velázquez KT, Enos RT, Narsale AA, Puppa MJ, Davis JM, Murphy EA, Carson JA. Quercetin Supplementation Attenuates the Progression of Cancer Cachexia in ApcMin/+ Mice. J Nutr. 2014;144:868–875. doi: 10.3945/jn.113.188367. [DOI] [PMC free article] [PubMed] [Google Scholar]
- 5.Thapa M, Kim Y, Desper J, Chang KO, Hua DH. Synthesis and antiviral activity of substituted quercetins. Bioorga Med Chem Lett. 2012;22:353–356. doi: 10.1016/j.bmcl.2011.10.119. [DOI] [PMC free article] [PubMed] [Google Scholar]
- 6.Annapurna A, Reddy CS, Akondi RB, Rao SR. Cardioprotective actions of two bioflavonoids, quercetin and rutin, in experimental myocardial infarction in both normal and streptozotocin-induced type I diabetic rats. J Pharm Pharmacol. 2009;61:1365–1374. doi: 10.1211/jpp/61.10.0014. [DOI] [PubMed] [Google Scholar]
- 7.Resende FA, de Oliveira APS, de Camargo MS, Vilegas W, Varanda EA. Evaluation of Estrogenic Potential of Flavonoids Using a Recombinant Yeast Strain and MCF7/BUS Cell Proliferation Assay. PLoS One. 2013;8:e74881. doi: 10.1371/journal.pone.0074881. [DOI] [PMC free article] [PubMed] [Google Scholar]
- 8.Ferrandina G, Almadori G, Maggiano N, Lanza P, Ferlini C, Cattani P, Piantelli M, Scambia G, Ranelletti FO. Growth-inhibitory effect of tamoxifen and quercetin and presence of type II estrogen binding sites in human laryngeal cancer cell lines and primary laryngeal tumors. Int J Cancer. 1998;77:747–754. doi: 10.1002/(sici)1097-0215(19980831)77:5<747::aid-ijc14>3.0.co;2-z. [DOI] [PubMed] [Google Scholar]
- 9.Ranelletti FO, Ricci R, Larocca LM, Maggiano N, Capelli A, Scambia G, Benedetti-Panici P, Mancuso S, Rumi C, Piantelli M. Growth-inhibitory effect of quercetin and presence of type-II estrogen-binding sites in human colon-cancer cell lines and primary colorectal tumors. Int J Cancer. 1992;50:486–492. doi: 10.1002/ijc.2910500326. [DOI] [PubMed] [Google Scholar]
- 10.Wang TT, Sathyamoorthy N, Phang JM. Molecular effects of genistein on estrogen receptor mediated pathways. Carcinogenesis. 1996;17:271–275. doi: 10.1093/carcin/17.2.271. [DOI] [PubMed] [Google Scholar]
- 11.Muthian G, Bright JJ. Quercetin, a flavonoid phytoestrogen, ameliorates experimental allergic encephalomyelitis by blocking IL-12 signaling through JAK-STAT pathway in T lymphocyte. J Clin Immunol. 2004;24:542–552. doi: 10.1023/B:JOCI.0000040925.55682.a5. [DOI] [PubMed] [Google Scholar]
- 12.Johnson MH. Essential reproduction. John Wiley & Sons. 2012 [Google Scholar]
- 13.Fazleabas AT. Physiology and pathology of implantation in the human and nonhuman primate. Seminars in Reproductive Medicine. 2007;25:405–9. doi: 10.1055/s-2007-991037. Thieme Medical Publishers. [DOI] [PubMed] [Google Scholar]
- 14.Cavagna M, Mantese J. Biomarkers of endometrial receptivity-a review. Placenta. 2003;24:S39–S47. doi: 10.1016/s0143-4004(03)00184-x. [DOI] [PubMed] [Google Scholar]
- 15.Salleh N, Helmy MM, Fadila KN, Yeong SO. Isoflavone genistein induces fluid secretion and morphological changes in the uteri of post-pubertal rats. Int J Med Sci. 2013;10:665. doi: 10.7150/ijms.5207. [DOI] [PMC free article] [PubMed] [Google Scholar]
- 16.Newbold RR, Banks EP, Bullock B, Jefferson WN. Uterine adenocarcinoma in mice treated neonatally with genistein. Cancer Res. 2001;61:4325–4328. [PubMed] [Google Scholar]
- 17.Alrefaie ZA, Mostafa HA, El-Gayed SH, Al-Hayani AA. Estrogenicity of outer scales of onion on reproductive functions of mice. Intern J Appl Res Vet Med. 2010;8:170. [Google Scholar]
- 18.Kennedy T. Intrauterine infusion of prostaglandins and decidualization in rats with uteri differentially sensitized for the decidual cell reaction. Biol Reprod. 1986;34:327–335. doi: 10.1095/biolreprod34.2.327. [DOI] [PubMed] [Google Scholar]
- 19.Salleh N, Baines D, Naftalin R, Milligan S. The hormonal control of uterine luminal fluid secretion and absorption. J Membr Biol. 2005;206:17–28. doi: 10.1007/s00232-005-0770-7. [DOI] [PubMed] [Google Scholar]
- 20.ter Veld MG, Zawadzka E, van den Berg J, van der Saag PT, Rietjens IM, Murk AJ. Food-associated estrogenic compounds induce estrogen receptor-mediated luciferase gene expression in transgenic male mice. Chem Biol Interact. 2008;174:126–133. doi: 10.1016/j.cbi.2008.03.019. [DOI] [PubMed] [Google Scholar]
- 21.Rivera L, Morón R, Sánchez M, Zarzuelo A, Galisteo M. Quercetin ameliorates metabolic syndrome and improves the inflammatory status in obese Zucker rats. Obesity. 2008;16:2081–2087. doi: 10.1038/oby.2008.315. [DOI] [PubMed] [Google Scholar]
- 22.Daniel RS, Devi K, Augusti K, Nair CS. Mechanism of action of antiatherogenic and related effects of Ficus bengalensis Linn. flavonoids in experimental animals. Indian J Exp Biol. 2003;41:296–303. [PubMed] [Google Scholar]
- 23.Naftalin R, Thiagarajah JR, Pedley KC, Pocock VJ, Milligan SR. Progesterone stimulation of fluid absorption by the rat uterine gland. Reproduction. 2002;123:633–638. doi: 10.1530/rep.0.1230633. [DOI] [PubMed] [Google Scholar]
- 24.Hofmann-Lehmann R, Swenerton RK, Liska V, Leutenegger CM, Lutz H, McClure HM, Ruprecht RM. Sensitive and robust one-tube real-time reverse transcriptase-polymerase chain reaction to quantify SIV RNA load: comparison of one- versus two-enzyme systems. AIDS Res Hum Retroviruses. 2000;16:1247–1257. doi: 10.1089/08892220050117014. [DOI] [PubMed] [Google Scholar]
- 25.Lin P, Lan X, Chen F, Yang Y, Jin Y, Wang A. Reference gene selection for real-time quantitative pcr analysis of the mouse uterus in the peri-implantation period. PLoS One. 2013;8:e62462. doi: 10.1371/journal.pone.0062462. [DOI] [PMC free article] [PubMed] [Google Scholar]
- 26.Chinigarzadeh A, Kassim NM, Muniandy S, Salleh N. Genistein-induced fluid accumulation in ovariectomised rats’ uteri is associated with increased cystic fibrosis transmembrane regulator expression. Clinics (Sao Paulo) 2014;69:111–119. doi: 10.6061/clinics/2014(02)07. [DOI] [PMC free article] [PubMed] [Google Scholar]
- 27.Lim HJ, Dey S. HB-EGF: a unique mediator of embryo-uterine interactions during implantation. Exp Cell Res. 2009;315:619–626. doi: 10.1016/j.yexcr.2008.07.025. [DOI] [PMC free article] [PubMed] [Google Scholar]
- 28.Salleh N. Diverse roles of prostaglandins in blastocyst implantation. ScientificWorldJournal. 2014;2014:968141. doi: 10.1155/2014/968141. [DOI] [PMC free article] [PubMed] [Google Scholar]
- 29.Cooke P, Buchanan D, Young P, Setiawan T, Brody J, Korach K, Taylor J, Lubahn D, Cunha G. Stromal estrogen receptors mediate mitogenic effects of estradiol on uterine epithelium. Proc Natl Acad Sci U S A. 1997;94:6535–6540. doi: 10.1073/pnas.94.12.6535. [DOI] [PMC free article] [PubMed] [Google Scholar]
- 30.Bopp B, Shoupe D. Luteal phase defects. J Reprod Med. 1993;38:348–356. [PubMed] [Google Scholar]


