

Abstract
Neuroendocrine differentiation of tumor tissue has been recognized as an important prerequisite for new targeted therapies. To evaluate the suitability of colorectal cancer (CRC) tissue for these treatment approaches and to find a possible link to pretherapeutic conditions of other targeted strategies, we compared neuroendocrine differentiation and KRAS/NRAS/BRAF/PIK3CA/TP53 mutational status in primary and metastatic CRC. Immunohistochemical expression analysis of neuroendocrine markers chromogranin A and synaptophysin was performed on archival CRC tissue, comprising 116 primary tumors, 258 lymph node metastases and 72 distant metastases from 115 patients. All CRC samples but 30 distant metastases were subjected to mutation analysis of KRAS, NRAS, BRAF, PIK3CA, and TP53. Neuroendocrine marker expression was found significantly less frequently in lymph node metastases compared to primary tumors and distant metastases (20%, 31%, 28%, respectively, P = 0.044). KRAS mutation rates increased significantly from primary tumors to lymph node metastases and distant metastases within the neuroendocrine negative CRC group (44%, 53%, 64%, respectively, P = 0.042). Neuroendocrine differentiation was significantly less concordant than KRAS/NRAS/BRAF/PIK3CA/TP53 mutational status in primary tumor/lymph node metastases pairs (65% versus 88%-99%; P < 0.0001) and primary tumor/distant metastases pairs (64% versus 83%-100%; P = 0.027 and P < 0.0001, respectively). According to these data, therapeutic targeting of neuroendocrine tumor cells can be considered only for a subset of CRC patients and biopsies from the metastatic site should be used to guide therapy. A possible importance of lacking neuroendocrine differentiation for progression of KRAS mutant CRC should be further investigated.
Keywords: Neuroendocrine differentiation, KRAS mutations, colorectal cancer
Introduction
Targeted therapy has become a fundamental component in the treatment of advanced colorectal cancer (CRC). Currently, the most frequently used target is epidermal growth factor receptor (EGFR). EGFR-specific monoclonal antibodies as cetuximab and panitumumab competitively inhibit EGF from binding to its receptor, thus blocking activation of main signaling pathways as the RAF/MEK/ERK pathway and the PI3K/PTEN/AKT pathway [1,2]. Response to EGFR inhibitor therapy depends on KRAS wild type CRC [3] and might be negatively influenced by inactivation of the TP53 gene [4,5], loss of PTEN expression [6] and mutations in the genes BRAF, NRAS and PIK3CA [7-13].
Data from pharmacodynamic trials on small institutional series [14,15] indicate that at least a subset of colorectal cancer patients could benefit from combination of EGFR-inhibitors with everolimus, which was originally approved for the treatment of advanced neuroendocrine pancreatic tumors [16]. Even if the published trial protocols did not mention special phenotypic characteristics of the tumors, their results focus attention on neuroendocrine differentiation in CRC tissue as possible target for new oncologic treatment strategies.
Neuroendocrine differentiation in conventional CRC is reported with varying frequencies (5%-77.5%, [17,18]). To the best of our knowledge, only one study [19] considered neuroendocrine differentiation in metastatic CRC, i.e. the tissue, which should be targeted by therapy. A possible link between neuroendocrine differentiation and predictive factors for response to well-established targeted therapies, for example EGFR-inhibitor, has not been reported so far.
Therefore, we analyzed immunohistochemical neuroendocrine marker (chromogranin A, synaptophysin) expression and mutational status of KRAS, NRAS, BRAF, PIK3CA and TP53 in primary and metastatic CRC. To elucidate the reliability of testing under routine conditions, this study comprised unselected material including lymph node metastases and distant metastases from various sites. First, knowledge about incidence and changes of neuroendocrine marker expression during progression of CRC should be gained by comparing each single lymph node metastasis and each distant metastasis with its corresponding primary tumor. Second, focusing on a more practical approach for possible future therapy decisions, immunohistochemical and molecular genetic results were compared within individual patients.
Material and methods
Tissue sampling and selection
447 formalin fixed paraffin embedded (FFPE) CRC samples and 115 non-neoplastic FFPE samples from 115 patients were collected from the tissue archive at Department of Pathology, Southern Norwegian Hospital Trust, Kristiansand. Tissue and patient data were obtained and used after approval of the Regional Ethics Committee (REK) of Southern Norway in accordance with the declaration of Helsinki and the International Conference of Harmonization - Good Clinical Practice. The anonymity of the patients investigated was preserved corresponding to rules of data protection of the National Data Protection Commission (NSD) of Norway and the institutional guidelines of our hospital. All tumor samples underwent histopathologic review (BK). The material of 446 CRC (116 primary tumors, 258 out of 259 collected lymph node metastases and 72 distant metastases comprising 20 biopsies and 52 resection specimens) were considered as quantitatively and qualitatively sufficient for immunohistochemical analysis. The number of available tissue blocks varied between individual cases: There were two to nine blocks per primary tumor, one to eight blocks per distant metastasis and one block per lymph node metastasis (number of lymph node metastases: one to eight per case). For each case, one block from the primary tumor, the blocks from all lymph node metastases and all available blocks from the distant metastases, respectively, were initially selected for immunohistochemical investigation. When immunohistochemical analysis revealed heterogeneity between primary and metastatic tumor tissue, additional material was obtained from all remaining available tissue blocks of the primary tumor. Quantity and quality of 116 primary tumors, 259 lymph node metastases and 42 distant metastases (only obtained from resection specimens) were considered as sufficient for molecular genetic analysis. All available blocks obtained from the primary tumors and all available blocks obtained from the distant metastases of each case were selected for mutation analysis. For each case, one lymph node metastases sample mix containing material from all available lymph node metastases was genetically analyzed.
Immunohistochemistry
Tissue sections (3 μm thick) were mounted, deparaffinized in xylene, and rehydrated through descending concentrations of ethanol. For analysis of chromogranin A, synaptophysin and Ki-67 expression, respectively, antigen retrieval was performed using a preheated (85°C) Tris-ethylenediaminetetraacetic acid buffer (pH 9, Dako Cytomation, Glostrup, Denmark) for 20 minutes at 97°C followed by a resting time of 20 minutes. Blocking of endogenous peroxidases was accomplished by incubating sections in 3% hydrogen peroxide (Dako) for 5 minutes. The slides were incubated for 30 minutes at room temperature with the polyclonal rabbit antibody chromogranin A (clone Rb a Hu, 1:500, Dako), the monoclonal mouse antibody synaptophysin (clone 27 G12, 1:100, Novocastra, United Kingdom) and monoclonal mouse antibody Ki-67 (clone MIB-1, 1:400, Dako). Immunostaining of chromogranin A, synaptophysin and Ki-67, respectively, was performed using the Envision + System HRP and visualized by diaminobenzidine (Dako), according to the manufacturer’s instructions, followed by counterstaining with hematoxylin. Normal pancreas islets were used as positive control for chromogranin A and synaptophysin, and normal tonsil tissue was used as positive control for Ki-67. Negative controls were performed by omitting the primary antibodies.
Immunohistochemical slides were reviewed by two observers (BK, CL). Regions containing chromogranin A- and synaptophysin positive cells were identified with low power (× 25) microscopy. Patchy (cohesive) immunoreaction was semiquantitatively assessed as percentage of positively stained areas related to the entire tumor area represented on the slide. In the case of disseminated immunoreaction, the percentage of chromogranin A/synaptophysin expression was evaluated by counting positive tumor cells in the areas of highest labeling densitiy (as performed by Pagani et al., [20]) using a raster ocular lens at high power (× 400; 0.273 mm²) microscopy. Chromogranin A and synaptophysin reactivity, respectively, was scored according to a modified three-tie system established by Shia et al. [21], including score 0: no staining in tumor cells; score 1+: > 0 and < 30% of tumor cells stained; score 2+: ≥ 30% of tumor cells stained. Only samples with at least 10% neuroendocrine differentiation were chosen for Ki-67 immunohistochemistry. The neuroendocrine foci were marked on the chromogranin A or synaptophysin slides and re-identified at the Ki-67 slide. The percentage of Ki-67 positive tumor cells in hotspot areas within the marked foci was assessed using a raster ocular lens at × 400 magnification.
DNA isolation
Manual microdissection was performed before DNA extraction from primary and metastatic CRC tissue: A sufficient amount of neoplastic tissue was microscopically identified on hematoxylin- and eosin stained slides. This same area was then re-identified on the unstained 10 μm dewaxed, rehydrated and air-dried tissue section and separately isolated with a cannula, predominantly without adherent non-neoplastic tissue. Separately embedded resection margins without evidence of tumor were used as normal tissue for CRC patients. DNA isolation from paraffin embedded tissue was performed with the High Pure PCR Template Preparation Kit (Roche Molecular Biochemicals, Mannheim, Germany) and the innuPrep DNA Minikit (Analytik Jena, Jena, Germany). Quality of DNA was assessed by agarose gel electrophoresis.
Sequencing analysis
Sequencing analysis of Kras Exon 2 was done for part of samples as a means of quality control with primers F 5’ AGGCCTGCTGAAAATGACTGAATA and R 5’ CTGTATCAAAGAATGGTCCTGCAC. PCR amplification was performed in 12.5 μl sample volumes with 1-2 ng of genomic tumor or nonneoplastic DNA as template in 15 mM Tris/HCl, 50 mM KCl, with 200 μM dNTPs, 1.5 mM MgCl2, 0.1 nM primers, and 1 Unit HotStart Taq Polymerase (Applied Biosystems). An initial denaturation and activation step of 8 min at 95°C was followed by 30-35 cycles of 1 min at 95°C, 1 min at 55°C and 2 min at 72°C, and a 30 min final elongation step at 72°C. Sequencing was always carried out in both directions with the BigDye sequencing kit according to the manufacturer’s instructions (Applied Biosystems). Each mutation was verified by a second sequencing reaction of an independent amplification product.
Assessment of Kras mutations with Kras strip assay
For assessment of mutation status of Kras positions 12, 13 and 61, we used the KRAS 12/13/61 StripAssay® (ViennaLab, Vienna, Austria) according to the manufacturer’s instructions. It detects the mutations c.35G > C, c.34G > C, c.35G > A, c.34G > T, c.[34G > A;35G > T], c.[34G > C; 35G > T], c.34G > A, c.35G > T, c.38G > A, c.37G > T, c.182A > G, c.183A > T and c.182A > T and includes positive and negative amplification and hybridization controls. As quality control, the mutation status was verified by a second reaction directly by ViennaLab in 54 randomly chosen samples with no divergent results.
SNP analysis
Twenty-six recurrent cancer pathway mutations were included in this study as summarized in Table S1 (primer sequences partly from Dias-Santagata [22], and partly self-designed with primer 3 [23]). They were combined to two SNaPshot assays with the additional safeguard against artefacts that neighbouring mutations were never amplified in one assay together. For both SNP analyses, multiplex PCR was done in a volume of 12.5 μl in the GeneAmp® PCR system 9700 (Applied Biosystems) with 0.5-2 ng of DNA as template in 15 mM Tris/HCl, 50 mM KCl, with 200 μM dNTPs, 1.5 mM MgCl2, 0.1 μM each primer (primer sequences see Table S1) and 1.5 Units AmpliTaq Gold Polymerase (App-lied Biosystems). PCR conditions were: Initial denaturation and activation step of 8 min at 95°C, 30 cycles of 1 min at 94°C, 1 min at 52°C and 2 min at 72°C, and a 45 min final elongation step at 60°C. SNaPshot analyses were performed with the SNaPshot Multiplex kit (Applied Biosystems) (primer sequences see Table S1) in accordance with the manufacturer’s instructions and evaluated on an ABI310 Genetic Analyzer. Electrophoresis results were analysed using the GeneMapper® ID Software v3.2 with self-designed panels and bins sets.
Statistical analysis
The frequencies of neuroendocrine differentiation and KRAS/NRAS/BRAF/PIK3CA/TP53 mutational status in primary tumors, in lymph node metastases and in distant metastases were compared using the Chi-square test and the Fisher’s exact test. Differences in the frequency of KRAS mutations comparing primary and metastatic CRC tissue within the neuroendocrine positive tissue group and the neuroendocrine negative tissue group were assessed by the Cochran-Armitage test for trend and the Spearman correlation coefficient. Discordant neuroendocrine differentiation and mutational status between distant metastases with several clinical conditions were compared using Chi-square test and Fisher’s exact test. Fisher’s exact test was used for comparison of concordant and discordant combined neuroendocrine differentiation/mutational status in primary and metastatic CRC tissue between different mutation statuses. A P-value of less than 0.05 (two-tailed) was considered statistically significant. All data were analyzed by using SAS 9.1.5 (SAS Institute Inc., Cary, NC, USA).
Results
Clinical and histopathological data
Clinical data of the patients, histopathological characteristics of the primary tumors and distant metastatic sites are listed in Table 1. Twenty-seven (38%) distant metastases were considered as synchronous (occurrence within 6 months after primary diagnosis of CRC) and 45 (62%) distant metastases were defined as metachronous (occurrence beyond 6 months after primary diagnosis of CRC) according to a definition of Mekenkamp et al. [24]. The mean time interval between resection of the primary tumor and development of metachronous metastasis was 26 months. Twenty-seven metachronous metastases were biopsied or resected after application of chemotherapy (regimens are listed in Table 1). No chemotherapy was applied before sampling or resection of synchronous metastases and the remaining 18 metachronous metastases. After follow-up for an average of 55 months, the tumor related death rate was 76%.
Table 1.
Clinicopathological details of patients and specimens
| Parameter | Number of cases | |
|---|---|---|
| Age1 | Mean: 66 years. Range: 32-88 years. | |
| Gender1 | Male | 55 (48%) |
| Female | 60 (52%) | |
| Clinical Stage1 | III | 68 (59%) |
| IV | 47 (41%) | |
| Type of chemotherapy1 | FLV / Xeloda | 65 (57%) |
| FLIRI | 12 (10%) | |
| FLOX | 15 (13%) | |
| None | 23 (20%) | |
| Large intestine tumor site2 | Coecum | 22 (19%) |
| Ascending | 17 (15%) | |
| Transverse | 11 (10%) | |
| Descending | 19 (16%) | |
| Sigmoid | 19 (16%) | |
| Rectum | 28 (24%) | |
| pT stage1 | ≤ 2 | 5 (4%) |
| 3 | 90 (78%) | |
| 4 | 20 (18%) | |
| pN stage1 | 0 | 6 (5%) |
| 1 | 68 (59%) | |
| 2 | 41 (36%) | |
| Histological Grading2 | 1 (highly differentiated) | 1 (1%) |
| 2 (moderately differentiated) | 89 (77%) | |
| 3 (poorly differentiated) | 26 (22%) | |
| Distant metastatic sites3 | Liver | 22 (30%) |
| Abdominal wall | 10 (14%) | |
| Peritoneum | 7 (10%) | |
| Oment | 5 (7%) | |
| Small intestine | 4 (5%) | |
| Diaphragm | 2 (3%) | |
| Uterus, vagina, ovary, tube | 14 (19%) | |
| Lung and pleura | 2 (3%) | |
| Adrenal gland | 2 (3%) | |
| Pelvis and perivesical fat | 2 (3%) | |
| Skin | 2 (3%) | |
Number of cases = 115;
Number of primary tumors = 116;
Number of distant metastases = 72.
Results were compared within three matched data sets. The immunohistochemical data sets consisted of 258 matched pairs of primary tumors and lymph node metastases (A), 72 matched pairs of primary tumors and distant metastases (B) and 54 matched pairs of distant metastases and lymph node metastases (C). For comparison with molecular genetic results, data set (A) and (C) were modified and consisted of 108 matched primary tumor/lymph node metastases pairs and 31 matched distant metastases/lymph node metastases pairs, respectively, due to considering only one lymph node metastasis with the highest immunoreaction score in each case. The molecular genetic data sets consisted of 109 matched pairs of primary tumors and lymph node metastases (A), 42 matched pairs of primary tumors and distant metastases (B) and 31 matched pairs of distant metastases and lymph node metastases (C). For one out of these 109 primary tumor/lymph node metastases pairs, the lymph node containing sufficient tumor on the HE control slide following sampling for DNA analysis displayed no tumor tissue on the slides for immunohistochemical analysis. Therefore, this tumor pair was excluded from comparison with immunohistochemical results.
Immunohistochemical neuroendocrine marker expression
Neuroendocrine marker expression was seen in 107 (24%) out of 446 tumor samples, which were available for immunohistochemical analysis. Within these 107 positive samples, 30 (28%) specimen showed only chromogranin A expression, 32 (30%) samples displayed only synaptophysin expression and 45 (42%) specimen expressed both markers. Examples for neuroendocrine marker expression are displayed in Figure 1. Finally, a tumor sample was considered positive, if it expressed at least one neuroendocrine marker. According to this definition, 36 (31%) out of 116 primary tumors, 51 (20%) out of 258 lymph node metastases and 20 (28%) out of 72 distant metastases showed neuroendocrine marker expression, comprising scores 1+ and 2+. Comparison of the three investigated CRC groups showed significant difference (P = 0.044), which can be mainly attributed to the low frequency of neuroendocrine differentiation in lymph node metastases compared to primary tumors and distant metastases. In none of these samples, neuroendocrine differentiation has been recognized during routine processing prior to this study. Proliferation activity of the neuroendocrine tumor component as indicated by immunohistochemical Ki-67 labeling was determined for ten primary CRC (mean 39%, range 17-71%), 14 lymph node metastases (mean 42%, range 13-67%) and nine distant metastases (mean 30%, range 9-54%). Within these groups, all but two primary tumors, one lymph node metastasis and one distant metastasis showed a Ki-67 labeling index > 20%, confirming high grade (G3) of the neuroendocrine tumor component according to the current definition [25]. Distribution of neuroendocrine marker expression at different scores in primary and metastatic CRC tissue is displayed in Figure 1. Concordance and discordance at different scores of neuroendocrine marker expression in the three matched data sets is displayed in Figure 2A-C. In one case with two synchronous primary tumors, both carcinomas displayed the same expression score (0). For comparison with the corresponding lymph node metastasis, these synchronous carcinomas were considered as one primary tumor, because it could morphologically not be determined, which carcinoma was the origin of the metastasis. Briefly, neuroendocrine differentiation status irrespective of the score was discordant in 35% of the matched primary tumor/lymph node metastasis pairs, 36% of the matched primary tumor/distant metastasis pairs and in 28% of the matched distant metastasis/lymph node metastasis pairs. At comparison by score, the discordance rates for matched lymph node metastasis/primary tumor pairs, distant metastasis/primary tumor pairs and distant metastasis/lymph node metastasis pairs were lowest at score 0 and highest at score 1+. In 21 (32%) out of 66 CRC cases with multiple lymph node metastases (range: 2 to 8/case), matched lymph node metastases showed discordant neuroendocrine differentiation status. Accordingly, in 2 (14%) out of 14 cases with multiple distant metastases (range: 2 to 6/case), matched distant metastases displayed discordant neuroendocrine differentiation.
Figure 1.
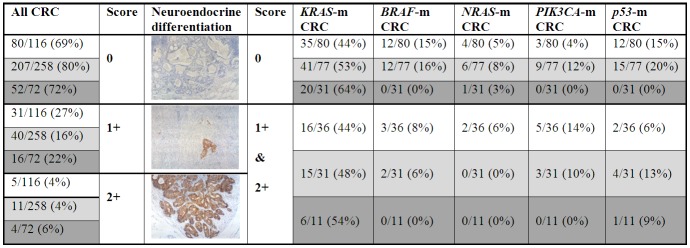
Frequency of neuroendocrine differentiation scores 0, 1+ and 2+ in primary and metastatic colorectal cancer. The photo insets display a lymph node metastases without neuroendocrine differentiation (score 0, × 100), a primary tumor with score 1+ synaptophysin expression (× 100) and a distant peritoneal metastasis with score 2+ synaptophysin expression (× 100). Different background color in the table positions indicate primary tumors (white), lymph node metastases (light grey) and distant metastases (dark grey). Frequency of neuroendocrine negativity (score 0) and neuroendocrine positivity (comprising score 1+ and score 2+) are compared separately for mutant (m) cases, considering all five genes analyzed in this study.
Figure 2.
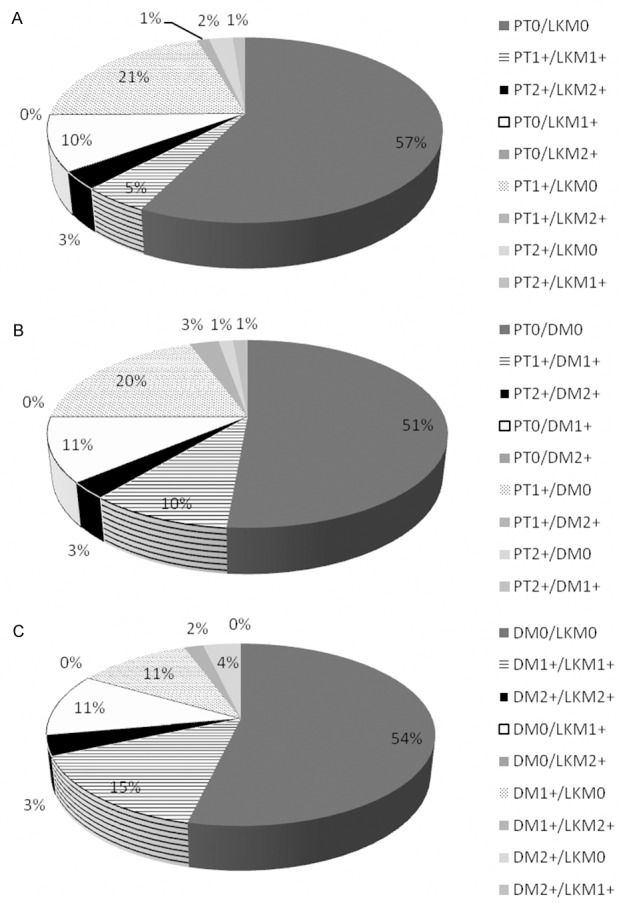
Concordance and discordance of neuroendocrine differentiation in matched primary tumor/lymph node metastases pairs (A), primary tumor/distant metastases pairs (B) and distant metastases/lymph node metastases pairs (C), considering all possible combinations of neuroendocrine differentiation scores.
Mutation analysis
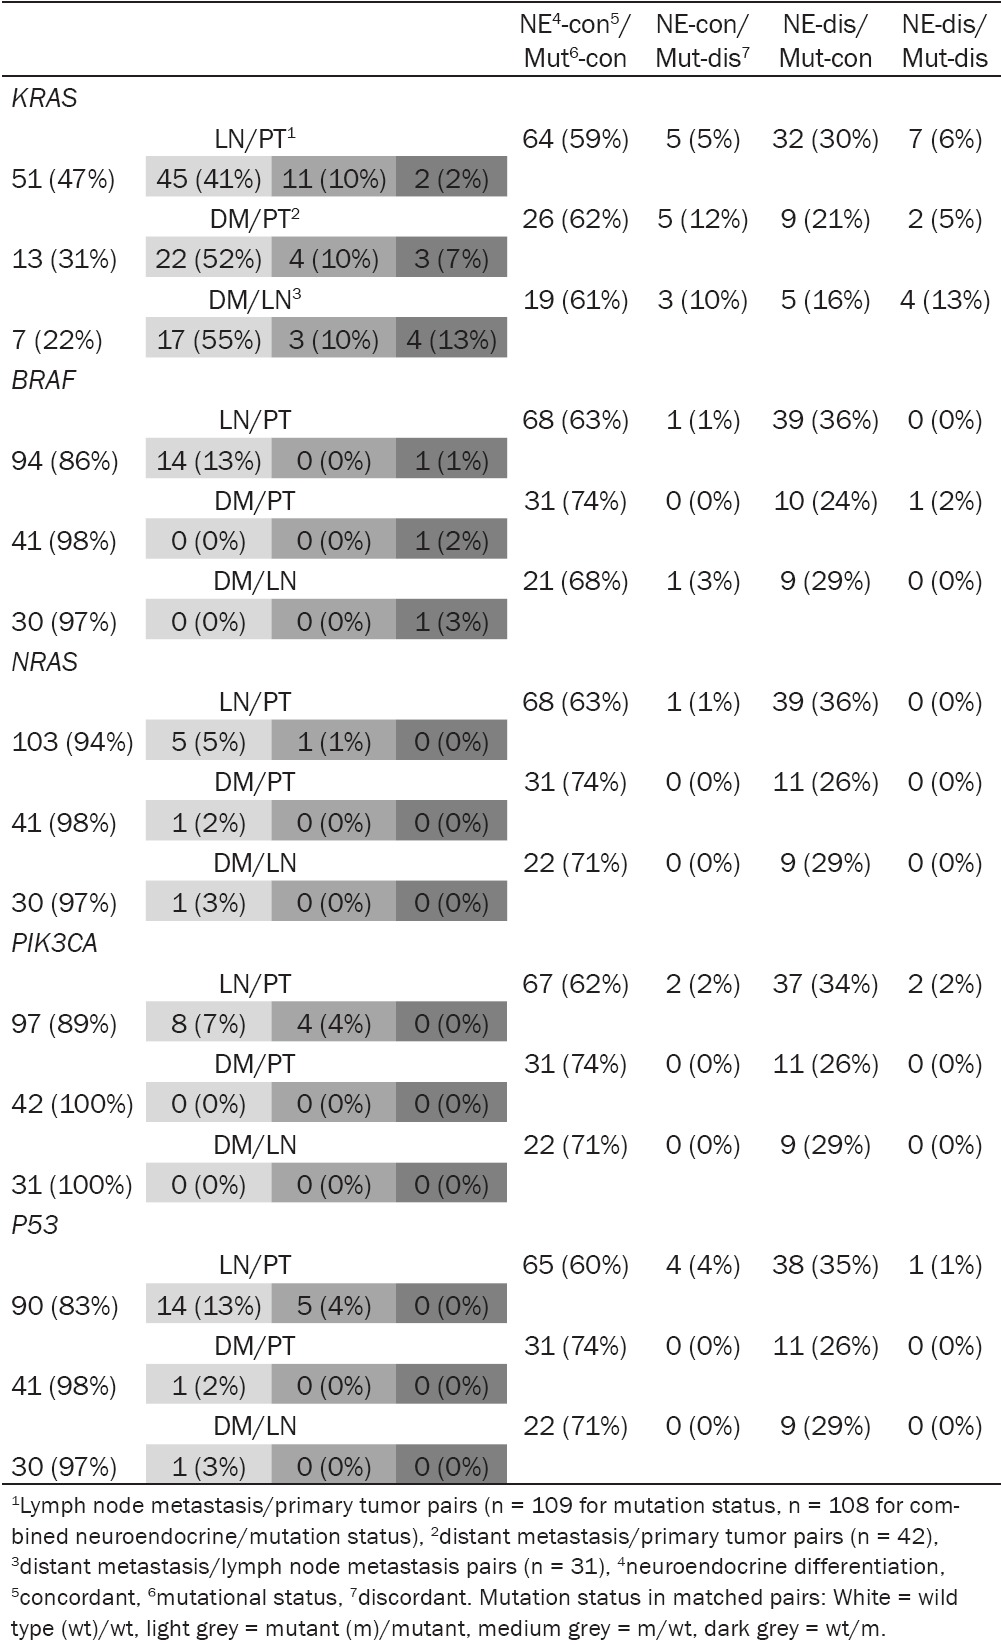
This analysis detected KRAS mutations (example displayed in Figure 3) in 133 (50%), BRAF mutations in 29 (11%), NRAS mutations in 13 (5%), PIK3CA mutations in 20 (8%) and TP53 mutations in 34 (13%) out of 267 CRC samples, comprising primary and metastatic tumor tissue, which were available for molecular genetic analysis. The mutation rate for each gene in primary CRC, lymph node metastases and distant metastases is displayed in Figure 1. The rates of BRAF- and TP53 mutations differed significantly between primary tumors and distant metastases (P = 0.023 and 0.036, respectively). In 16 primary tumors and 25 lymph node metastases, a mutation could be detected in two genes (primary CRC with 9x KRAS/TP53, 3x BRAF/TP53, 2x NRAS/PIK3CA, 1x KRAS/PIK3CA, 1x BRAF/PIK3CA, and lymph node metastases with 11x KRAS/TP53, 6x BRAF/TP53, 4x KRAS/PIK3CA, 3x NRAS/PIK3CA, 1x BRAF/PIK3CA). Mutations in KRAS, NRAS and BRAF were mutually exclusive. Distant metastases did not show mutation in more than one gene. Concordance and discordance of KRAS/NRAS/BRAF/PIK3CA/TP53 mutational status in the three matched data sets is displayed in Table 2. In all three data sets, the discordance was highest for KRAS mutational status. Discordant mutational status between primary tumors and lymph node metastases was found for all genes considered in this study. In addition, eight distant metastases/primary tumor pairs showed a discordant mutational status (seven for KRAS and one for BRAF). In one (10%) out of 10 CRC cases with multiple distant metastases available for mutation analysis (range: 2 to 4/case), matched distant metastases displayed discordant mutational status.
Figure 3.
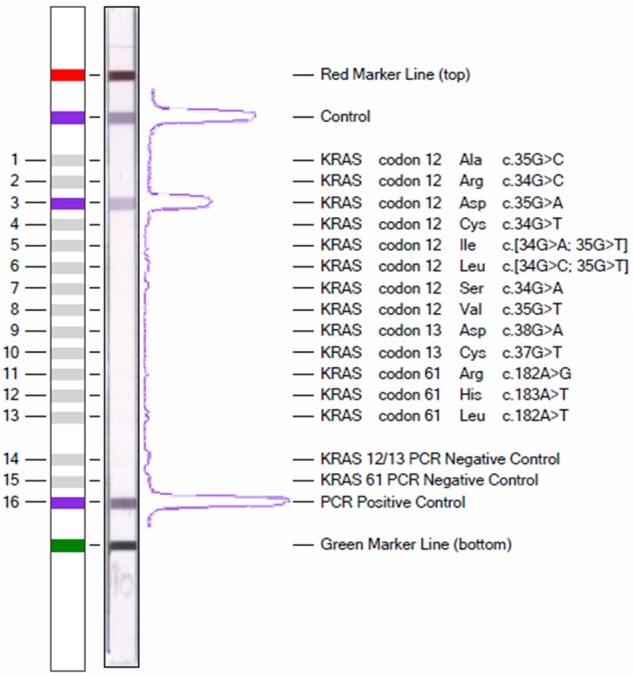
Picture of a KRAS strip assay. Design of the teststrip to the left, real example showing a c.35G < A mutation in codon 12 to the right.
Table 2.
Concordance and discordance of combined mutational and neuroendocrine differentiation status in matched primary/metastatic CRC pairs
|
Comparison of neuroendocrine differentiation and mutational status in primary and metastatic CRC
The frequency of KRAS, NRAS, BRAF, PIK3CA and TP53 mutations in primary and metastatic CRC tissue with and without neuroendocrine differentiation is displayed in Figure 1. No significant differences were found comparing the KRAS mutation rate between neuroendocrine negative and neuroendocrine positive CRC tissue (comprising primary tumors and metastases). However, the frequency of KRAS mutations increased significantly comparing primary tumors, lymph node metastases and distant metastases within the neuroendocrine negative group (Cochran-Armitage test for trend: P = 0.044, Spearman correlation coefficient = 0.1456 [95% CI, 0.0051, 0.2860], p = 0.042), whereas these differences were not significant in the neuroendocrine positive group. Comparing only distant metastases, neuroendocrine differentiation was more frequently seen in wild type (5/16 cases, 31%) compared to KRAS mutant distant metastases (6/26 cases, 23%), but this difference was not significant (P = 0.5585). Furthermore, neuroendocrine negative CRC showed a higher rate of NRAS-, BRAF-, TP53-mutations (comprising primary and metastatic tumor tissue) and PIK3CA-mutations (only comparing lymph node metastases), respectively, compared to neuroendocrine positive CRC, whereas a lower rate of PIK3CA-mutations was seen in neuroendocrine negative compared to positive primary tumors. These differences were not significant, largely due to small sample size. Stratification of mutant cases into neuroendocrine score 1+ and 2+ is not displayed in Figure 1 because of small case numbers in the groups. However, it is worthy to mention that one of the three distant metastases with loss of KRAS mutation and the only distant metastasis with loss of BRAF mutation showed a higher neuroendocrine differentiation score than the corresponding primary tumors harboring these mutations (score 2+ and 1+ versus score 1+ and 0, respectively).
Table 2 shows concordance and discordance of combined neuroendocrine and mutation status in the three matched data sets, comparing the five genes analyzed in this study. In all data sets, the lowest percentage of combined concordant neuroendocrine/concordant mutational status was found for KRAS, but differences compared to the other genes were not significant. The rare combination of concordant neuroendocrine differentiation status with discordant mutation status could exclusively be attributed to KRAS in the matched distant metastases/primary tumor set (marginal significance, P = 0.0551). Focusing on the two other matched data sets, this combination was also most frequently found for KRAS, but differences compared to the other genes were not significant. The combination of discordant neuroendocrine differentiation with discordant mutation status was another rare finding, which could mainly be attributed to KRAS. However, only comparison of matched lymph node metastases/primary tumor sets between KRAS, BRAF and NRAS, respectively, revealed significant differences (P = 0.0141). Combination of discordant neuroendocrine differentiation with concordant mutation status was seen in each of the three data sets without obvious differences between the five analyzed genes.
Neuroendocrine differentiation was significantly less concordant than KRAS/NRAS/BRAF/PIK3CA/TP53 mutational status in primary tumor/lymph node metastases pairs (65% versus 88%-99%; P < 0.0001) and primary tumor/distant metastases pairs (64% versus 83%- 100%; P = 0.027 and P < 0.0001, respectively) as displayed in Table 3. Neuroendocrine differentiation was also less concordant than NRAS/BRAF/PIK3CA/TP53 mutation status in distant metastases/lymph node metastases pairs (Table 3).
Table 3.
Concordance of neuroendocrine differentiation and mutation status in matched tumor pairs
| Comparison | LN/PT1 pairs | DM/PT2 pairs | DM/LN3 pairs |
|---|---|---|---|
| Neuroendocrine versus | 168/258 (65%) | 46/72 (64%) | 39/54 (72%) |
| KRAS | 96/109 (88%) | 35/42 (83%) | 24/31 (77%) |
| P 4 < 0.0001 | P = 0.027 | P = 0.598 | |
| BRAF | 108/109 (99%) | 41/42 (98%) | 30/31 (97%) |
| P < 0.0001 | P < 0.0001 | P = 0.0077 | |
| NRAS | 108/109 (99%) | 42/42 (100%) | 31/31 (100%) |
| P < 0.0001 | P < 0.0001 | P = 0.0007 | |
| PIK3CA | 105/109 (96%) | 42/42 (100%) | 31/31 (100%) |
| P < 0.0001 | P < 0.0001 | P = 0.0007 | |
| TP53 | 104/109 (95%) | 42/42 (100%) | 31/31 (100%) |
| P < 0.0001 | P < 0.0001 | P = 0.0007 |
Lymph node metastasis/primary tumor pairs;
distant metastasis/primary tumor pairs;
distant metastasis/lymph node metastasis pairs;
P = P-value.
Discordant neuroendocrine and mutational status between distant metastases with several clinical conditions is compared in Table 4. Metachronous metastases were more frequently neuroendocrine discordant to matched primary tumors than synchronous metastases; this difference was marginally significant (P = 0.057). Discordant neuroendocrine differentiation and mutation status was not associated with postoperative chemotherapy or distant metastatic site.
Table 4.
Comparison of clinical conditions in neuroendocrine and mutational discordant distant metastases
| Distant Metastases | Discordant neuroendocrine | Discordant mutation |
|---|---|---|
| Onset of metastases | ||
| Synchronous | 6/27 (22%) | 3/18 (17%) |
| Metachronous | 20/45 (44%) | 5/24 (21%) |
| P 1 = 0.057 | n.s.2 | |
| Postoperative Chemotherapy | ||
| Yes | 12/27 (44%) | 4/13 (31%) |
| No | 14/45 (31%) | 4/29 (14%) |
| P = 0.25 | P = 0.23 | |
| Metastatic site | ||
| Liver | 11/22 (50%) | 2/10 (20%) |
| Non-liver | 15/50 (30%) | 6/32 (19%) |
| P = 0.10 | n.s.2 |
P-value;
n.s. = not significant.
Discussion
This study was performed to investigate neuroendocrine differentiation and its possible link to KRAS/NRAS/BRAF/PIK3CA/TP53 mutational status in primary and metastatic CRC. Previous studies on neuroendocrine differentiation in conventional CRC focused mainly on primary tumors, which are reported to contain a variable amount of neuroendocrine cells, largely depending on the method used to assess the neuroendocrine cell population [19] and diagnostic definitions [26]. Due to the known metastatic potential of even small neuroendocrine tumor foci [26] and probably different biologic impact of chromogranin A versus synaptophysin positive tumor cells [27], we considered CRC foci of any size ≥ 1% expressing at least one of these two markers. By this approach, we detected in our primary CRC group a frequency of neuroendocrine differentiation, which is placed approximately in the middle of the range reported for neuroendocrine differentiation in conventional CRC (5%-77.5%, [17,18]) and significantly higher than the neuroendocrine differentiation rate in our lymph node metastases set. This finding is in accordance with data of Volante et al. [19], who reported this difference based on a lower neuroendocrine marker expression rate in primary CRC and lymph node metastases (22.2% versus 10%, respectively). In contrast to the study of Volante et al. [19], who detected by use of only one neuroendocrine marker (chromogranin A) neuroendocrine differentiation more than twice as frequently in distant metastases compared to primary tumors, we found neuroendocrine marker expression slightly less frequent in distant metastases compared to primary tumors. In addition, neuroendocrine differentiation was less evident in our distant metastases group (28%) than in the metastases set published by Volante et al. [19] (46%), to the best of our knowledge the currently only study considering neuroendocrine differentiation in both, primary and metastatic conventional CRC. These few diverging results could be in part due to different study design (for example ratio resected versus biopsied metastases, ratio synchronous versus metachronous metastases, status without or after chemotherapy). Nevertheless, the consistent finding of neuroendocrine differentiation in a subset of distant CRC metastases compared to a significantly lower incidence of neuroendocrine marker expression in lymph node metastases raises the question, whether neuroendocrine differentiation in distant metastases occurs more likely “de novo” than it results from implantation of circulating neuroendocrine differentiated tumor cells at a distant site. The characterization of synaptophysin as an integral membrane glycoprotein, with its expression being probably reloaded in the invasion front of CRC [27] could support the “de novo” hypothesis in growing distant metastases, but only clonal analysis can prove this theory. Regardless of the currently unknown underlying biological background, practical implication of our findings is that targeting neuroendocrine tumor cells might help to treat, but not necessarily to prevent distant metastases in lymph node positive CRC.
Another focus of this study was the search for a link between neuroendocrine differentiation and KRAS/NRAS/BRAF/PIK3CA/TP53 mutation status. We found a mutation rate within the published range for primary tumors in the case of KRAS (32%-45%) [28,29], NRAS (2.9%-5%) [29,30] and BRAF (7%-17.6%) [29,31,32] and only slightly lower than the published rates in the case of PIK3CA mutations (9%-21%) [29,31]. Because of limited material in some cases, we searched only for known mutations in selected exons of the TP53 gene and detected therefore a remarkably lower mutation rate for this gene than other authors (30.3%-60%) [29,30], who performed sequencing analysis for all coding exons. We detected a significantly lower BRAF mutation rate in distant metastases than in primary tumors as published previously by Vakiani et al. [30], whereas higher KRAS mutation rates in lymph node and distant metastases compared to primary tumors of this study could not be confirmed by others [30,31]. In accordance with the literature [30,31], this study revealed a mutation status, which was highly concordant in matched primary tumor/distant metastases and primary tumor/lymph node metastases pairs (≥ 98% and ≥ 96%, respectively) for BRAF, NRAS, PIK3CA and TP53. Considering KRAS mutations, we found less concordance for matched primary tumor/lymph node metastases pairs, which is in line with previous reports [31,33], and a primary tumor/distant metastases concordance, which can be placed in the middle of the range for concordance rates found by systematic review of the literature (68%-100%) [34,35]. A different KRAS mutation status between primary and metastatic CRC is in contrast to the model that alterations in RAS occur early in colorectal carcinogenesis [36]. However, other pathogenetic points of view and our application of the highly sensitive KRAS strip assay might explain these results. Previous publications raise the hypotheses that KRAS mutations in metastatic CRC could have been acquired during the metastatic process [37] or derived from primary CRC with heterogeneously distributed KRAS mutant tumor foci, which are reported to occur in 8 to 48% of CRC [31,38] and already can be missed during sampling of the grossing tissue. Intrametastatic KRAS mutations of this origin might show low copy number requiring highly sensitive tests and appropriate sampling for correct assessment of the mutation status. After stratification of KRAS mutant cases, neuroendocrine positive (NE+) metastases showed a lower KRAS mutation rate than neuroendocrine negative (NE0) metastases, whereas nearly the same frequency of KRAS mutations could be demonstrated for NE+ and NE0 primary tumors. In addition, KRAS mutation rates increased significantly, when comparing primary tumors, lymph node metastases and distant metastases within the neuroendocrine negative CRC group, whereas KRAS mutation rates did not significantly differ between primary and metastatic tumors of the neuroendocrine positive CRC group. These findings must be interpreted with caution, because of small sample size in the analyzed groups. Further studies with larger cohorts and other experimental design are necessary to elucidate, whether neuroendocrine differentiated and KRAS mutant tumor cells could be two competing subclones during the metastatic process.
Assuming that neuroendocrine differentiation could be important for future mono- or multitargeted therapies, identification of the optimal tissue source for immunohistochemical testing is necessary for correct patient selection. In matched primary and metastatic CRC pairs, neuroendocrine differentiation was significantly less concordant than mutation status of the five investigated genes. Beside already discussed preanalytical and analytical factors as heterogeneity of KRAS mutations in primary CRC and application of tests with varying sensitivity, undetected synchronous primary tumors, a wide variety of investigated metastatic sites and cytotoxic therapy are mentioned as reasons for these controversial results [19,30,34]. The two synchronous primary CRCs in this study showed the same neuroendocrine and mutational status as the corresponding lymph node metastasis. Furthermore, various distant metastatic sites and postoperative chemotherapy did not contribute to discordant neuroendocrine or mutation status in this study. Discordant neuroendocrine differentiation was seen twice as high in metachronous compared to synchronous metastases, but this difference was only marginally significant due to small samples size in the investigated groups. Therefore, other factors than analyzed in this study might affect the concordance of neuroendocrine differentiation in primary and metastatic CRC.
Even if we were not able to identify the underlying biological or clinical mechanisms, our data could have practical consequences. Considering the low frequency of neuroendocrine differentiation and its relatively high rate of heterogeneity between primary and metastatic CRC, targeting of neuroendocrine tumor cells is an option only for a small subset of CRC patients, and biopsies from the metastatic site should be used to guide this therapy.
Acknowledgements
The authors thank Mette Tellefsen for excellent technical assistance.
Disclosure of conflict of interest
Michael Novy and Christian Oberkanins are employees of ViennaLab Diagnostics GmbH, Vienna, Austria.
Supporting Information
References
- 1.McCubrey JA, Steelman LS, Abrams SL, Lee JT, Chang F, Bertrand FE, Navolanic PM, Terrian DM, Franklin RA, D’Assoro AB, Salisbury JL, Mazzarino MC, Stivala F, Libra M. Roles of the RAF/MEK/ERK and PI3K/PTEN/AKT pathways in malignant transformation and drug resistance. Adv Enzyme Regul. 2006;46:249–279. doi: 10.1016/j.advenzreg.2006.01.004. [DOI] [PubMed] [Google Scholar]
- 2.Scaltriti M, Baselga J. The epidermal growth factor receptor pathway: a model for targeted therapy. Clin Cancer Res. 2006;12:5268–5272. doi: 10.1158/1078-0432.CCR-05-1554. [DOI] [PubMed] [Google Scholar]
- 3.Allegra CJ, Jessup JM, Somerfield MR, Hamilton SR, Hammond EH, Hayes DF, McAllister PK, Morton RF, Schilsky RL. American Society of Clinical Oncology provisional clinical opinion: Testing for KRAS gene mutations in patients with metastatatic colorectal carcinoma to predict response to anti-epidermal growth factor receptor monoclonal antibody therapy. J. Clin. Oncol. 2009;27:2091–2096. doi: 10.1200/JCO.2009.21.9170. [DOI] [PubMed] [Google Scholar]
- 4.Oden-Gangloff A, Di Fiore F, Bibeau F, Lamy A, Bougeard G, Charbonnier F, Blanchard F, Tougeron D, Ychou M, Boissiere F, Le Pessot F, Sabourin JC, Tuech JJ, Michel P, Frebourg T. TP53 mutations predict disease control in metastatic colorectal cancer treated with cetuximab-based chemotherapy. Br J Cancer. 2009;100:1330–1335. doi: 10.1038/sj.bjc.6605008. [DOI] [PMC free article] [PubMed] [Google Scholar]
- 5.Kim JS, Lee C, Bonifant CL, Ressom H, Waldman T. Activation of p53-dependent growth suppression in human cells by mutations in PTEN or PIK3CA. Mol Cell Biol. 2007;27:662–677. doi: 10.1128/MCB.00537-06. [DOI] [PMC free article] [PubMed] [Google Scholar]
- 6.Voutsina A, Tzardi M, Kalikaki A, Zafeiriou Z, Papadimitraki E, Papadakis M, Mavroudis D, Georgoulias V. Combined analysis of KRAS and PIK3CA mutations, MET and PTEN expression in primary tumors and corresponding metastases in colorectal cancer. Mod Pathol. 2013;26:302–313. doi: 10.1038/modpathol.2012.150. [DOI] [PubMed] [Google Scholar]
- 7.Loupakis F, Ruzzo A, Cremolini C, Vincenzi B, Salvatore L, Santini D, Masi G, Stasi I, Canestrari E, Rulli E, Floriani I, Bencardino K, Galluccio N, Catalano V, Tonini G, Magnani M, Fontanini G, Basolo F, Falcone A, Graziano F. KRAS codon 61, 146 and BRAF mutations predict resistance to cetuximab plus irinotecan in KRAS codon 12 and 13 wild-type metastatic colorectal cancer. Br J Cancer. 2009;101:715–721. doi: 10.1038/sj.bjc.6605177. [DOI] [PMC free article] [PubMed] [Google Scholar]
- 8.Di Nicolantonio F, Martini M, Molinari F, Sartore- Bianchi A, Arena S, Saletti P, De Dosso S, Mazzucchelli L, Frattini M, Siena S, Bardelli A. Wild-type BRAF is required for response to panitumumab or cetuximab in metastatic colorectal cancer. J. Clin. Oncol. 2008;26:5705–5712. doi: 10.1200/JCO.2008.18.0786. [DOI] [PubMed] [Google Scholar]
- 9.Sartore-Bianchi A, Martini M, Molinari F, Veronese S, Nichelatti M, Artale S, Di Nicolantonio F, Saletti P, De Dosso S, Mazzucchelli L, Frattini M, Siena S, Bardelli A. PIK3CA mutations in colorectal cancer are associated with clinical resistance to EGFR-targeted monoclonal antibodies. Cancer Res. 2009;69:1851–1857. doi: 10.1158/0008-5472.CAN-08-2466. [DOI] [PubMed] [Google Scholar]
- 10.De Roock W, Claes B, Bernasconi D, De Schutter J, Biesmans B, Fountzilas G, Kalogeras KT, Kotoula V, Papamichael D, Laurent-Puig P, Penault-Llorca F, Rougier P, Vincenzi B, Santini D, Tonini G, Cappuzzo F, Frattini M, Molinari F, Saletti P, De Dosso S, Martini M, Bardelli A, Siena S, Sartore-Bianchi A, Tabernero J, Macarulla T, Di Fiore F, Gangloff AO, Ciardiello F, Pfeiffer P, Qvortrup C, Hansen TP, Van Cutsem E, Piessevaux H, Lambrechts D, Delorenzi M, Tejpar S. Effects of KRAS, BRAF, NRAS, and PIK3CA mutations on the efficacy of cetuximab plus chemotherapy in chemotherapy-refractory metastatic colorectal cancer: A retrospective consortium analysis. Lancet Oncol. 2010;11:753–762. doi: 10.1016/S1470-2045(10)70130-3. [DOI] [PubMed] [Google Scholar]
- 11.Tol J, Dijkstra JR, Vink-Börger ME, Nagtegaal ID, Punt CJ, Van Krieken JH, Ligtenberg MJ. High sensitivity of both sequencing and real-time PCR analysis of KRAS mutations in colorectal cancer tissue. J Cell Mol Med. 2010;14:2122–2131. doi: 10.1111/j.1582-4934.2009.00788.x. [DOI] [PMC free article] [PubMed] [Google Scholar]
- 12.Prenen H, De Schutter J, Jacobs B, De Roock W, Biesmans B, Claes B, Lambrechts D, Van Cutsem E, Tejpar S. PIK3CA mutations are not major determinant of resistance to the epidermal growth factor receptor inhibitor cetuximab in metastatic colorectal cancer. Clin Cancer Res. 2009;15:3184–3188. doi: 10.1158/1078-0432.CCR-08-2961. [DOI] [PubMed] [Google Scholar]
- 13.Perrone F, Lampis A, Orsenigo M, Di Bartolomeo M, Gevorgyan A, Losa M, Frattini M, Riva C, Andreola S, Bajetta E, Bertario L, Leo E, Pierotti MA, Pilotti S. PIK3CA/PTEN deregulation contributes to impaired responses to cetuximab in metastatic colorectal cancer patients. Ann Oncol. 2009;20:84–90. doi: 10.1093/annonc/mdn541. [DOI] [PubMed] [Google Scholar]
- 14.Ciunci CA, Perini RF, Avadhani AN, Kang HC, Sun W, Redlinger M, Harlacker K, Flaherty KT, Giantonio BJ, Rosen MA, Divgi CR, Song HK, Englander S, Troxel A, Schnall M, O’Dwyer PJ. Phase 1 and pharmacodynamics trial of everolimus in combination with cetuximab in patients with advanced cancer. Cancer. 2014;120:77–85. doi: 10.1002/cncr.28294. [DOI] [PubMed] [Google Scholar]
- 15.McRee AJ, Davies JM, Sanoff HG, Goldberg RM, Bernard S, Dees EC, Keller K, Ivanova A, O’Neil BH. A phase I trial of everolimus in combination with 5-FU/LV, mFOLFOX6 and mFOLFOX6 plus panitumumab in patients with refractory solid tumors. Cancer Chemother Pharmacol. 2014;74:117–123. doi: 10.1007/s00280-014-2474-0. [DOI] [PMC free article] [PubMed] [Google Scholar]
- 16.Kulke MH. Are neuroendocrine tumors going mainstream? J. Clin. Oncol. 2013;31:404–405. doi: 10.1200/JCO.2012.47.3884. [DOI] [PubMed] [Google Scholar]
- 17.Ferrero S, Buffa R, Pruneri G, Siccardi AG, Pelagi M, Lee A, Coggi G, Bosari S. The prevalence and clinical significance of chromogranin A and secretogranin II immunoreactivity in colorectal adenocarcinoma. Virchows Arch. 1995;426:587–592. doi: 10.1007/BF00192113. [DOI] [PubMed] [Google Scholar]
- 18.Cho YB, Yang SS, Lee WY, Song SY, Kim SH, Shin HJ, Yun SH, Chun HK. The clinical significance of neuroendocrine differentiation in T3-T4 node negative colorectal cancer. Int J Surg Pathol. 2010;18:201–206. doi: 10.1177/1066896909332112. [DOI] [PubMed] [Google Scholar]
- 19.Volante M, Marci V, Andrejevic-Blant S, Tavaglione V, Sculli MC, Tampellini M, Papotti M. Increased neuroendocrine cells in resected metastases compared to primary colorectal adenocarcinomas. Virchows Arch. 2010;457:521–527. doi: 10.1007/s00428-010-0967-8. [DOI] [PubMed] [Google Scholar]
- 20.Pagani A, Papotti M, Abbona GC, Bussolati G. Chromogranin gene expression in colorectal adenocarcinomas. Mod Pathol. 1995;8:626–632. [PubMed] [Google Scholar]
- 21.Shia J, Tickoo SK, Guillem JG, Qin J, Nissan A, Hoos A, Stojadinovic A, Ruo L, Wong WD, Paty PB, Weiser MR, Minsky BD, Klimstra DS. Increased endocrine cells in treated rectal adenocarcinomas: a possible reflection of endocrine differentiation in tumor cells induced by chemotherapy and radiotherapy. Am J Surg Pathol. 2002;26:863–872. doi: 10.1097/00000478-200207000-00004. [DOI] [PubMed] [Google Scholar]
- 22.Dias-Santagata D, Akhavanfard S, David SS, Vernovsky K, Kuhlmann G, Boisvert SL, Stubbs H, McDermott U, Settleman J, Kwak EL, Clark JW, Isakoff SJ, Sequist LV, Engelman JA, Lynch TJ, Haber DA, Louis DN, Ellisen LW, Borger DR, Iafrate AJ. Rapid targeted mutational analysis of human tumours: a clinical platform to guide personalized cancer medicine. EMBO Mol Med. 2010;2:146–158. doi: 10.1002/emmm.201000070. [DOI] [PMC free article] [PubMed] [Google Scholar]
- 23. Primer 3: http://bioinfo.ut.ee/primer3-0.4.0/
- 24.Mekenkamp LJ, Koopman M, Teerenstra S, van Krieken JH, Mol L, Nagtegaal ID, Punt CJ. Clinicopathological featuresand outcome in advanced colorectal cancer patients with synchronous and metachronous metastases. Br J Cancer. 2010;103:159–64. doi: 10.1038/sj.bjc.6605737. [DOI] [PMC free article] [PubMed] [Google Scholar]
- 25.Sobin LH, Gospodarowicz MK, Wittekind Ch. TNM classification of malign tumors. 7th ed. 2009. pp. 100–105. [Google Scholar]
- 26.Li Y, Yau A, Schaeffer D, Magliocco A, Gui X, Urbanski S, Waghray R, Owen D, Gao Z. Colorectal glandular-neuroendocrine mixed tumor: Pathologic spectrum and clinical implications. Am J Surg Pathol. 2011;35:413–425. doi: 10.1097/PAS.0b013e3182093657. [DOI] [PubMed] [Google Scholar]
- 27.Gurzu S, Serester O, Jung I. Possible neuroendocrine phenotype of poorly differentiated cell clusters in colorectal carcinoma, as a prognostic parameter. Am J Surg Pathol. 2014;38:143–144. doi: 10.1097/PAS.0000000000000118. [DOI] [PubMed] [Google Scholar]
- 28.Samowitz WS, Curtin K, Schaffer D, Robertson M, Leppert M, Slattery ML. Relationship of Ki-ras mutations in colon cancers to tumor location, stage, and survival: a population-based study. Cancer Epidemiol Biomarkers Prev. 2000;9:1193–1197. [PubMed] [Google Scholar]
- 29.Peeters M, Oliver KS, Parker A, Siena S, Van Cutsem E, Huang J, Humblet Y, Van Laethem JL, Andre T, Wiezorek J, Reese D, Patterson SD. Massively parallel tumor multigene sequencing to evaluate response to panitumumab in a randomized phase III study of metastatic colorectal cancer. Clin Cancer Res. 2013;19:1902–1912. doi: 10.1158/1078-0432.CCR-12-1913. [DOI] [PubMed] [Google Scholar]
- 30.Vakiani E, Janakiraman M, Shen R, Sinha R, Zeng Z, Shia J, Cercek A, Kemeny N, D’Angelica M, Viale A, Heguy A, Paty P, Chan TA, Saltz LB, Weiser M, Solit DB. Comparative genomic analysis of primary versus metastatic colorectal carcinomas. J. Clin. Oncol. 2012;30:2956–2962. doi: 10.1200/JCO.2011.38.2994. [DOI] [PMC free article] [PubMed] [Google Scholar]
- 31.Baldus SE, Schaefer KL, Engers R, Hartleb D, Stoecklein NH, Gabbert HE. Prevalence and heterogeneity of KRAS, BRAF, and PIK3CA mutations in primary colorectal adenocarcinomas and their corresponding metastases. Clin Cancer Res. 2010;16:790–799. doi: 10.1158/1078-0432.CCR-09-2446. [DOI] [PubMed] [Google Scholar]
- 32.Samowitz WS, Albertsen H, Herrick J, Levin TR, Sweeney C, Murtaugh MA, Wolff RK, Slattery ML. Evaluation of a large, population-based sample supports a CpG island methylator phenotype in colon cancer. Gastroenterology. 2005;129:837–845. doi: 10.1053/j.gastro.2005.06.020. [DOI] [PubMed] [Google Scholar]
- 33.Oliveira C, Velho S, Moutinho C, Ferreira A, Preto A, Domingo E, Capelinha AF, Duval A, Hamelin R, Machado JC, Schartz S Jr, Carneiro F, Seruca R. KRAS and BRAF oncogenic mutations in MSS colorectal carcinoma progression. Oncogene. 2007;26:158–163. doi: 10.1038/sj.onc.1209758. [DOI] [PubMed] [Google Scholar]
- 34.Knijn N, Mekenkamp LJ, Klomp M, Vink-Börger ME, Tol J, Teerenstra S, Meijer JW, Tebar M, Riemersma S, van Krieken JH, Punt CJ, Nagtegaal ID. KRAS mutation analysis: a comparison between primary tumours and matched liver metastases in 305 colorectal cancer patients. Br J Cancer. 2011;104:1020–1026. doi: 10.1038/bjc.2011.26. [DOI] [PMC free article] [PubMed] [Google Scholar]
- 35.Han CB, Li F, Ma JT, Zou HW. Concordant KRAS mutations in primary and metastatic colorectal cancer tissue specimens: A meta-analysis and systematic review. Cancer Invest. 2012;30:741–747. doi: 10.3109/07357907.2012.732159. [DOI] [PubMed] [Google Scholar]
- 36.Fearon ER, Vogelstein B. A genetic model for colorectal tumorigenesis. Cell. 1990;61:759–767. doi: 10.1016/0092-8674(90)90186-i. [DOI] [PubMed] [Google Scholar]
- 37.Velho S, Oliveira C, Seruca R. KRAS mutations and anti-epidermal growth factor receptor therapy in colorectal cancer with lymph node metastases. J. Clin. Oncol. 2009;27:158–159. doi: 10.1200/JCO.2008.20.1525. [DOI] [PubMed] [Google Scholar]
- 38.Fukunari H, Iwama T, Sugihara K, Miyaki M. Intratumoral heterogeneity of genetic changes in primary colorectal carcinomas with metastases. Surg Today. 2003;33:408–413. doi: 10.1007/s10595-002-2520-1. [DOI] [PubMed] [Google Scholar]
Associated Data
This section collects any data citations, data availability statements, or supplementary materials included in this article.