Abstract
Spindle cell tumors are clinically heterogeneous but morphologically similar neoplasms that can occur anywhere, mostly in adult patients. They are treated primarily with surgery to which is often added adjuvant or neoadjuvant radiation. Sub-classification of spindle cell sarcomas requires integration of histology, clinicopathological parameters, immunohistochemistry, cytogenetics (including fluorescence in situ hybridization) and/or molecular genetics. Some of the tumor subtypes are characterized by the presence of distinct chromosomal translocations and fusion genes. When no signs of differentiation are seen, the diagnosis by exclusion becomes undifferentiated spindle cell sarcoma. Cytogenetic, RNA sequencing and RT-PCR analyses were performed on a case of spindle cell sarcoma. The karyotype of the primary tumor was 46,X,del(X)(p?11p?22), der(12)(12pter→12q?22::12q?15→ q?22::16p11→16pter),-16,+r(12). MDM2 was found amplified in both the primary tumor and a metastasis. RNA-Seq of the primary tumor identified four fusion genes, PTGES3-PTPRB, HMGA2-DYRK2, TMBIM4-MSRB3 and USP15-CNTN1, in which all the partner genes map to the q arm of chromosome 12. In material from the metastasis, RT-PCR detected the PTGES3-PTPRB, HMGA2-DYRK2 and TMBIM4-MSRB3 whereas no USP15-CNTN1 fusion transcript was found. Because MDM2 amplification and the fusion transcripts PTGES3-PTPRB, HMGA2-DYRK2 and TMBIM4-MSRB3 were found both in the primary tumor and in the metastasis, they are components of the same clone and may be involved both in initiation and progression of the tumor. Which of them is pathogenetically primary remains unknown.
Keywords: fusion genes, whole transcriptome sequencing, spindle cell sarcoma, MDM2 amplification, rearrangements of chromosome Arm 12q, PTGES3-PTPRB, HMGA2-DYRK2, TMBIM4-MSRB3, USP15-CNTN1
Introduction
Spindle cell tumors are clinically heterogeneous neoplasms with similar morphology. The term is descriptive and based on the tumor cells’ long and slender microscopic appearance. The tumor may be a true sarcoma (connective tissue cancer) or only sarcomatoid which means a tumor that looks like a sarcoma under the microscope (http://www.cancer.org/index). Spindle cell sarcomas can occur anywhere. They are more common in adults and are treated primarily with surgery to which is often added adjuvant or neoadjuvant radiation (1). Sub-classification of spindle cell sarcomas requires integration of histology, clinicopathological parameters, immunohistochemistry, cytogenetics (including fluorescence in situ hybridization) and/or molecular genetics. When no identifiable differentiation can be made the diagnosis is undifferentiated spindle cell sarcoma by exclusion (2). Other tumors are subdivided depending on the differentiation they show. The latter group includes leiomyosarcoma (smooth muscle differentiation), malignant peripheral nerve sheath tumor, fibrosarcoma (fibroblastic differentiation) and myofibroblastic sarcoma (myofibroblastic differentiation) among others. In the subgroup with uncertain differentiation, synovial sarcoma is the most common (1). Cytogenetic and molecular genetic analyses of spindle cell sarcomas have led to the recognition of several distinct chromosomal translocations and fusion genes that characterize specific tumor types. For example, synovial sarcomas carry the translocation t(X;18)(p11;q11) in more than 95% of the cases. It results in rearrangement of the SS18 gene in 18q11 with one of the SSX1, SSX2 or SSX4 genes in Xp11 creating an SS18-SSX1, SS18-SSX2 or SS18-SSX4 chimeric gene (3). A subset of inflammatory myofibroblastic tumor, a neoplasm composed of myofibroblastic spindle cells and infiltrating inflammatory cells, harbors clonal chromosomal rearrangements involving chromosome band 2p23. These rearrangements target the ALK gene, serving as the 3′-partner in fusions with various translocation partners and activating ALK tyrosine kinase function (3). Dermatofibrosarcoma protuberans, another subtype of spindle cell sarcoma, is characterized cytogenetically either by supernumerary ring chromosomes (60% of all examined tumors) or by the translocation t(17;22)(q22;q13) (http://cgap.nci.nih.gov/Chromosomes/Mitelman). Either event results in the formation of a COL1A1-PDGFB fusion gene in which PDGFB exon 1 is deleted and replaced by a variable segment of the COL1A1 gene (4). Solitary fibrous tumors are distinguished by their hemangiopericytoma-like branching vascular pattern, positivity for CD34 by immunohistochemistry and NAB2-STAT6 fusion (2,5,6). Further sub-classification of spindle cell sarcomas may in the future be of value but is currently difficult. Eyden et al (7) presented five ‘diagnostically problematic spindle cell sarcomas’ which lacked defined line of differentiation by light microscopy and showed different clinical courses. In a correlation study between clinicopathological features and karyotypes in spindle cell sarcomas, Fletcher et al (8) reported three unclassified spindle cell sarcomas, two of which showed a normal karyotype whereas the third had a complex karyotype with multiple aberrations. Alaggio et al (9) described two spindle cell tumors with EWSR1-WT1 fusion gene and favorable prognosis. According to the authors, these tumors could represent ‘an unrecognized subgroup of tumors with spindle cell morphology, bearing the same translocation as desmoplastic small round cell tumor, but characterized by a more favorable clinical course’ (9). Lestou et al (10) reported a case of spindle cell sarcoma with a complex karyotype and ring chromosomes. Further analysis with multicolor fluorescence in situ hybridization (FISH) probes showed amplification of chromosome 18 and co-amplification of 12p11 and 12q13~q22 in the ring chromosomes. Recently, Nord et al (11) reported a spindle cell sarcoma of the heart with ring chromosome, amplification of the MDM2 gene and homozygous deletion of CDKN2A (11).
In the present study, we describe a spindle cell sarcoma with ring chromosome composed of chromosome 12 material, several fusion genes mapping to 12q, and amplification of MDM2.
Materials and methods
Ethics statement
The study was approved by the Regional Committee for Medical Research Ethics (Regional komité for medisinsk forskningsetikk Sør-Øst, Norge, http://helseforskning.etikkom.no).
Case report
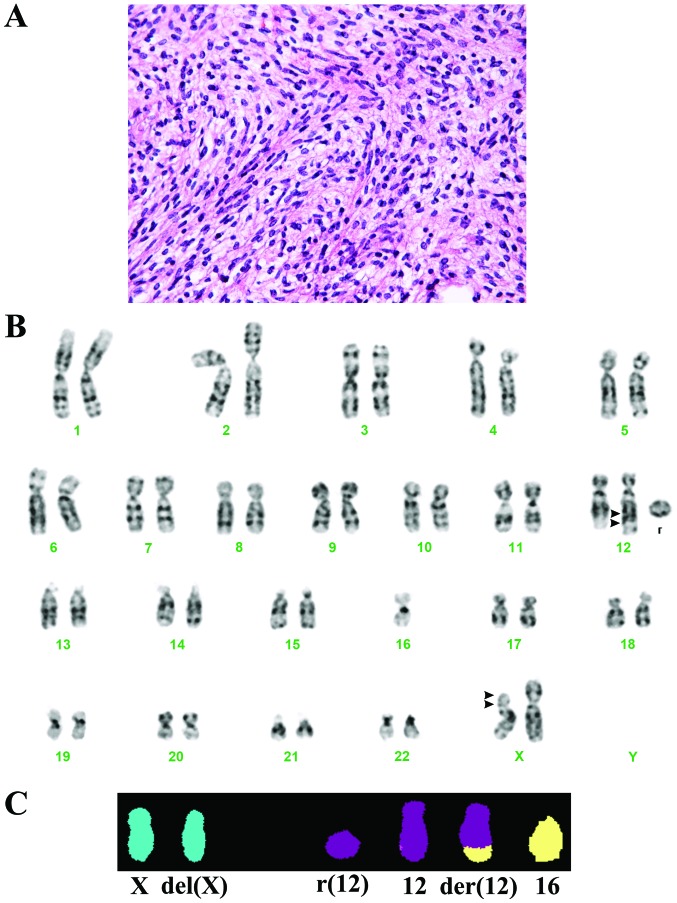
The patient was a 69-year-old woman who presented with right-sided chest pain and reduced general condition. Clinical and radiological work-up revealed a large tumor in the lower lobe of the right lung. No metastases were detected. After a needle biopsy, bilobectomy was performed and the tumor was removed with adequate margins. Macroscopic examination showed a well demarcated 11 cm large tumor. Microscopic examination disclosed a cellular tumor with spindle cells and some round cells with slight atypia surrounded by loose intercellular substance and some collagen (Fig. 1A). No atypical lipoblasts or pleomorphic cells were seen. There was no necrosis. The mitotic count was 8/10HPF and the French malignancy grade 2 (2). Immunohistochemical analysis showed negative staining for AE1/AE3, CK5/6, EMA, CD31, CD34, CD45, CD117, CD99, actin, smooth-muscle actin, desmin, h-caldesmon, calretinin, HM B-45 and protein S-100. RT-PCR was negative for gene fusions consistent with synovial sarcoma. The morphological picture and immunohistochemical findings were consistent with a spindle cell sarcoma not otherwise specified. No adjuvant therapy was administered. Two-and-a-half years after primary surgery a systemic relapse was diagnosed, with soft tissue metastases in the retroperitoneum and the large adductor muscle of the left thigh, a solitary lung metastasis in the right upper lobe, a tumor in the pancreatic head and bone metastases in the 7th lumbar vertebra and the left pubic bone. A core needle biopsy of the tumor in the left thigh confirmed the diagnosis of metastatic spindle cell sarcoma. No radiotherapy or systemic treatment was given, and the patient died 15 months later of metastatic disease.
Figure 1.
Microscopic examination, karyotype and M-FISH analyses of the primary tumor. (A) H&E-stained section of the tumor. (B) Karyotype at diagnosis showing the chromosome aberrations del(X)(p?11p?22), der(12)(12pter→12q?22::12q?15→q?22::16p11→16pter),−16 and r(12). (C) M-FISH showing that the del(X) chromosome does not contain material from other chromosomes, the ring chromosome is composed of chromosome 12 material and der(12) contains material from chromosome 16. Arrowheads indicate chromosome breakpoints.
G-banding, karyotyping and multicolor fluorescence in situ hybridization (mFISH)
A sample from the surgically removed primary tumor was mechanically and enzymatically disaggregated and short-term cultured as described elsewhere (12). The culture was harvested and the chromosomes G-banded using Wright stain. The subsequent cytogenetic analysis and karyotype description followed the recommendations of the ISCN (13). For multicolor FISH the 24XCyte Human Multicolor FISH Probe kit was used (MetaSystems-international, http://www.metasystems-international.com/) according to the manufacturer’s protocol. Fluorescent signals were captured and analyzed using the CytoVision system (Leica Biosystems, Newcastle, UK).
High-throughput paired-end RNA-sequencing
Tumor tissue adjacent to that used for cytogenetic analysis and histological examination had been frozen and stored at −80°C. Total RNA was extracted from both primary tumor and the metastasis in the left thigh using TRIzol reagent according to the manufacturer’s instructions (Life Technologies, Oslo, Norway) and its quality was checked by Experion Automated Electrophoresis System (Bio-Rad Laboratories, Oslo, Norway). Three micrograms of total RNA from the primary tumor were sent for high-throughput paired-end RNA-sequencing at the Genomics Core Facility, The Norwegian Radium Hospital (http://genomics.no/oslo/). The RNA was sequenced using an Illumina HiSeq 2500 instrument and the Illumina software pipeline was used to process image data into raw sequencing data. Only sequence reads marked as ‘passed filtering’ were used in the downstream data analysis. A total of 120 million reads were obtained. The software FusionMap (release date 2012-04-16) and the associated pre-built Human B37 and RefGene from the FusionMap website (http://www.omicsoft.com/fusionmap/) were used for the discovery of fusion transcripts (14).
Polymerase chain reaction
The primers used for PCR amplification and sequencing are listed in Table I. For Reverse Transcriptase-Polymerase Chain Reaction (RT-PCR), 1 μg of total RNA from both primary tumor and the metastasis was reverse-transcribed in a 20-μl reaction volume using iScript Advanced cDNA Synthesis kit for RT-qPCR according to the manufacturer’s instructions (Bio-Rad). The cDNA was diluted to 50 μl and 2 μl were used as templates in subsequent PCR assays. The 25 μl PCR-volume contained 12.5 μl of Premix Taq (Takara Bio Europe/SAS, Saint-Germain-en-Laye, France), 2 μl of diluted cDNA and 0.4 μM of each of the forward and reverse primers. The PCRs were run on a C-1000 Thermal cycler (Bio-Rad). The PCR conditions were: an initial denaturation at 94°C for 30 sec followed by 35 cycles of 7 sec at 98°C and 2 min at 68°C, and a final extension for 5 min at 68°C. The following primer sets were used to detect the fusion transcripts: PTGES3-416F1/PTPRB-1610R1 for (PTGES3-PTPRB), HM GA2-982F1/DYRK2-733R1 for (HMGA2-DYRK2), TMBIM4-25F1/MSRB3-501R for (TMBIM4-MSRB3) and USP15-655F1/CNTN1-413R for (USP15-CNTN1).
Table I.
Primers used for PCR amplification and sequencing.
| Oligo name | Sequence (5′→3′) |
|---|---|
| PTGES3-416F1 | CTC GG A GG A AGT GAT AAT TTT AAG C |
| PTPRB-1610R1 | CTG TAG CCA TGT ATT TTC GTC CAG |
| HMGA2-982F1 | CAA GAG TCC CTC TAA AGC AGC TCA |
| DYRK2-733R1 | CCG TTT TGC CCA CTG TTG TAA G |
| DYRK2-709R1 | GCC CAT TTG GTT GTG TCG TGA GCA C |
| DYRK2-651R | TTG AAC CTG GAT CTG TCC GTG AGC G |
| TMBIM4-25F1 | AGG AGG CGG TTG CGG TTA GTG |
| MSRB3-501R | TTT CCA CCC TGT GCA TCC CAT AG |
| USP15-655F1 | CCA GAC AGC ACC ATT CAG GAT GC |
| CNTN1-413R | CTG GCT CGT GCC CTA CAG TTG AGT |
| PTGES3-Int4-F1New | CCT TGG TCA GAA ACG GAG CTG GTC AA |
| PTGES3-Int4-F2New | AAT GCT TGC TGC ACT CCA GCC TGG |
| PTPRB-1602R | CCA TGT ATT TTC GTC CAG GCA CCA GG |
| PTPRB-1490R | TCC CAT TCT GCT ACA GG GTC TGC C |
| HMGA2-Int4-F1 | CCT CTG CAC TGT TGG CAA GAG CAG C |
| HMGA2-Int4-F2 | CGA TTG AGC GTC ATG GCT GTG CC |
| TMBIM4-55F1New | CGG TAG GGG TGC TGT TGC CAT CAT G |
| TMBIM4-121F1New | CGA CTT CAA CTA TGG CAG CAG CGT GG |
| MSRB3-350R1New | TGC AGT CTC ACT GTG CTT CCA CAG CTG A |
| MSRB3-261R1New | ACC ACG GTG GCC ATC TGG CTT ATG TC |
For the detection of the genomic hybrid fragments, extra-long PCR (XL PCR) was carried out using the XL PCR kit (Applied Biosystems, Life Technologies). XL PCR was performed in 50 μl of 1:3 diluted 3.3X XL buffer II, 1.1 mM Mg(OAc)2, 0.2 mM of each dNTP, 1 unit of rTth DNA polymerase, XL, 0.4 μM of each of the forward and reverse primers (Table I) and 300 ng tumor DNA (or 2 μl of the first PCR in nested PCR). After an initial denaturation for 1 min at 94°C, 32 cycles of 15 sec at 94°C and 10 min at 68°C were run followed by a final extension for 10 min at 72°C. For the detection of genomic PTGES3-PTPTRB fusion DNA fragment, the primers PTGES3-Int4-F1New and PTTRB-1602R were used. For possible genomic HMGA2-DYRK2 and TMBIM4-MSRB3, nested XL PCR was performed. For genomic HMGA2-DYRK2 amplification, the primers HMG A2-Int4-F1/DYRK2-709R1 and HMG A2-Int4-F2/DYRK2-651R were used for first and nested PCR, respectively. For genomic TMBIM4-MSRB3 amplification, the primers TMBIM4-55F1New/MSRB3-350R1New and TMBIM4-121F1New/MSRB3-261R1New were used for first and nested PCR, respectively.
Four microliters of the PCR products were stained with GelRed (Biotium, Hayward, CA, USA), analyzed by electrophoresis through 1.0% agarose gel and photographed. The amplified fragments were excised from the gel, purified using the Qiagen gel extraction kit (Qiagen), and direct sequencing (Sanger sequencing) was performed using the light run sequencing service of GATC Biotech (http://www.gatc-biotech.com/en/sanger-services/lightrun-sequencing.html). The BLAST software (http://blast.ncbi.nlm.nih.gov/Blast.cgi) was used for computer analysis of sequence data.
MDM2 amplification
Genomic tumor DNA was extracted from both primary tumor and metastasis paraffin-embedded samples using QIAamp DNA FFPE Tissue kit as recommended by the manufacturer (Qiagen, Hilden, Germany). Real-time PCR was performed using the ABI PRISM® 7900HT Sequence Detection System (Life Technologies, Carlsbad, CA). Primers and probes for MDM2 (on 12q15), CDK4 (on 12q14.1) and ALB (on 4q13.3, reference gene) were as described by Hostein et al (15). PCR amplification was performed in duplicates in 25 μl reaction volume containing 12 ng of genomic DNA, 300 nM of each primer, 100 nM of the probe and Ix TaqMan Universal PCR Master Mix (Life Technologies). For the amplification of ALB, MgCl2 was added to a final concentration of 400 nM. The gene copy numbers were calculated from standard curves constructed by amplification of normal blood DNA of the target genes MDM2 and CDK4 and the reference gene ALB. The level of amplification was determined as copy number of target gene (MDM2 or CDK4)/copy number of reference gene (ALB). A pool of six paraffin-embedded lipomas (confirmed by karyotyping) was used as normal control and the osteosarcoma cell line SJSAI (ATCC CRL-2098) as a positive control cell line.
Results
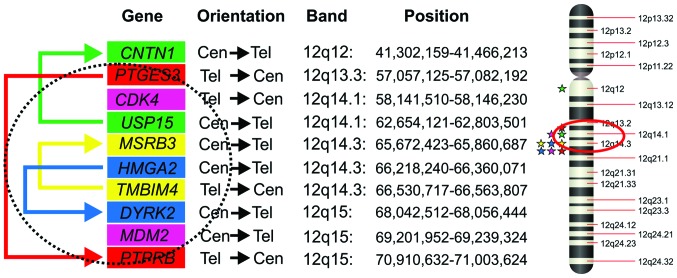
The G-banding and M-FISH analyses yielded the karyotype 46,X,del(X)(p?11p?22), der(12)(12pter→12q?22::12q?15→q? 22::16p11→16pter),−16,+r(12)[23] (Fig. 1B and C). Using the FusionMap on the raw RNA sequencing data, approximately 500 potential fusion genes were found (data not shown). The PTGES3-PTPRB, HMGA2-DYRK2, USP15-CNTN1 and TMBIM4-MSRB3 fusion transcripts were ranked 1st with 60 seed counts, 3rd with 27 seed counts, 4th with 26 seed counts and 5th with 22 seed counts, respectively. We decided to investigate further these fusion genes in materials obtained from both the primary tumor and the metastasis because: i) all the partner genes in the above-mentioned fusion transcripts map to the q arm of chromosome 12 (Fig. 2) and ii) the karyotype of the primary tumor had a ring chromosome composed of chromosome 12 material and a translocation involving chromosomes 12 and 16. A potential read through sequence, C10orf68-CCDC7, ranked 2nd with 50 seed counts, was not further studied.
Figure 2.
Diagram showing the genes involved in the fusions on the q arm of the chromosome 12, their orientations, locations and positions. The CDK4 and MDM2 genes are also included. The physical positions and the orientations of the genes are obtained from UCSC Genome Browser website (http://genome-euro.ucsc.edu/index.html) and they are based on the Human genome assembly of February 2009 (GRCh37/hg19). The colored arrows show the four fusion genes. The circle suggests a possible ring chromosome which leaves outside the CNTN1 gene. This ring chromosome closes between PTGES3 and PTPRB and would contain the PTGES3-PTPRB, HMGA2-DYRK2 and TMBIM4-MSRB3 as well as CDK4 and the amplified MDM2. Stars indicate positions of the partner fusion genes on chromosome 12, the CDK4 and MDM2 genes.
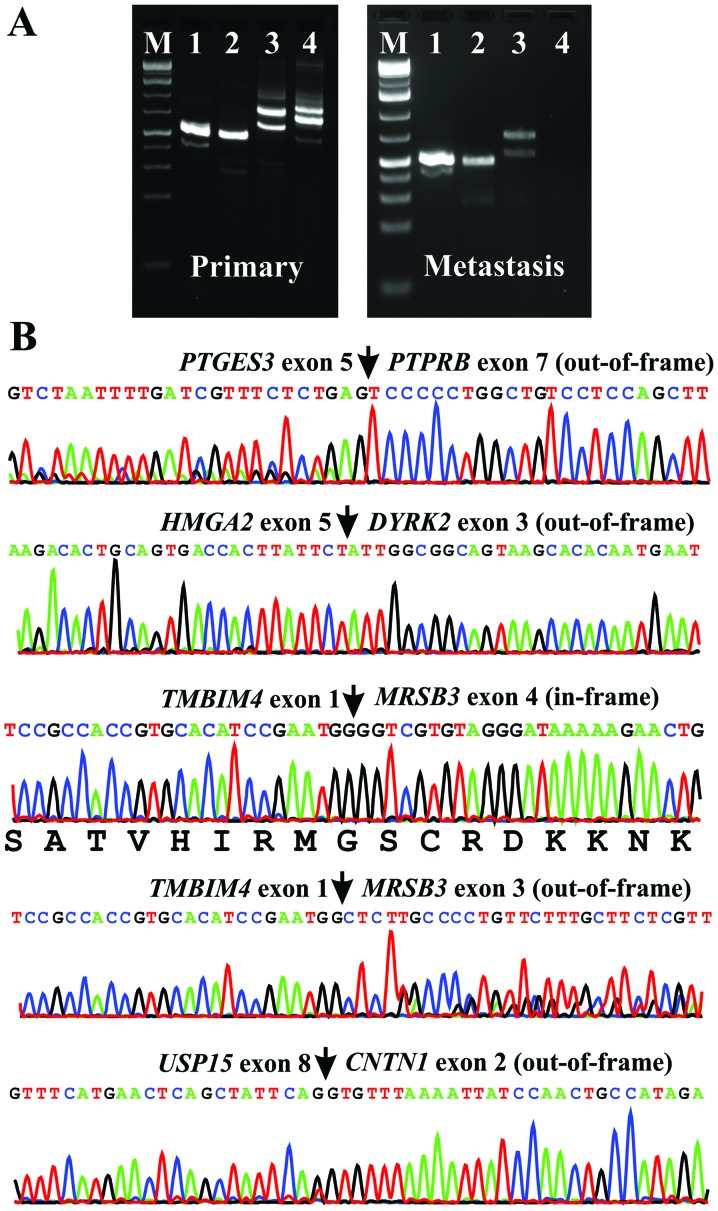
RT-PCR using cDNA from the primary tumor and subsequent direct Sanger sequencing verified the presence of PTGES3-PTPRB, HMGA2-DYRK2, TMBIM4-MSRB3 and USP15-CNTN1 chimeric transcripts (Fig. 3). PCR analysis of the metastasis amplified the fusion transcripts PTGES3-PTPRB, HMGA2-DYRK2 and TMBIM4-MSRB3 but not USP15-CNTN1 (Fig. 3A). Sanger sequencing of the amplified products from the metastasis showed that they were identical to those amplified from the primary tumor.
Figure 3.
RT-PCR and Sanger sequencing of the PCR products. (A) Amplification of PTGES3-PTPRB (lane 1), HMGA2-DYRK2 (lane 2), TMBIM4-MSRB3 (lane 3) and USP15-CNTN1 (lane 4) DNA fragments using cDNA from the primary tumor and metastasis. M, 1 Kb DNA ladder (GeneRuler, Fermentas). (B) Partial sequence chromatograms of the cDNA amplified fragment showing the junction position of the two partner genes in the PTGES3-PTPRB, HMGA2-DYRK2, two transcripts of TMBIM4-MSRB3 and USP15-CNTN1 fusion genes.
XL PCR using the primers PTGES3-Int4-F1New and PTPRB-1602R amplified a genomic DNA fragment (Fig. 4A) that was a chimeric PTGES3-PTPRB genomic DNA with the breakpoints located in intron 5 of PTGES3 and intron 8 of PTPRB (Fig. 4B). XL PCR for amplification of genomic breakpoints of HMGA2-DYRK2 and TMBIM4-MSRB3 with the primers given above did not amplify any products (Fig. 4A). XL PCR with additional primer sets failed to amplify genomic hybrid HMGA2-DYRK2 and TMBIM4-MSRB3 fragments (data not shown).
Figure 4.
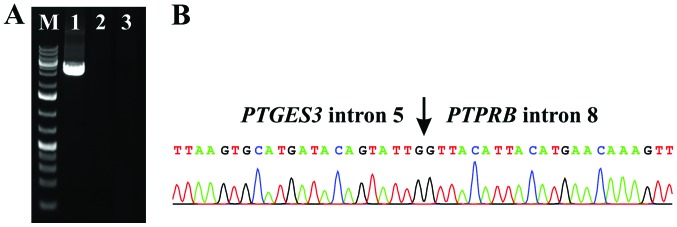
Extra-long-PCR for the genomic amplification of PTGES3-PTPRB, HMGA2-DYRK2 and TMBIM4-MSRB3 fusion DNA fragments. (A) Amplification of a genomic DNA fragment using the primers PTGES3-Int4-F1New and PTPRB-1602R DNA (lane 1). No HMGA2-DYRK2 (lane 2) and TMBIM4-MSRB3 (lane 3) genomic DNA fragments could be amplified. M, 1 Kb DNA ladder (GeneRuler, Fermentas). (B) Partial sequence chromatograms of the amplified DNA which showed that this fragment was a chimeric PTGES3-PTPRB genomic DNA. The breakpoints were located in intron 5 of PTGES3 and intron 8 of PTPRB.
In the primary tumor, the copy number of MDM2 was 17.2 whereas the copy number of CDK4 was 2.2 (Fig. 5). In the metastasis, the copy number was 11.4 and 2.4 for MDM2 and CDK4, respectively. The gene copy number (mean levels) of lipoma was 0.8 and 0.9 for MDM2 and CDK4, respectively.
Figure 5.
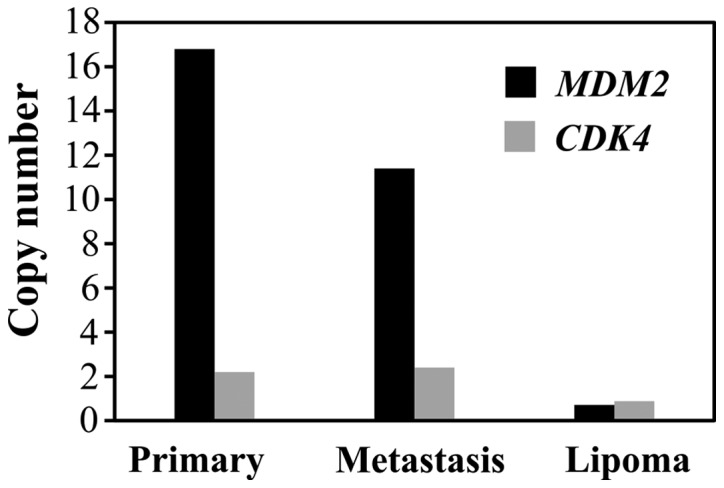
MDM2 and CDK4 amplification in the primary tumor, the metastasis and the control lipoma. In the primary tumor, the copy number of MDM2 was 17.2 while the copy number of CDK4 was 2.2. In the metastasis the copy number was 11.4 and 2.4 for MDM2 and CDK4, respectively. MDM2 and CDK4 were not amplified in lipomas. The mean level for lipomas was 0.8 and 0.9 for MDM2 and CDK4, respectively.
Discussion
The spindle cell sarcoma we describe had a ring chromosome composed of material from chromosome 12. The molecular studies of primary tumor and metastatic cells showed both amplification of MDM2 and several fusion genes (four - PTGES3-PTPRB, HMGA2-DYRK2, TMBIM4-MSRB3 and USP15-CNTN1 in the primary tumor, whereas the first three, but not USP15-CNTN1 were present also in the metastasis), all of them located on 12q (Fig. 2). This suggests that USP15-CNTN1 was not expressed or was absent in the metastasis. MDM2 amplification and the fusion transcripts PTGES3-PTPRB, HMGA2-DYRK2, TMBIM4-MSRB3 were found both in the primary tumor and the metastasis examined, showing that the same clone set up these two tumor lesions. Which molecular change is the primary, or most primary, cannot be deduced from the data, but a role in initiation and/or progression is possible and indeed likely. The multiple copies of MDM2 are not only correlated with the occurrence of ring chromosomes (16) but are located on the rings (17,18). It is reasonable to assume that in the present tumor both MDM2 amplification and the fusion genes PTGES3-PTPRB, HMGA2-DYRK2, TMBIM4-MSRB3 and USP15-CNTN1 are located on the ring chromosome (Fig. 2) although lack of suitable material prevented us from determining this with certainty. The absence of USP15-CNTN1 in the metastasis could reflect the instability of ring chromosomes. In the course of tumor progression, the ring(s) may break and re-join to form new rings. Thus, the rings in daughter cells can be different from each other and from the ring of the mother cell (19).
With exception of HMGA2 and its multiple fusion genes in neoplasia (http://cgap.nci.nih.gov/Chromosomes/MSearchForm), none of the other three fusion genes we detected have been reported before in cancer (http://cgap.nci.nih.gov/Chromosomes/MSearchForm). The fusion transcripts are all out-of frame except one of the two alternative splicing transcripts of TMBIM4-MRSB3 (Fig. 3). This suggests that the fusions play a role in the expression and/or regulation of genes by swapping promoter or 3′-untranslated region (UTR) and not by the formation of fusion proteins.
In HMGA2-DYRK2 the fusion of HMGA2 with DYRK2 occurs at exon 5, 80 bp after the stop codon (position 1221 in sequence with accession number NM_003483.4) and exon 3 of DYRK2 (position 601 in sequence with accession number NM_006482.2 or the position 452 of sequence with accession number NM_003583). Thus, only one of the eight Let-a target sites of the HMGA2 3′-UTR is present in the HMGA2-DYRK2 fusion transcript (the one in position 1169 in sequence with accession number NM_003483.4) (20). DYRK2 belongs to a family of protein kinases whose members are presumed to be involved in cellular growth and/or development. The family is defined by structural similarity of their kinase domains and their capacity to autophosphorylate on tyrosine residues. DYRK2 has demonstrated tyrosine autophosphorylation and catalyzed phosphorylation of histones H3 and H2B in vitro (http://www.ncbi.nlm.nih.gov/nuccore/Nm_006482). In the HMGA2-DYRK2 fusion transcript, the part of DYRK2 coding the entire isoform 1 of DYRK2 protein (accession number NP_003574.1) is also present. It is therefore possible that the entire protein-encoding moiety of DYRK2 is expressed either alone or as part of a bicistronic transcript encoding both HM GA2 and DYRK2 proteins under the influence of the HMGA2 promoter. Bicistronic transcripts encoding two independent proteins have been reported in humans (21,22), and a bicistronic CCND1-TROP2 mRNA chimera was even shown to have an oncogenic role in human cancer (23). The chimeric CCND1-TROP2 mRNA, which independently translates both the cyclin D1 and TROP2 proteins, was isolated from human ovarian and mammary cancer cells and was found to be expressed in gastrointestinal, ovarian and endometrial tumors (23).
In PTGES3-PTPRB, the fusion of PTGES3 with PTPRB occurs on exon 5 (position 670 in the sequence with accession number NM_006601.5) and exon 7 of PTPRB (position 1427 in the sequence with accession number NM_002837.4). PTGES3 functions as a chaperone which is required for proper function of the glucocorticoid and other steroid receptors (http://en.wikipedia.org/wiki/PTGES3). PTPRB is a member of the protein tyrosine phosphatase (PTP) family. PTPs are signaling molecules that regulate a variety of cellular processes including cell growth, differentiation, mitotic cycle and oncogenic transformation. This PTP belongs to the receptor type PTP and contains an extracellular domain, a single transmembrane segment, and an intracytoplasmic catalytic domain (http://en.wikipedia.org/wiki/PTPRB). The chimeric PTGES3-PTPRB transcript contains the part of PTGES3 which codes for the putative Hsp90 binding site (conserved domain cd00237) and the part of PTPRB which catalyzes the dephosphorylation of phosphotyrosine peptides (conserved domain cd00047). The translation of a hypothetical bicistronic PTGES3-PTPRB fusion transcript would result in the production of two independent PTGES3 and PTPRB proteins with the above-mentioned functional domains.
The MRSB3 gene codes for a protein which catalyzes the reduction of methionine sulphoxide to methionine (http://www.ncbi.nlm.nih.gov/gene/253827). This enzyme acts as a monomer and requires zinc as a cofactor. Four transcript variants have been identified encoding two different isoforms of the MRSB3 protein. Transcript variant 1 (accession number NM_198080) encodes the longer isoform 1 of MRSB3 and is found in the endoplasmic reticulum (ER), whereas transcript variants 2, 3 and 4 encode the same isoform 2 variant of MRSB3 which has shorter and distinct N-terminus compared to isoform 1 and is found primarily in mitochondria (24).
The result of TMBIM4-MRSB3 fusion is that the expression of MRSB3 comes under the control of the TMBIM4 promoter. In the out-of-frame TMBIM4-MRSB3 fusion transcript in which exon 1 of TMBIM4 (nt 173 in the sequence with accession number NM_016056.2) is fused to exon 3 of MSRB3 (nt 388 in the sequence with accession number NM_001193460.1), the result would be the production of the isoform 2 variant of MRSB3 which is localized to mitochondria. In the in-frame TMBIM4-MRSB3 fusion transcript in which exon 1 of TMBIM4 (nt 173 in the sequence with accession number NM_016056.2) is fused to exon 4 of MSRB3 (nt 515 in the sequence with accession number NM_001193460.1), the result would be a chimeric TMBIM4-MRSB3 protein in which the first 32 amino acids of MRSB3 (MSPRRTLPRPLSLCLSLCLCLCLAAA LG SAQS) are replaced by the first 32 amino acids of TMBIM4 (MADPDPRYPRSSIEDDFNYGSSVASATVHIRM).
In a recent study, Nord et al (11) divided ring chromosomes in neoplastic cells into those with MDM2 amplification and those without MDM2 amplification. The amplification of MDM2 is associated with co-amplification of a variety of potential driver oncogenes. Here we show that MDM2 amplification may be associated with a variety of fusion genes. The sequence in which the various genetic events occur cannot be determined. The fact that both MDM2 amplification and the fusion genes are found in both the primary tumor and metastasis indicate, however, that both play a role in tumorigenesis.
Acknowledgements
The authors thank Kristin Andersen for her technical help. This study was supported by grants from the Norwegian Cancer Society.
References
- 1.Collini P, Sorensen PH, Patel S, et al. Sarcomas with spindle cell morphology. Semin Oncol. 2009;36:324–337. doi: 10.1053/j.seminoncol.2009.06.007. [DOI] [PubMed] [Google Scholar]
- 2.Fletcher CD, Bridge JA, Hogendoorn P, Mertens F. WHO Classification of Tumours of Soft Tissue and Bone. 4th edition. IARC; Lyon: 2013. [Google Scholar]
- 3.Heim S, Mitelman F. Cancer Cytogenetics. 3rd edition. Wiley-Blackwell; New York: 2009. [Google Scholar]
- 4.Sirvent N, Maire G, Pedeutour F. Genetics of dermatofibrosarcoma protuberans family of tumors: from ring chromosomes to tyrosine kinase inhibitor treatment. Genes Chromosomes Cancer. 2003;37:1–19. doi: 10.1002/gcc.10202. [DOI] [PubMed] [Google Scholar]
- 5.Chmielecki J, Crago AM, Rosenberg M, et al. Whole-exome sequencing identifies a recurrent NAB2-STAT6 fusion in solitary fibrous tumors. Nat Genet. 2013;45:131–132. doi: 10.1038/ng.2522. [DOI] [PMC free article] [PubMed] [Google Scholar]
- 6.Robinson DR, Wu YM, Kalyana-Sundaram S, et al. Identification of recurrent NAB2-STAT6 gene fusions in solitary fibrous tumor by integrative sequencing. Nat Genet. 2013;45:180–185. doi: 10.1038/ng.2509. [DOI] [PMC free article] [PubMed] [Google Scholar]
- 7.Eyden BP, Banerjee SS, Harris M, Mene A. A study of spindle cell sarcomas showing myofibroblastic differentiation. Ultrastruct Pathol. 1991;15:367–378. doi: 10.3109/01913129109016246. [DOI] [PubMed] [Google Scholar]
- 8.Fletcher CD, Dal Cin P, de Wever I, et al. Correlation between clinicopathological features and karyotype in spindle cell sarcomas. A report of 130 cases from the CHAMP study group. Am J Pathol. 1999;154:1841–1847. doi: 10.1016/S0002-9440(10)65441-7. [DOI] [PMC free article] [PubMed] [Google Scholar]
- 9.Alaggio R, Rosolen A, Sartori F, et al. Spindle cell tumor with EWS-WT1 transcript and a favorable clinical course: a variant of DSCT, a variant of leiomyosarcoma, or a new entity? Report of 2 pediatric cases. Am J Surg Pathol. 2007;31:454–459. doi: 10.1097/01.pas.0000213375.02171.43. [DOI] [PubMed] [Google Scholar]
- 10.Lestou VS, O’Connell JX, Ludkovski O, Gosling H, Lesack D, Horsman DE. Coamplification of 12p11 and 12q13 approximately q22 in multiple ring chromosomes in a spindle cell sarcoma resolved by novel multicolor fluorescence in situ hybridization analysis. Cancer Genet Cytogenet. 2002;139:44–47. doi: 10.1016/s0165-4608(02)00600-3. [DOI] [PubMed] [Google Scholar]
- 11.Nord KH, Macchia G, Tayebwa J, et al. Integrative genome and transcriptome analyses reveal two distinct types of ring chromosome in soft tissue sarcomas. Hum Mol Genet. 2014;23:878–888. doi: 10.1093/hmg/ddt479. [DOI] [PubMed] [Google Scholar]
- 12.Mandahl N. Methods in solid tumour cytogenetics. In: Rooney DE, editor. Human Cytogenetics: Malignancy and Acquired Abnormalities. Oxford University Press; New York: 2001. pp. 165–203. [Google Scholar]
- 13.Schaffer LG, Slovak ML, Campbell LJ, editors. ISCN 2009: An International System for Human Cytogenetic Nomenclature. Karger; Basel: 2009. [Google Scholar]
- 14.Ge H, Liu K, Juan T, Fang F, Newman M, Hoeck W. FusionMap: detecting fusion genes from next-generation sequencing data at base-pair resolution. Bioinformatics. 2011;27:1922–1928. doi: 10.1093/bioinformatics/btr310. [DOI] [PubMed] [Google Scholar]
- 15.Hostein I, Pelmus M, Aurias A, Pedeutour F, Mathoulin-Pelissier S, Coindre JM. Evaluation of MDM2 and CDK4 amplification by real-time PCR on paraffin wax-embedded material: a potential tool for the diagnosis of atypical lipomatous tumours/well-differentiated liposarcomas. J Pathol. 2004;202:95–102. doi: 10.1002/path.1495. [DOI] [PubMed] [Google Scholar]
- 16.Nilbert M, Rydholm A, Willen H, Mitelman F, Mandahl N. MDM2 gene amplification correlates with ring chromosome in soft tissue tumors. Genes Chromosomes Cancer. 1994;9:261–265. doi: 10.1002/gcc.2870090406. [DOI] [PubMed] [Google Scholar]
- 17.Gisselsson D, Höglund M, Mertens F, Mitelman F, Mandahl N. Chromosomal organization of amplified chromosome 12 sequences in mesenchymal tumors detected by fluorescence in situ hybridization. Genes Chromosomes Cancer. 1998;23:203–212. doi: 10.1002/(sici)1098-2264(199811)23:3<203::aid-gcc1>3.0.co;2-5. [DOI] [PubMed] [Google Scholar]
- 18.Pedeutour F, Forus A, Coindre JM, et al. Structure of the supernumerary ring and giant rod chromosomes in adipose tissue tumors. Genes Chromosomes Cancer. 1999;24:30–41. [PubMed] [Google Scholar]
- 19.Gisselsson D, Pettersson L, Höglund M, et al. Chromosomal breakage-fusion-bridge events cause genetic intratumor heterogeneity. Proc Natl Acad Sci USA. 2000;97:5357–5362. doi: 10.1073/pnas.090013497. [DOI] [PMC free article] [PubMed] [Google Scholar]
- 20.Lee YS, Dutta A. The tumor suppressor microRNA let-7 represses the HM GA2 oncogene. Genes Dev. 2007;21:1025–1030. doi: 10.1101/gad.1540407. [DOI] [PMC free article] [PubMed] [Google Scholar]
- 21.Gray TA, Saitoh S, Nicholls RD. An imprinted, mammalian bicistronic transcript encodes two independent proteins. Proc Natl Acad Sci USA. 1999;96:5616–5621. doi: 10.1073/pnas.96.10.5616. [DOI] [PMC free article] [PubMed] [Google Scholar]
- 22.Ritchie H, Wang LH. A mammalian bicistronic transcript encoding two dentin-specific proteins. Biochem Biophys Res Commun. 1997;231:425–428. doi: 10.1006/bbrc.1997.6126. [DOI] [PubMed] [Google Scholar]
- 23.Guerra E, Trerotola M, Dell’Arciprete R, et al. A bicistronic CYCLIN D1-TROP2 mRNA chimera demonstrates a novel oncogenic mechanism in human cancer. Cancer Res. 2008;68:8113–8121. doi: 10.1158/0008-5472.CAN-07-6135. [DOI] [PubMed] [Google Scholar]
- 24.Kim HY, Gladyshev VN. Methionine sulfoxide reduction in mammals: characterization of methionine-R-sulfoxide reductases. Mol Biol Cell. 2004;15:1055–1064. doi: 10.1091/mbc.E03-08-0629. [DOI] [PMC free article] [PubMed] [Google Scholar]


