

Abstract
A genome-wide association study (GWAS) of bladder cancer identified a genetic marker rs8102137 within the 19q12 region as a novel susceptibility variant. This marker is located upstream of the CCNE1 gene, which encodes cyclin E, a cell cycle protein. We performed genetic fine mapping analysis of the CCNE1 region using data from two bladder cancer GWAS (5,942 cases and 10,857 controls). We found that the original GWAS marker rs8102137 represents a group of 47 linked SNPs (with r2≥0.7) associated with increased bladder cancer risk. From this group we selected a functional promoter variant rs7257330, which showed strong allele-specific binding of nuclear proteins in several cell lines. In both GWAS, rs7257330 was associated only with aggressive bladder cancer, with a combined per-allele odds ratio (OR) =1.18 (95%CI=1.09-1.27, p=4.67×10⁻⁵ vs. OR =1.01 (95%CI=0.93-1.10, p=0.79) for non-aggressive disease, with p=0.0015 for case-only analysis. Cyclin E protein expression analyzed in 265 bladder tumors was increased in aggressive tumors (p=0.013) and, independently, with each rs7257330-A risk allele (ptrend=0.024). Over-expression of recombinant cyclin E in cell lines caused significant acceleration of cell cycle. In conclusion, we defined the 19q12 signal as the first GWAS signal specific for aggressive bladder cancer. Molecular mechanisms of this genetic association may be related to cyclin E over-expression and alteration of cell cycle in carriers of CCNE1 risk variants. In combination with established bladder cancer risk factors and other somatic and germline genetic markers, the CCNE1 variants could be useful for inclusion into bladder cancer risk prediction models.
Keywords: Aggressive bladder cancer, cyclin E, cell cycle, single nucleotide polymorphism, GWAS
Introduction
Bladder cancer is the sixth most common cancer in the United States, with an estimated 72,570 new cases and 15,210 deaths in 2013 (1). At presentation, bladder cancer is classified into non-muscle-invasive (NMIBC), muscle-invasive (MIBC), or metastatic disease. Most of bladder cancer cases present as NMIBC (70%), which are low or high-grade tumors with stages Ta, T1 or carcinoma in situ (TIS). Low-grade NMIBC (tumor stage Ta with grade G1/G2) has a high rate of recurrence but a low rate of progression to MIBC, while high-grade NMIBC (stage Ta with grade G3/G4, all stage T1 and TIS) has a high rate of recurrence and progression to MIBC (stage T2-T4 with any grade). Patients with NMIBC are treated by bladder-sparing therapies and require frequent expensive surveillance but the disease is not life-threatening. MIBC cases are primarily treated with surgical resection of the bladder (radical cystectomy) but 50% of patients still progress to incurable metastatic disease (2). Bladder cancer is considered a clinically heterogeneous disease, with low-grade NMIBC classified as non-aggressive and genomically stable, while high-grade NMIBC and MIBC classified as aggressive and genomically unstable (3, 4).
It is anticipated that some of the genetic markers discovered by genome-wide association studies (GWAS) will contribute to improved understanding of relationships between inherited susceptibility and molecular mechanisms of cancer and may become clinically useful for risk prediction models. Our recent study of bladder cancer (5) (NCI-GWAS1) performed in individuals of European ancestry, identified several novel susceptibility loci, including a single nucleotide polymorphism (SNP) rs8102137 within the 19q12 region. Of all bladder cancer GWAS signals reported to date (5-8), only rs8102137 has been specifically associated with risk of high-grade but not low-grade tumors (5).
The GWAS marker rs8102137 is located 6 Kb upstream of the CCNE1 gene, which encodes cyclin E, a cell cycle protein. As the only gene located within the associated linkage disequilibrium (LD) block, CCNE1 is a primary functional candidate gene for this GWAS signal. The cyclin E protein forms a complex with cyclin dependent kinase 2 (CDK2) and regulates the transition from G1 (preparation for DNA replication) to S (DNA synthesis) phase of cell cycle and further progression through S phase (9). Increased cyclin E expression is found in many tumor types, including breast, gastric, colorectal, ovarian, and bladder cancers (10). Cyclin E is a short-lived unstable protein quickly destroyed by proteolytic degradation (11). Therefore, its high protein expression must be sustained by increased mRNA expression, which can be affected by a number of factors, including somatic mutations, genomic amplifications (12) or germline genetic variants (13) within the CCNE1 region. However, somatic mutations of the CCNE1 gene were found only in 44 (0.49%) of 8,904 tumors of different types in the COSMIC database (14) and thus are unlikely to have significant effects on cyclin E function.
Here, we searched for germline genetic variants that could explain the initial GWAS signal within the 19q12 region and explored association of these variants with informative molecular phenotypes, such as CCNE1 mRNA and protein expression in bladder tissues.
Materials and Methods
Fine-mapping analysis
We used genotyping data from two bladder cancer GWAS conducted by the US National Cancer Institute. NCI-GWAS1 included 3,520 bladder cancer cases and 5,110 controls (5), and NCI-GWAS2 included 2,422 cases and 5,747 controls (15) (Supplementary Table 1). The use of GWAS data was approved by Ethic Committees of corresponding studies (5, 15). Imputation-based fine mapping of the ∼70Kb CCNE1 region (+/− 30 Kb around the CCNE1 gene, genomic coordinates GRCh37, chr19: 30,272,901-30,345,215) was performed using data from both NCI-GWAS as previously described (16), based on the 1000 Genomes Project data (phase 1 version 3, 2012 March revised) (17) using IMPUTE2 (18). We analyzed only well-imputed variants (IMPUTE2 info score ≥0.9) and exonic non-synonymous variants regardless of imputation score. Imputation results for rs7257330 were validated by TaqMan genotyping (assay C_32389893_20, Life Technologies) in 336 NCI-GWAS1 samples (99.4% concordance). Imputed genotypes of rs61750863 were tested by Sanger sequencing in 608 samples (Supplementary Table 3 for primers and Supplementary Table 7 for results).
Cell lines and tissue samples
Cell lines HeLa (cervical carcinoma) and HTB5 (bladder transitional carcinoma) cell lines were from the American Type Culture Collection (Manassas, VA). Cell lines were last authenticated in July 2014 by the DNA Diagnostic Center (DDC Medical, Fairfield, OH) based on genomic analysis of a panel of short tandem repeats (STRs) and comparison to ATCC STR Profile Database. Fresh-frozen bladder tissues (41 tumors and 40 adjacent normal samples) and 17 formalin-fixed paraffin embedded (FFPE) tumors (Supplementary Table 2) were purchased from Asterand (Detroit) after exemption #4715 provided by the NIH Office of Human Subjects Research (16).
mRNA expression and immunohistochemistry protein analyses
RNA-sequencing of bladder tumors and adjacent normal bladder tissue samples (Supplementary Materials and Methods) has been described (16). Quantitative reverse-transcriptase PCR (qRT-PCR) analysis of mRNA expression in fresh-frozen tissue samples was performed with TaqMan assays as described (Supplementary Table 3 and Supplementary Materials and Methods). Immunohistochemistry (IHC) analysis of bladder TMAs was performed as described (19, 20). A pilot custom tissue microarray (TMA) included 8 normal-tumor bladder tissue pairs and additionally, 1 unpaired bladder tumor, and 3 prostate tumors (Asterand). Another TMA set of 265 samples included bladder tumors from patients from the New England Bladder Cancer Study, NEBCS (19, 20), with available GWAS data, stage and grade information and sufficient quantity and quality of tumor tissue. IHC was performed using standard polymer-based immunohistochemical methods using antibodies and conditions presented in Supplementary Table 3. Cyclin E staining was scored manually by a pathologist (P. L.) blinded to clinical and genotype information. Cyclin E nuclear staining was assessed as percentage of positive cells (0: negative, 1:<10%, 2:10-50%, 3:>50% of cells) and nuclear staining intensity (0: negative, 1: weak, 2: moderate, 3: strong). A combined cyclin E nuclear staining score ranging from 0 to 6 was a sum of the scores for nuclear positivity and intensity (Figure 5B).The cyclin E cytoplasmic expression was scored based on intensity only (0: negative, 1: weak, 2: moderate, 3: strong).
Figure 5. Immunohistochemistry (IHC) analysis of cyclin E expression in bladder tissues.
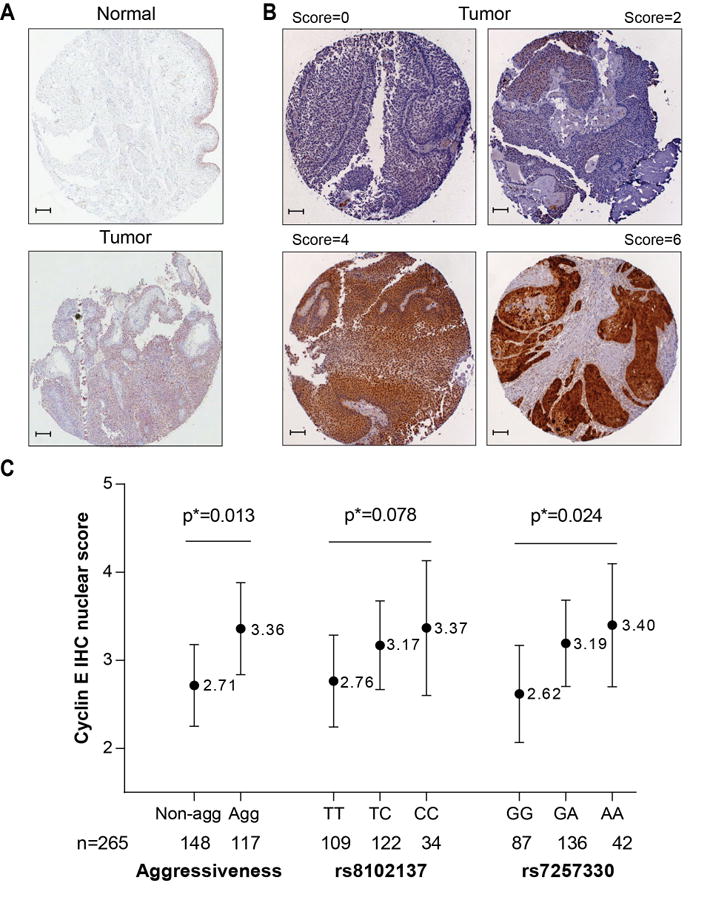
(A) Images of cyclin E expression in one pair of tumor-adjacent normal bladder tissue samples, representative of 8 pairs tested. Immunostaining was done with an anti-CCNE1 rabbit polyclonal antibody (HPA018169, Sigma, dilution 1:85). Images are presented at 10× magnification with 0.1 mm scale bars.
(B) Representative images of bladder tumors with nuclear cyclin E expression scores of 0, 2, 4 and 6, which is a sum of nuclear positivity (scored 0-3) and intensity (scored 0-3). The samples are a part of a TMA that includes 265 bladder tumors, immunostaining was done with an anti-CCNE1 rabbit monoclonal antibody (1655-1, Epitomics, dilution 1:250).
(C) Association between IHC cyclin E nuclear scores in 265 bladder tumors, bladder cancer aggressiveness and genotypes of rs8102137 and rs7257330. The scores are shown as least squares mean values with 95% confidence intervals, based on multivariable linear regression models assuming additive effects of SNPs, with adjustment for age, gender, two study sub-sites, smoking, and categories of tumor aggressiveness, when appropriate: non-aggressive and aggressive.
Statistical analysis
Association between imputed markers and bladder cancer risk was evaluated with SNPTEST v2 based on estimated allelic dosage from IMPUTE2. Per-allele odds ratios (ORs) and p-values were calculated adjusting for age, gender, smoking status (ever/never), study sites and main eigenvectors (EV1, EV5, and EV6) used in NCI-GWAS datasets to adjust for possible population stratification among the sub-studies. Residual association signals in the CCNE1 region were explored by conditioning on the original GWAS marker rs8102137 in the logistic regression models. Best-guessed genotypes of imputed markers with ≥0.9 probability were converted by GTOOL and used for calculation of linkage disequilibrium values (D' and r2) and for detailed stratified analyses. For final analysis bladder cancer aggressiveness was defined into 2 categories: the non-aggressive category included cases with low-grade NMIBC (Ta with G1/G2), and the aggressive category included cases with high-grade NMIBC (Ta with G3/G4 or any T1) and MIBC (all T2-T4) (Supplementary Table 4). Differences in effect sizes between the bladder cancer categories were evaluated in case-only analysis.
Differences in mRNA expression levels between bladder tumors and adjacent normal tissue samples were evaluated with unpaired Student's t-test. The association between CCNE1 mRNA expression and SNP genotypes was evaluated with multivariable linear regression models assuming additive genetic effects and adjusting for age and gender. The association between genotypes and IHC scores (0-6 scale) was evaluated by multivariable linear models assuming additive genetic effects, with adjustment for age, gender, study centers, smoking, and bladder cancer aggressiveness. Meta-analysis and forest plots were generated with STATA version 11 (StatCorp LP). All statistical tests were two-sided and conducted with SAS/STAT system version 9.2 (SAS Institute Inc.) unless otherwise specified. Graphs were plotted with Prism 6 software (GraphPad Inc.). All the tests were two-sided.
Functional assays
Electrophoretic mobility shift assays (EMSA), cloning of CCNE1 transcripts, cell cycle and protein interaction analysis are described in Supplementary Table 3 and Supplementary Materials and Methods.
Results
Genetic association of CCNE1 region with aggressive bladder cancer
Imputation in the combined GWAS set generated a list of 152 well-imputed markers in addition to the 13 GWAS-genotyped SNPs located within the CCNE1 region. Of these 165 SNPs, 46 markers were in strong (r2 ≥0.7) linkage disequilibrium (LD) with rs8102137 and comparably represented the original GWAS signal (Supplementary Table 5).
Within the group of 47 linked CCNE1 markers, we focused on a promoter SNP rs7257330, which has high correlation with rs8102137 (r2 =.77). This variant resides 1.1 Kb upstream of the CCNE1 transcription start site, within a genomic area with a uniquely strong histone H3 acetylation mark at Lysine 27 (H3K27Ac), a characteristic of active enhancers (21) (Figure 1). Experimental analysis of DNA-protein interactions using nuclear extracts from several human cell lines - HeLa (cervical carcinoma), J82 (bladder transitional carcinoma) and LNCaP (prostate cancer) - showed strong binding of the probe with risk rs7257330-A allele in all cell lines, while no binding was detected for the probe with non-risk rs7257330-G allele (Supplementary Figure 1A). Only a weak nonspecific interaction was detected for both alleles of the GWAS rs8102137 (Supplementary Figure 1B). Bioinformatic analysis predicted that rs7257330 alleles may bind a number of proteins (Supplementary Figure 1C) precluding experimental testing of all these predictions.
Figure 1. Genetic and genomic landscape of the CCNE1 region.
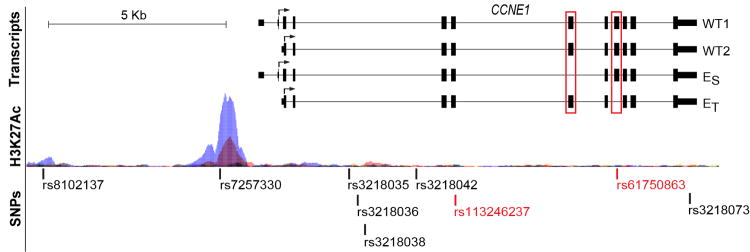
Genomic plot of the CCNE1 region is based on information from the UCSC browser (www.genome.ucsc.edu) and RNA-sequencing of 7 tumors and 5 adjacent normal bladder tissue samples. The plot shows the main CCNE1 transcripts detected by our RNA-sequencing – WT1, WT2, cyclin ES and cyclin ET. Alternative exons missing in forms cyclin ES and cyclin ET are marked by red boxes. Arrows indicate translation start sites and direction of protein synthesis. Genetic variants on the plot are coding non-synonymous CCNE1 variants (marked in red), GWAS marker rs8102137, promoter variant rs7257330, an ovarian cancer candidate variant rs3218036, and several variants previously associated with various cancers (Supplementary Table 7). Histone H3 Lysine 27 acetylation marks (H3K27Ac) in 7 cell lines are a part of ENCODE track presented by the UCSC browser.
For analysis of genetic association between CCNE1 variants and bladder cancer subtypes we used a classification based on the combined tumor stage and grade information (low and high-grade NMIBC and MIBC), which is more clinically relevant for treatment management than a classification restricted to tumor grade (low and high-grade tumors) that was used in NCI-GWAS1 (5). Both rs8102137 and rs7257330 showed stronger association in high-grade NIMBC and MIBC categories, compared to low-grade NIMBC (Figure 2). Due to incomplete tumor stage/grade information, this classification included 58% of all cases in our study (Supplementary Table 4). By combining the high-grade NIMBC and MIBC into one category of aggressive cancer and comparing it to non-aggressive category (low-grade NMIBC), we could classify 64% of all cases, maximizing power of the stratified analysis. It appears that both markers provided similar information for the susceptibility to aggressive bladder cancer as the OR for both markers were attenuated to a non-significant level after adjustment for each other (Supplementary Table 6). However, rs7257330 provided better discrimination between aggressive and non-aggressive groups (P = .0015) than rs8102137 (P = .013) in a case-only analysis, with similar patterns of association presented in both GWAS1 and GWAS2 (Table 1). Compared to patients not carrying the rs7257330-A allele (31.7%), patients carrying one (50.6%) or two (17.7%) alleles had 27% and 34% higher risk of presenting with aggressive bladder cancer, respectively (Table 2).
Figure 2. Forest plot for association of rs8102137 and rs7257330 in bladder cancer subgroups in the combined set of NCI-GWAS1 and NCI-GWAS2 samples.
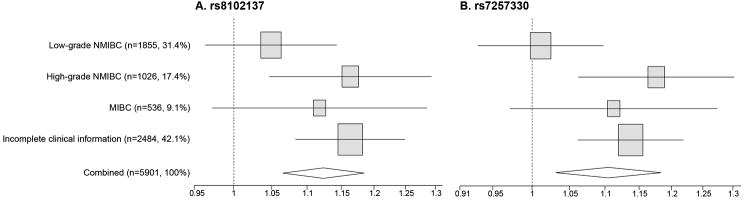
The plot shows allelic odds ratios and 95% confidence intervals for SNPs. Analysis was performed only on subjects with genotype information available for both SNPs, where rs8102137 was from actual genotyping in NCI-GWAS1 and NCI-GWAS2, and rs7257330 was converted from imputed allelic dosage with ≥ 90% probability and validated by TaqMan genotyping in a subset of samples. Bladder cancer sub-groups were defined in three categories (Supplementary Table 4): low-grade NMIBC (Ta with G1/G2), high-grade NMIBC (Ta with G3/G4 or all T1) and MIBC (all T2-T4)(3). Incomplete clinical information category includes cases with missing or incomplete tumor stage or grade data.
Table 1. Association of CCNE1 variants with the risk of bladder cancer stratified by bladder cancer aggressiveness.
| N (%)* | MAF§ | OR (95%CI)# | P# | Case-only P¶ | MAF§ | OR (95%CI)# | P# | Case-only P¶ | ||
|---|---|---|---|---|---|---|---|---|---|---|
|
| ||||||||||
| rs8102137 (T/C) | rs7257330 (G/A) | |||||||||
|
|
||||||||||
| GWAS1 | All controls | 5070 | 0.33 | 1.00 (referent) | - | - | 0.39 | 1.00 (referent) | - | - |
| All cases | 3494 | 0.36 | 1.13 (1.05-1.20) | 4.7×10⁻⁴ | - | 0.41 | 1.11 (1.04-1.18) | 0.0022 | - | |
| Non-aggressive | 1151 (32.9) | 0.34 | 1.07 (0.96-1.20) | 0.21 | 0.13 | 0.39 | 1.01 (0.91-1.13) | 0.80 | 0.031 | |
| Aggressive | 1288 (36.9) | 0.37 | 1.18 (1.07-1.30) | 8.8×10⁻⁴ | 0.43 | 1.17 (1.07-1.29) | 8.4×10⁻⁴ | |||
| Missing | 1055 (30.2) | - | - | - | - | - | - | - | - | |
| GWAS2 | All controls | 5703 | 0.32 | 1.00 (referent) | - | - | 0.38 | 1.00 (referent) | - | - |
| All cases | 2407 | 0.35 | 1.11 (1.02-1.21) | 0.022 | - | 0.41 | 1.10 (1.01-1.19) | 0.026 | - | |
| Non-aggressive | 704 (29.3) | 0.33 | 1.00 (0.87-1.15) | 0.97 | 0.045 | 0.39 | 1.00 (0.87-1.14) | 1.00 | 0.027 | |
| Aggressive | 628 (26.1) | 0.37 | 1.16 (1.00-1.34) | 0.046 | 0.43 | 1.17 (1.01-1.34) | 0.031 | |||
| Missing | 1075 (44.7) | - | - | - | - | - | - | - | - | |
| GWAS1+2 | All controls | 10773 | 0.32 | 1.00 (referent) | - | - | 0.39 | 1.00 (referent) | - | - |
| All cases | 5901 | 0.35 | 1.13 (1.07-1.19) | 8.6×10⁻⁶ | - | 0.41 | 1.11 (1.06-1.17) | 6.0×10⁻⁵ | - | |
| Non-aggressive | 1855 (31.4) | 0.33 | 1.05 (0.96-1.14) | 0.27 | 0.013 | 0.39 | 1.01 (0.93-1.10) | 0.79 | 0.0015 | |
| Aggressive | 1916 (32.5) | 0.37 | 1.18 (1.09-1.28) | 5.6×10⁻⁵ | 0.43 | 1.18 (1.09-1.27) | 4.7×10⁻⁵ | |||
| Missing | 2130 (36.1) | |||||||||
Analysis was performed only on subjects with genotype information available for both SNPs, where rs8102137 was from actual genotyping in NCI-GWAS1 and NCI-GWAS2, and rs7257330 was converted from imputed allelic dosage with ≥90% probability. Bladder cancer aggressiveness was defined in two categories: the non-aggressive category included cases with stage Ta with grade G1/G2 tumors, the aggressive category included cases with stage T1-T4 or grade G3/G4 tumors, missing category includes cases with missing or incomplete tumor stage and grade information.
MAF: minor alleles frequency, for rs8102137-C allele and rs7257330-A allele.
P-values for estimates from multivariable logistic regression models assuming log-additive genetic effects, adjusting for age, gender, study sites, smoking status and top eigenvectors (EV1, EV5, EV6) from principal component analysis of NCI-GWAS datasets.
P-values from case-only analyses for differences of effect sizes between bladder cancer aggressiveness categories, assuming log-additive genetic effect.
MAF – minor allele frequency; OR – odds ratio, CI – confidence interval
Table 2. Association of CCNE1 variants with the risk of bladder cancer under genotypic effect, stratified by bladder cancer aggressiveness.
| GWAS 1+2 | NR, n (%)* | Het, n (%)* | R, n (%)* | Het OR (95%CI)# | P# | Hom OR (95%CI)# | P# |
|---|---|---|---|---|---|---|---|
| rs8102137 (T/C) | |||||||
|
| |||||||
| All controls | 4957 (46.0) | 4657 (43.2) | 1159 (10.8) | 1.00 (referent) | - | 1.00 (referent) | - |
| All cases | 2461 (41.7) | 2710 (45.9) | 730 (12.4) | 1.14 (1.06-1.23) | 5.1×10⁻⁴ | 1.25 (1.12-1.41) | 1.4×10⁻⁴ |
| Non-aggressive | 811 (43.7) | 849 (45.8) | 195 (10.5) | 1.09 (0.97-1.23) | 0.15 | 1.06 (0.87-1.28) | 0.58 |
| Aggressive | 765 (39.9) | 901 (47.0) | 250 (13.1) | 1.22 (1.08-1.37) | 9.1×10⁻⁴ | 1.35 (1.14-1.61) | 7.0×10⁻⁴ |
|
| |||||||
| rs7257330 (G/A) | |||||||
|
| |||||||
| All controls | 4092 (38.0) | 5046 (46.8) | 1635 (15.2) | 1.00 (referent) | - | 1.00 (referent) | - |
| All cases | 2014 (34.1) | 2900 (49.1) | 987 (16.7) | 1.15 (1.06-1.24) | 3.8×10⁻⁴ | 1.21 (1.09-1.34) | 4.1×10⁻⁴ |
| Non-aggressive | 681 (36.7) | 902 (48.6) | 272 (14.7) | 1.07 (0.95-1.22) | 0.26 | 0.99 (0.83-1.18) | 0.90 |
| Aggressive | 607 (31.7) | 970 (50.6) | 339 (17.7) | 1.27 (1.12-1.43) | 1.2×10⁻⁴ | 1.34 (1.14-1.57) | 3.7×10⁻⁴ |
Analysis was performed only on subjects with genotype information available for both SNPs, where rs8102137 was from actual genotyping in NCI-GWAS1 and NCI-GWAS2, and rs7257330 was converted from imputed allelic dosage with ≥0.9 probability. For rs8102137, NR (non-risk homozygotes) = TT; Het = TC; R (risk homozygotes) = CC. For rs7257330, NR = GG; Het = GA; R = AA. Bladder cancer aggressiveness was defined in two categories: the non-aggressive category included cases with stage Ta with grade G1/G2 tumors, the aggressive category included cases with stage T1-T4 or grade G3/G4 tumors.
P-values for estimates from multivariable logistic regression models assuming log-additive genetic effects, adjusting for age, gender, study sites, smoking status and top eigenvectors (EV1, EV5, EV6) from principal component analysis of NCI-GWAS datasets.
OR – odds ratio, CI – confidence interval
Among markers with a minor allele frequency (MAF)>1%, there were no variants with strong associations independent of the original GWAS marker rs8102137 (Supplementary Table 5, Figure 3), with the best residual association in the aggressive category being P = .084 for rs75996259 (r2 = .72 with rs8102137, Supplementary Table 5). An intronic SNP rs3218036, previously reported as an ovarian cancer susceptibility candidate among Europeans (22), was one of the 47 linked variants associated with aggressive bladder cancer in our combined GWAS set (r2 = .99 with rs8102137; OR = 1.12, 95%CI = 1.07-118, P = 1.35×10⁻⁵). Other CCNE1 variants previously associated with risk of breast and nasopharyngeal cancers in Asians (13, 23) were monomorphic or rare, with some suggestive associations in our study (Supplementary Table 5 and 8). Only two rare (MAF<0.5%) non-synonymous coding CCNE1 variants were imputed in our dataset but with low imputation scores (.35 - .38). One of these variants, rs61750863 (Asn260Ile) showed a suggestive independent association with aggressive bladder cancer (Supplementary Table 7). We sequenced this marker in 608 NCI-GWAS1 samples but found poor concordance between imputed and sequenced data (Supplementary Table 7), hence this variant was not studied further.
Figure 3. Association results, linkage disequilibrium (r2) and recombination plots of the CCNE1 region in combined NCI-GWAS1 and NCI-GWAS2 samples.

Left y-axis (–log10 scale) presents p-values for GWAS (filled circles) and well-imputed markers (IMPUTE2-score ≥ 0.9, open circles), adjusted for age, gender, study sites, smoking status (ever/never) and top eigenvectors (EV1, EV5, EV6) from principal component analysis. The color scheme is based on r2 values between rs8102137 and corresponding markers. Right y-axis presents likelihood ratio of putative recombination hotspots based on five sets of 100 randomly selected controls from NCI-GWAS1 and shown as connected gray lines. The GWAS marker rs8102137 and the promoter variant rs7257330 are shown as diamonds. Pair-wise r2 values based on all control samples are displayed at the bottom of the plot for all 165 SNPs included in our analyses. Genomic coordinates are based on the NCBI Human Genome Build 37.1/UCSC hg19 assembly.
(A) Association analysis in a subset of patients with non-aggressive bladder cancer (stage Ta with grade G1 or G2, n = 1,870) vs. all controls (n = 10,857).
(B) Association analysis in a subset of patients with aggressive bladder cancer (stage Ta with grade G3+ or stages T1-T4 with any grade, n = 1,930) vs. all controls (n = 10,857).
Analysis of CCNE1 mRNA and protein expression
To explore if the CCNE1 splicing diversity could be functionally relevant for the genetic association within this region, we performed RNA-sequencing in tumors and adjacent normal bladder tissues. In addition to two wild-type (WT) forms encoded from translation start sites within the first (WT1) or second exon (WT2), we detected two transcripts (24, 25) encoding aberrant forms of cyclin E (cyclin ES and cyclin ET) with mutually exclusive deletions of internal exons 5 or 7 (Figure 1). The sequences of the full-length transcripts for the alternative CCNE1 forms were deposited to NCBI GenBank. The cyclin ES form (GenBank KF672848) lacks the CDK2-binding region, eliminated by an in-frame exclusion of 49 aa (147 bp, exon 5) (24) within the cyclin box domain. The cyclin ET form (GenBank KF672847) has an in-frame exclusion of 45 aa (135 bp, exon 7) (25), which eliminates the centrosomal localization signal (CLS) (Supplementary Figure 2), which is critical for DNA synthesis and correct cellular segregation (26).
We evaluated mRNA expression of each CCNE1 transcript in 41 bladder tumors and 40 adjacent normal bladder tissues (Suppplementary Table 2). Total CCNE1 mRNA expression (all splicing forms) and expression of the cyclin ES transcript were increased in tumors compared to normal tissues (3.68-fold, P = 5.81×10⁻¹² and 3.56-fold, P = 1.40×10⁻⁹, respectively), but were not associated with rs8102137 and rs7257330 genotypes. Cyclin ET transcript levels were similar in normal and tumor tissues (1.19-fold, P = .50), but higher expression was observed in carriers of risk alleles of both variants (Figure 4).
Figure 4. Analysis of CCNE1 mRNA expression in bladder tumors and adjacent normal tissue and in relation to rs8102137 and rs7257330 genotypes.

Expression of total CCNE1 (all transcripts), cyclin ES and cyclin ET transcripts was measured with TaqMan assays. CCNE1 expression was normalized to a geometric mean of endogenous controls (B2M, GAPDH and PPIA) and presented on the log 2 scale. Less negative values correspond to higher relative expression of CCNE1 transcripts. The association between normalized CCNE1 mRNA expression and risk allele counts (0, 1 and 2) of both SNPs was evaluated with multivariable linear regression models adjusting for age and gender. Most of bladder tumors used for expression analysis (30 of 41 tumors) are of aggressive type (Supplementary Table 2).
Based on mRNA expression levels, we estimated that the cyclin ES and ET are alternative minor forms, representing only 8% and 1-2% of total CCNE1 expression, respectively. We used immunohistochemistry (IHC) analysis to measure total cyclin E protein expression in bladder tissues, reasoning that this analysis would mostly detect the two major WT-cyclin E isoforms, but not the minor alternative isoforms. Consistent with mRNA expression, cyclin E protein expression was stronger in tumors compared to adjacent normal tissues (Figure 5A). In a large set of well-characterized bladder tumors (n = 265), nuclear cyclin E expression, scored on the scale 0-6 (Figure 5B), was increased in aggressive tumors (P = .013, Figure 5C), but was not associated with age, gender and smoking (Supplementary Table 8). In multivariable linear regression models additionally adjusted for the categories of bladder cancer aggressiveness, the risk alleles of both markers (rs8102137 and rs7257330) were associated with increased nuclear cyclin E expression, with P = .024 for rs7257330 and P = .078 for rs8102137 (Figure 5C and Supplementary Table 8). Some cytoplasmic cyclin E expression was also detectable in bladder tumors but was not associated with the variables examined (Supplementary Tables 8).
Functional effects of cyclin E over-expression
For further functional evaluation we cloned the WT1, WT2 and the cyclin ET isoforms, because mRNA expression of these forms was associated with CCNE1 genotypes in our experiments described above. We transiently transfected corresponding expression constructs into human cells HeLa and HTB5 to produce specific exogenous recombinant cyclin E protein isoforms. Since these cells lines endogenously express cyclin E, the exogenous cyclin E forms were specifically detected with an antibody for a Halo-tag protein present on all recombinant but not on the endogenously expressed forms. In both cell lines confocal imaging of recombinant proteins produced by CCNE1 expression constructs showed nuclear expression of the WT isoforms (WT1 and WT2), in agreement with endogenous cyclin E expression observed in the same cell lines. In contrast, the recombinant cyclin ET form was expressed in the cytoplasm (Supplementary Figure 3A).
Cyclin E mostly functions as a complex with CDK2, which is formed in the cytoplasm but then shuffles to the nucleus where it regulates the cell cycle progression (27, 28). We used in situ protein interaction proximity ligation assays (PLA) (29) to evaluate this critical function of cyclin E isoforms in HTB5 cells (Supplementary Figure 3B). Compared to endogenous cyclin E, both recombinant WT forms showed a similar ability to interact with endogenous CDK2. However, the recombinant cyclin ET isoform showed statistically significantly decreased nuclear interaction with CDK2 (Supplementary Figure 3C). To explore the effects of recombinant cyclin E isoforms on cell cycle, HeLa and HTB5 cells were first synchronized at the G0/G1 checkpoint and then transiently transfected into cells to produce the specific cyclin E isoforms. The effects of cyclin E recombinant forms on the cell cycle were measured as a decrease in the percentages of cells accumulated at G0/G1 stage, which is indicative of cell cycle progression. WT1 and WT2 forms, which showed strong interaction with CDK2 in the previous experiment, also caused significant cell cycle progression, while the cyclin ET form demonstrated a decreased ability to promote cell cycle progression, consistent with its inability to sufficiently interact with CDK2 (Supplementary Figure 3D).
Discussion
The initial association of the CCNE1 region with high-grade bladder cancer was identified by our NCI-GWAS1 for a marker rs8102137 (5). We now explored this GWAS signal in the combined set of NCI-GWAS1 and NCI-GWAS2 (15), which included 5,942 bladder cancer cases and 10,857 controls. We used a clinical classification based on combined stage and grade information, with high-grade NMIBC and MIBC being classified as aggressive and low-grade NMIBC being classified as non-aggressive cancers. After detailed fine-mapping analysis of the region we report that the original GWAS marker rs8102137 represents a group of 47 linked most associated markers and the association of these markers was limited to aggressive bladder cancer cases. This pattern of association was comparable in both GWAS sets (Table 1 and 2), although the association with bladder cancer risk overall was only borderline significant in NCI-GWAS2. This could be due to a smaller proportion of aggressive bladder cancer cases in NCI-GWAS2 (26.1%) compared to NCI-GWAS 1 (36.9%, Table 1).
The exact functional variant(s) among the set of the 47 linked markers in the CCNE1 region may be difficult to pinpoint. However, we propose that the promoter variant rs7257330 appears to be a good representative of this group and also a functional variant, which showed strong association with nuclear expression of the cyclin E protein in bladder tumors, and exhibited allele-specific interaction with nuclear proteins in various cell lines. The location of rs7257330 within a region of a uniquely strong histone H3 acetylation mark at Lysine 27 (H3K27Ac) characteristic of active enhancers (Figure 1), also suggests that rs7257330 may function as a regulatory variant within the CCNE1 promoter.
Non-aggressive bladder tumors are considered to be genomically stable in contrast to genomically unstable aggressive tumors (3, 4). Based on our genetic and functional studies we suggest that cyclin E may contribute to the genomic instability and aggressive bladder cancer through at least two possible functional mechanisms. The first mechanism could be related to a rs7257330 genotype-specific increase in nuclear expression of cyclin E protein in bladder tumors. The majority of detectable cyclin E protein is represented by the WT cyclin E isoforms, which we showed to be functional in interaction with CDK2 and the ability to promote the cell cycle. Rapid cell cycle progression generates cells with genomic alterations (aneuploid or polyploid cells) (30, 31) and may further the development of aggressive cancer. The second mechanism could be related to the increased mRNA expression of a minor alternative splicing form, cyclin ET. We found that cyclin ET is expressed in the cytoplasm, and has poor ability to interact with CDK2 and promote the cell cycle. However, the cyclin ET isoform lacks the centrosomal localization signal (CLS), which is necessary for correct cellular segregation (25, 26), hence, its increased expression may also contribute to genomic instability (32).
Limitations of this study include the need of validation of rs7257330 as a prognostic marker for bladder cancer. Only patients of European ancestry were involved in our study and validation studies in patients from other population groups are needed before generalizing our conclusions.
Information on environmental, epidemiologic, genetic and modifiable factors such as family and infection history, alcohol and tobacco use, and genotypes of relevant germline and somatic genetic variants can be combined to develop clinically useful risk prediction models. Each of these factors may be only weakly or moderately informative when considered individually. However, a combination of these factors could improve the utility of prediction models and help in risk assessment, early detection and screening, therapeutic response prediction, prognosis and survivorship. As the first and the only germline genetic marker with statistically significant discrimination between aggressive and non-aggressive bladder cancer in two large GWAS, the CCNE1 genetic variant rs7257330 represents a promising candidate for the inclusion into risk prediction models.
Supplementary Material
Acknowledgments
Grant Support: The project has been funded in whole or in part with federal funds from the intramural research program (IRP) of the NCI/NIH (Contract No. HHSN261200800001E).
Additional funds to specific studies:
ATBC (D.A.) - the Intramural Research Program (IRP) of the Division of Cancer Epidemiology and Genetics (DCEG)/NCI/NIH and by U.S. Public Health Service contracts N01-CN-45165, N01-RC-45035, N01-RC-37004 and HHSN261201000006C.
EPIC (P.V.) - ICL - Europe Against Cancer Program of the European Commission (SANCO); IARC - International Agency for Research on Cancer; France - Ligue contre le Cancer Societe 3M, Mutuelle Generale de l'Education Nationale; Institut National de la Santé et de la Recherche Médicale (INSERM); Italy - Italian Association for Research on Cancer National Research Council; Spain - Health Research Fund (FIS) of the Spanish Ministry of Health; the CIBER en Epidemiología y Salud Pública (CIBERESP), Spain; ISCIII RETIC (RD06/0020); Spanish Regional Governments of Andalusia, Asturias, Basque Country, Murcia (N 6236) and Navarra and the Catalan Institute of Oncology; UK -Cancer Research UK Medical Research Council with additional support from the Stroke Association, British Heart Foundation, Department of Health, Food Standards Agency, the Wellcome Trust; The Netherlands - Dutch Ministry of Public Health Dutch Prevention Funds LK Research Funds Dutch ZON (Zorg Onderzoek Nederland) World Cancer Research Fund (WCRF); Greece - Hellenic Ministry of Health, the Stavros Niarchos Foundation and the Hellenic Health Foundation; Germany - German Cancer Aid, German Cancer Research Center Federal Ministry of Education and Research (Grant 01-EA-9401); Sweden - Swedish Cancer Society, Swedish Scientific Council, Regional Government of Skane, Sweden; and Denmark - Danish Cancer Society.
FBCS (S.B.)- Ligue Contre le Cancer du Val-de-Marne; Fondation de France; Groupement d'Entreprises Françaises dans la Lutte contre le Cancer; Association pour la Recherche sur le Cancer, France.
LABCS (M.P.) - NIH grants R01CA65726, R01CA114665, 1R01CA114665 and 1P01CA86871.
NEBCS (D.T.S.) – IRP of the DCEG/NCI/NIH and intramural contract NCI N02-CP-01037.
NHS & HPFS (I.D.V.) - CA055075, P01 CA87969, R01 CA49449, UM1 CA176726, R01 CA67262, UM1 CA167552, CA082838.
PLCO (M.P.P) - The NIH Genes, Environment and Health Initiative (GEI) grants HG-06-033-NCI-01 and RO1HL091172-01, U01HG004438 and NIH HHSN268200782096C.
GENEVA (N.C.) Coordination Center grant U01HG004446), the IRP of the DCEG/NCI/NIH and contracts from the Division of Cancer Prevention, NCI/NIH.
SBCS (D.T.S.) – IRP of the DCEG/NCI/NIH and intramural contract NCI N02-CP-11015. FIS/Spain 98/1274, FIS/Spain 00/0745, PI061614, and G03/174, Fundació Marató TV3, Red Temática Investigación Cooperativa en Cáncer (RTICC), Consolíder ONCOBIO, EU-FP7-201663; and RO1- CA089715 and CA34627.
WHI (C.K.) - funds from the National Heart, Lung, and Blood Institute (NHLBI)/NIH through contracts HHSN268201100046C, HHSN268201100001C, HHSN268201100002C, HHSN268201100003C, HHSN268201100004C, and HHSN271201100004C.
Footnotes
Disclosure of Potential Conflicts of Interest: G.L. Andriole is a consultant/advisory board member of Augmenix, Bayer, GlaxoSmithKline, Myriad Genetics and Genomic Health. H.B. Grossman has ownership interest (including patents) in Abbott Molecular and is a consultant/board member for Nucleix. No potential conflicts of interest were disclosed by the other authors.
References
- 1.Siegel R, Naishadham D, Jemal A. Cancer statistics, 2013. CA Cancer J Clin. 2013;63:11–30. doi: 10.3322/caac.21166. [DOI] [PubMed] [Google Scholar]
- 2.Stein JP, Lieskovsky G, Cote R, Groshen S, Feng AC, Boyd S, Skinner E, et al. Radical cystectomy in the treatment of invasive bladder cancer: long-term results in 1,054 patients. J Clin Oncol. 2001;19:666–675. doi: 10.1200/JCO.2001.19.3.666. [DOI] [PubMed] [Google Scholar]
- 3.Guey LT, Garcia-Closas M, Murta-Nascimento C, Lloreta J, Palencia L, Kogevinas M, Rothman N, et al. Genetic susceptibility to distinct bladder cancer subphenotypes. Eur Urol. 2010;57:283–292. doi: 10.1016/j.eururo.2009.08.001. [DOI] [PMC free article] [PubMed] [Google Scholar]
- 4.Hernandez S, Lopez-Knowles E, Lloreta J, Kogevinas M, Amoros A, Tardon A, Carrato A, et al. Prospective study of FGFR3 mutations as a prognostic factor in nonmuscle invasive urothelial bladder carcinomas. J Clin Oncol. 2006;24:3664–3671. doi: 10.1200/JCO.2005.05.1771. [DOI] [PubMed] [Google Scholar]
- 5.Rothman N, Garcia-Closas M, Chatterjee N, Malats N, Wu X, Figueroa JD, Real FX, et al. A multi-stage genome-wide association study of bladder cancer identifies multiple susceptibility loci. Nat Genet. 2010;42:978–984. doi: 10.1038/ng.687. [DOI] [PMC free article] [PubMed] [Google Scholar]
- 6.Figueroa JD, Ye Y, Siddiq A, Garcia-Closas M, Chatterjee N, Prokunina-Olsson L, Cortessis VK, et al. Genome-wide association study identifies multiple loci associated with bladder cancer risk. Hum Mol Genet. 2013 doi: 10.1093/hmg/ddt519. [DOI] [PMC free article] [PubMed] [Google Scholar]
- 7.Wu X, Ye Y, Kiemeney LA, Sulem P, Rafnar T, Matullo G, Seminara D, et al. Genetic variation in the prostate stem cell antigen gene PSCA confers susceptibility to urinary bladder cancer. Nat Genet. 2009;41:991–995. doi: 10.1038/ng.421. [DOI] [PMC free article] [PubMed] [Google Scholar]
- 8.Kiemeney LA, Thorlacius S, Sulem P, Geller F, Aben KK, Stacey SN, Gudmundsson J, et al. Sequence variant on 8q24 confers susceptibility to urinary bladder cancer. Nat Genet. 2008;40:1307–1312. doi: 10.1038/ng.229. [DOI] [PMC free article] [PubMed] [Google Scholar]
- 9.Lew DJ, Dulic V, Reed SI. Isolation of three novel human cyclins by rescue of G1 cyclin (Cln) function in yeast. Cell. 1991;66:1197–1206. doi: 10.1016/0092-8674(91)90042-w. [DOI] [PubMed] [Google Scholar]
- 10.Donnellan R, Chetty R. Cyclin E in human cancers. FASEB J. 1999;13:773–780. doi: 10.1096/fasebj.13.8.773. [DOI] [PubMed] [Google Scholar]
- 11.Glotzer M, Murray AW, Kirschner MW. Cyclin is degraded by the ubiquitin pathway. Nature. 1991;349:132–138. doi: 10.1038/349132a0. [DOI] [PubMed] [Google Scholar]
- 12.Nakayama N, Nakayama K, Shamima Y, Ishikawa M, Katagiri A, Iida K, Miyazaki K. Gene amplification CCNE1 is related to poor survival and potential therapeutic target in ovarian cancer. Cancer. 2010;116:2621–2634. doi: 10.1002/cncr.24987. [DOI] [PubMed] [Google Scholar]
- 13.Liu Y, Cai H, Liu J, Fan H, Wang Z, Wang Q, Shao M, et al. A miR-151 binding site polymorphism in the 3'-untranslated region of the cyclin E1 gene associated with nasopharyngeal carcinoma. Biochem Biophys Res Commun. 2013;432:660–665. doi: 10.1016/j.bbrc.2013.02.024. [DOI] [PubMed] [Google Scholar]
- 14.Forbes SA, Bindal N, Bamford S, Cole C, Kok CY, Beare D, Jia M, et al. COSMIC: mining complete cancer genomes in the Catalogue of Somatic Mutations in Cancer. Nucleic Acids Res. 2011;39:D945–D950. doi: 10.1093/nar/gkq929. [DOI] [PMC free article] [PubMed] [Google Scholar]
- 15.Figueroa JD, Ye Y, Siddiq A, Garcia-Closas M, Chatterjee N, Prokunina-Olsson L, Cortessis VK, et al. Genome-wide association study identifies multiple loci associated with bladder cancer risk. Human Molecular Genetics. 2013 doi: 10.1093/hmg/ddt519. [DOI] [PMC free article] [PubMed] [Google Scholar]
- 16.Fu YP, Kohaar I, Rothman N, Earl J, Figueroa JD, Ye Y, Malats N, et al. Common genetic variants in the PSCA gene influence gene expression and bladder cancer risk. Proc Natl Acad Sci U S A. 2012;109:4974–4979. doi: 10.1073/pnas.1202189109. [DOI] [PMC free article] [PubMed] [Google Scholar]
- 17.Abecasis GR, Auton A, Brooks LD, DePristo MA, Durbin RM, Handsaker RE, Kang HM, et al. An integrated map of genetic variation from 1,092 human genomes. Nature. 2012;491:56–65. doi: 10.1038/nature11632. [DOI] [PMC free article] [PubMed] [Google Scholar]
- 18.Howie BN, Donnelly P, Marchini J. A Flexible and Accurate Genotype Imputation Method for the Next Generation of Genome-Wide Association Studies. PLoS Genet. 2009;5:e1000529. doi: 10.1371/journal.pgen.1000529. [DOI] [PMC free article] [PubMed] [Google Scholar]
- 19.Kohaar I, Porter-Gill P, Lenz P, Fu YP, Mumy A, Tang W, Apolo AB, et al. Genetic variant as a selection marker for anti-prostate stem cell antigen immunotherapy of bladder cancer. J Natl Cancer Inst. 2013;105:69–73. doi: 10.1093/jnci/djs458. [DOI] [PMC free article] [PubMed] [Google Scholar]
- 20.Lenz P, Pfeiffer R, Baris D, Schned AR, Takikita M, Poscablo MC, Schwenn M, et al. Cell-cycle control in urothelial carcinoma: large-scale tissue array analysis of tumor tissue from Maine and Vermont. Cancer Epidemiol Biomarkers Prev. 2012;21:1555–1564. doi: 10.1158/1055-9965.EPI-12-0261. [DOI] [PMC free article] [PubMed] [Google Scholar]
- 21.Bernstein BE, Birney E, Dunham I, Green ED, Gunter C, Snyder M. An integrated encyclopedia of DNA elements in the human genome. Nature. 2012;489:57–74. doi: 10.1038/nature11247. [DOI] [PMC free article] [PubMed] [Google Scholar]
- 22.Goode EL, Fridley BL, Vierkant RA, Cunningham JM, Phelan CM, Anderson S, Rider DN, et al. Candidate gene analysis using imputed genotypes: cell cycle single-nucleotide polymorphisms and ovarian cancer risk. Cancer Epidemiol Biomarkers Prev. 2009;18:935–944. doi: 10.1158/1055-9965.EPI-08-0860. [DOI] [PMC free article] [PubMed] [Google Scholar]
- 23.Han JY, Wang H, Xie YT, Li Y, Zheng LY, Ruan Y, Song AP, et al. Association of germline variation in CCNE1 and CDK2 with breast cancer risk, progression and survival among Chinese Han women. PLoS One. 2012;7:e49296. doi: 10.1371/journal.pone.0049296. [DOI] [PMC free article] [PubMed] [Google Scholar]
- 24.Sewing A, Ronicke V, Burger C, Funk M, Muller R. Alternative splicing of human cyclin E. J Cell Sci. 1994;107(Pt 2):581–588. doi: 10.1242/jcs.107.2.581. [DOI] [PubMed] [Google Scholar]
- 25.Mumberg D, Wick M, Burger C, Haas K, Funk M, Muller R. Cyclin ET, a new splice variant of human cyclin E with a unique expression pattern during cell cycle progression and differentiation. Nucleic Acids Res. 1997;25:2098–2105. doi: 10.1093/nar/25.11.2098. [DOI] [PMC free article] [PubMed] [Google Scholar]
- 26.Matsumoto Y, Maller JL. A centrosomal localization signal in cyclin E required for Cdk2-independent S phase entry. Science. 2004;306:885–888. doi: 10.1126/science.1103544. [DOI] [PubMed] [Google Scholar]
- 27.Moore JD. In the wrong place at the wrong time: does cyclin mislocalization drive oncogenic transformation? Nat Rev Cancer. 2013;13:201–208. doi: 10.1038/nrc3468. [DOI] [PubMed] [Google Scholar]
- 28.Moore JD, Yang J, Truant R, Kornbluth S. Nuclear import of Cdk/cyclin complexes: identification of distinct mechanisms for import of Cdk2/cyclin E and Cdc2/cyclin B1. J Cell Biol. 1999;144:213–224. doi: 10.1083/jcb.144.2.213. [DOI] [PMC free article] [PubMed] [Google Scholar]
- 29.Soderberg O, Gullberg M, Jarvius M, Ridderstrale K, Leuchowius KJ, Jarvius J, Wester K, et al. Direct observation of individual endogenous protein complexes in situ by proximity ligation. Nat Methods. 2006;3:995–1000. doi: 10.1038/nmeth947. [DOI] [PubMed] [Google Scholar]
- 30.Ekholm-Reed S, Mendez J, Tedesco D, Zetterberg A, Stillman B, Reed SI. Deregulation of cyclin E in human cells interferes with prereplication complex assembly. J Cell Biol. 2004;165:789–800. doi: 10.1083/jcb.200404092. [DOI] [PMC free article] [PubMed] [Google Scholar]
- 31.Kawamura K, Izumi H, Ma Z, Ikeda R, Moriyama M, Tanaka T, Nojima T, et al. Induction of centrosome amplification and chromosome instability in human bladder cancer cells by p53 mutation and cyclin E overexpression. Cancer Res. 2004;64:4800–4809. doi: 10.1158/0008-5472.CAN-03-3908. [DOI] [PubMed] [Google Scholar]
- 32.Geisen C, Moroy T. The oncogenic activity of cyclin E is not confined to Cdk2 activation alone but relies on several other, distinct functions of the protein. J Biol Chem. 2002;277:39909–39918. doi: 10.1074/jbc.M205919200. [DOI] [PubMed] [Google Scholar]
Associated Data
This section collects any data citations, data availability statements, or supplementary materials included in this article.