Abstract
Glioblastoma is one of the most aggressive human cancers with poor prognosis, and therefore a critical need exists for novel therapeutic strategies for management of glioblastoma patients. Itraconazole, a traditional antifungal drug, has been identified as a novel potential anticancer agent due to its inhibitory effects on cell proliferation and tumor angiogenesis; however, the molecular mechanisms involved are still unclear. Here, we show that itraconazole inhibits the proliferation of glioblastoma cells both in vitro and in vivo. Notably, we demonstrate that treatment with itraconazole induces autophagic progression in glioblastoma cells, while blockage of autophagy markedly reverses the antiproliferative activities of itraconazole, suggesting an antitumor effect of autophagy in response to itraconazole treatment. Functional studies revealed that itraconazole retarded the trafficking of cholesterol from late endosomes and lysosomes to the plasma membrane by reducing the levels of SCP2, resulting in repression of AKT1-MTOR signaling, induction of autophagy, and finally inhibition of cell proliferation. Together, our studies provide new insights into the molecular mechanisms regarding the antitumor activities of itraconazole, and may further assist both the pharmacological investigation and rational use of itraconazole in potential clinical applications.
Keywords: itraconazole, antiproliferative, autophagy, BECN1-PtdIns3K complex, cholesterol trafficking
Introduction
Glioblastoma is one of the most common cancers of the central nervous system, comprising approximately 25% of all brain tumors in adults.1,2 Glioblastoma is characterized by diffuse infiltration into the brain parenchyma, robust angiogenesis, and poor response to treatment with conventional radiation and chemotherapy.3 Moreover, most cases of glioblastomas are characterized as primary (de novo) glioblastomas, which develop rapidly without obvious clinical or histological signs of pre-malignant lesions.4 Therefore, although multimodal treatment (typically including surgical resection, radiotherapy, and chemotherapy) is widely used in the clinic, the average survival time remains about approximately one year, highlighting the urgent need for more effective therapeutic strategies.5
Itraconazole, an orally bioavailable and traditional broad-spectrum antifungal drug, is widely used for the management of fungal diseases.6 Recently, a small but increasing number of studies have documented that treatment with itraconazole limited tumor growth in both non-small cell lung cancer and medulloblastoma in animal models.7,8 Such anticancer properties of itraconazole are attributed to its inhibitory effect on endothelial cell proliferation and matrigel-mediated angiogenesis by repressing lanosterol 14-ademethylase and sterol biosynthesis.9 In addition, itraconazole treatment could inhibit MTOR (mechanistic target of rapamycin) activation by disrupting intracellular cholesterol trafficking and disordering subcellular cholesterol distribution, leading to cell cycle arrest in endothelial cells.10 However, the underlying mechanisms by which itraconazole inhibits tumor growth remain largely unknown.
Autophagy is a highly regulated response to cellular stress.11 During autophagy, portions of the cytoplasm and intracellular organelles are sequestered into characteristic double- or multi-membrane autophagosomes which then fuse with lysosomes to form autolysosomes where degradation occurs.12 Autophagy has been observed in a range of cancer cell types challenged with various anticancer therapies,13-15 most of which involve the inhibition of the AKT1 (v-akt murine thymoma viral oncogene homolog 1)-MTOR axis, a pivotal checkpoint that negatively regulates autophagy.16 Depending on different cellular conditions and distinct cancer subtypes, the consequences of autophagy activation can vary significantly in response to chemotherapeutic agents, which can contextually enhance or weaken the drug efficacy.17 On the one hand, autophagy can enable cell survival by maintaining energy production through the recycling mechanism in response to adverse stress, which can lead to tumor dormancy and therapeutic resistance.18 Accumulating numbers of preclinical studies have demonstrated that inhibition of prosurvival autophagy by genetic or pharmacological intervention can further potentiate chemosensitivity and enhance tumor cell death than by chemotherapy alone.18,19 On the other hand, autophagy also can act to suppress the initiation of tumor growth and induce cell death independent of, or in parallel to, apoptosis and necrosis in certain cellular contexts.20 Therefore, understanding the roles of autophagy and the regulated signaling pathways involved in cancer treatment is critical, and will provide new opportunities for therapeutic advantage.
In the current study, the biological effects of itraconazole on glioblastoma were investigated using both in vitro and in vivo models. We found that itraconazole inhibits proliferation of glioblastoma cells by inducing autophagy. Itraconazole-induced autophagy is mediated by abnormal cellular cholesterol redistribution and subsequent inhibition of the AKT1-MTOR signaling pathway. These results will lead to new insights into the antiproliferative properties of itraconazole, and provide the groundwork for the potential application of itraconazole in anticancer therapy.
Results
Itraconazole inhibits proliferation of glioblastoma tumor cells
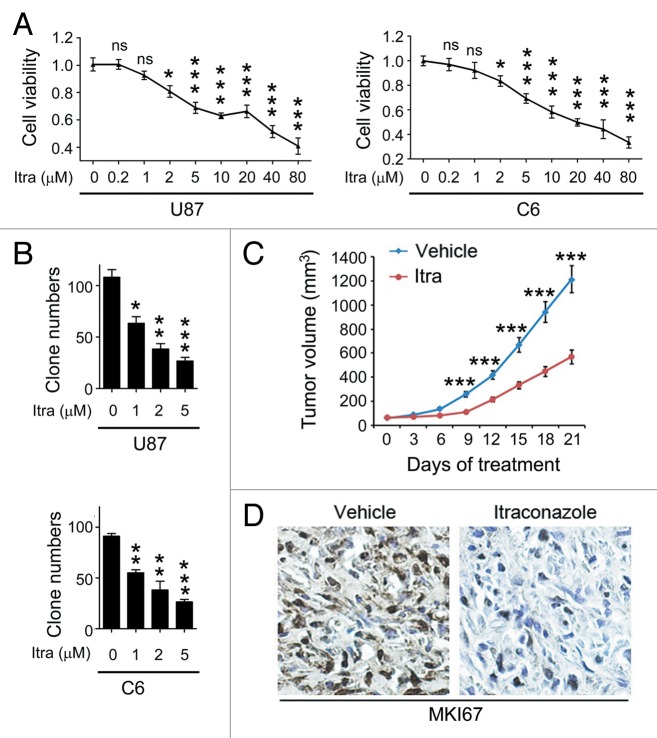
To examine the effect of itraconazole on glioblastoma growth, the 3-(4, 5-dimethylthiazol-2-yl)-2, 5-diphenyltetrazolium bromide (MTT) assay was performed to measure the cell proliferation rates of U87 and C6 cells following treatment with different concentrations of itraconazole. As shown in Figure 1A, cell viability decreased in a dose-dependent manner in both cell lines. Furthermore, the long-term effects of itraconazole on cell survival were determined using a colony formation assay. The results showed that itraconazole significantly suppressed cell proliferation, as indicated by the decreased number of cell colonies in the itraconazole-treated group (Fig. 1B).
Figure 1. Itraconazole inhibits glioblastoma tumor growth. (A) U87 or C6 cells were treated with indicated concentrations of itraconazole for 36 h. Cell viability was measured by the MTT assay. The data were representative of 5 independent experiments. (B) U87 or C6 cells were consecutively treated with indicated concentrations of itraconazole for 2 wk. Cell proliferation was examined by colony formation assay. The data were representative of 3 independent experiments. (C) Nude mice with U87 subcutaneous tumor xenografts were treated with hydroxypropyl-cyclodextrin (vehicle, n = 9) or 75 mg/kg itraconazole (n = 9) twice daily by oral gavage for 3 wk. During drug treatment, tumor volumes were monitored every 3 d. (D) MKI67 expression in tumors from vehicle- or itraconazole-treated mice was examined by immunohistochemistry. Representative images of MKI67 immunohistochemistry were shown. *P < 0.05; **P < 0.01; ***P < 0.001; Itra, itraconazole.
To decipher the mechanism underlying the itraconazole-mediated inhibition of proliferation, we examined its effect on cell cycle progression of glioblastoma cells. Itraconazole treatment led to an increase in the fraction of cells in G1 phase and a corresponding decrease in the fraction of cells in S phase, suggesting that itraconazole potently inhibited cell cycle progression at the G1-S transition (Fig. S1A). To further evaluate whether itraconazole-mediated inhibition of cell proliferation was associated with cell death, the ANXA5 (annexin V)-propidium iodide (PI) assay was used to detect apoptotic cells. Itraconazole treatment did not increase the percentage of ANXA5-positive cells, which are indicative of apoptotic cells (Fig. S2A). Similar results were observed using the terminal deoxynucleotidyl transferase dUTP nick end labeling (TUNEL) assay, a more specific method to detect apoptosis (Fig. S2B). These findings indicated that itraconazole inhibited cell proliferation via induction of G1-S arrest but not by apoptosis in glioblastoma cells.
The antitumor properties of itraconazole in glioblastoma were further evaluated using a mouse xenograft model. Nude mice bearing established progressive tumors that had been treated with itraconazole showed a significantly decreased rate of tumor growth (Fig. 1C). Further, the immunoreactivity of MKI67 (marker of proliferation Ki-67), a marker of cell proliferation,21 was markedly lower in the itraconazole-treated group compared with the controls (Fig. 1D), suggesting that itraconazole inhibited tumor cell proliferation.
Autophagy is responsible for itraconazole-induced inhibition of proliferation
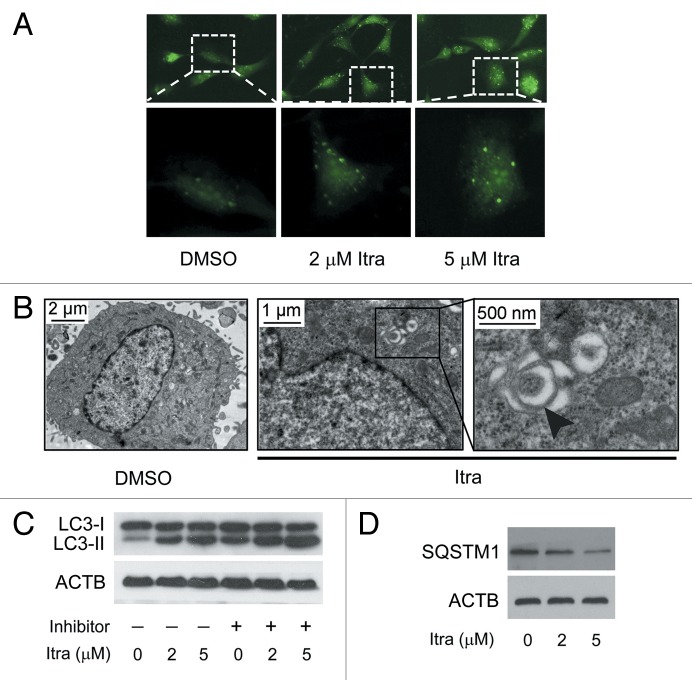
As growing evidence has highlighted the important roles of autophagy in anticancer therapies, we next explored whether autophagy is induced and required for itraconazole-mediated inhibition of cell proliferation. As shown, both exogenous EGFP-LC3 and endogenous LC3 puncta were increased in itraconazole-treated U87 cells (Fig. 2A; Fig. S3A and S3B). Ultrastructural analysis also revealed an increased number of autophagosomes in itraconazole-treated U87 and C6 cells (Fig. 2B; Fig. S4A and S4B). It was shown that itraconazole elevated LC3-II expression in a dose-dependent manner in either the presence or absence of lysosomal protease inhibitors (E64d and pepstatin A), suggesting that itraconazole promoted autophagic flux (Fig. 2C; Fig. S5A–S5C). In addition, to examine whether itraconazole could alter autophagic degradation, steady-state levels of SQSTM1, which are associated with LC3 turnover and are degraded through the autophagic pathway, were analyzed. As expected, itraconazole treatment also induced SQSTM1 degradation in a dose-dependent manner (Fig. 2D; Fig. S5D and S5E).
Figure 2. Itraconazole induces autophagy in glioblastoma cells. (A) U87 cells were transfected with a pEGFP-LC3 plasmid. After 36 h, cells were treated with DMSO or indicated concentrations of itraconazole for another 36 h. Formation of EGFP-LC3 puncta was visualized by fluorescence microscopy. The data are representative of 3 independent experiments. (B) U87 cells were treated with DMSO or 5 μM itraconazole for 36 h, and formation of autophagic vacuoles was examined by TEM analysis. The data are representative of 3 independent experiments. (C) U87 cells were treated with DMSO or indicated concentrations of itraconazole for 36 h. Lysosomal protease inhibitors (E64d and pepstatin A each at 10 µg/ml) were applied for 3 h at the end of treatment time of itraconazole. Conversion of LC3-I to LC3-II was examined by immunoblot. The data are representative of 3 independent experiments. (D) U87 cells were treated with DMSO or indicated concentrations of itraconazole for 36 h, and expression of SQSTM1 was determined by immunoblot. The data are representative of 3 independent experiments. Itra, itraconazole.
Since recent studies indicated a central role of the BECN1/Beclin 1-class III phosphatidylinositol 3-kinase (PtdIns3K) complex in mediating the initial stages of vesicle nucleation/autophagosome formation,22 analysis of the effects of itraconazole on endogenous BECN1-PtdIns3K complexes was undertaken. As shown in Figure S6A, itraconazole promoted association of BECN1 with PtdIns3K. Since the binding of BCL2 (B-cell CLL/lymphoma 2) to BECN1 negatively regulates the autophagy-promoting BECN1-PtdIns3K complexes,23 we further investigated whether itraconazole could induce the dissociation of BCL2 from BECN1 to facilitate the stabilization of BECN1-PtdIns3K complexes. As shown in Figure S6B, no obvious alterations were observed on the interaction of BECN1 and BCL2, suggesting that the interaction between BECN1 and BCL2 is not involved in itraconazole-induced autophagy. Intriguingly, itraconazole could stimulate recruitment of ATG14 (autophagy-related 14) to BECN1 (Fig. S6C), indicating that itraconazole promotes the formation of PtdIns3K, BECN1, and ATG14 complexes.
To examine whether itraconazole induces autophagy in vivo, immunohistochemistry was performed to examine the expression of LC3 in U87 subcutaneous xenograft tumor sections. As shown in Figure 3A, LC3 expression in the tumors treated with itraconazole was much stronger compared with control groups. Accordingly, immunoblot analysis showed an apparent accumulation of LC3-II in tumors from itraconazole-treated mice (Fig. 3B; Fig. S6D). Together, these studies demonstrated that itraconazole potently induced autophagy both in vitro and in vivo.
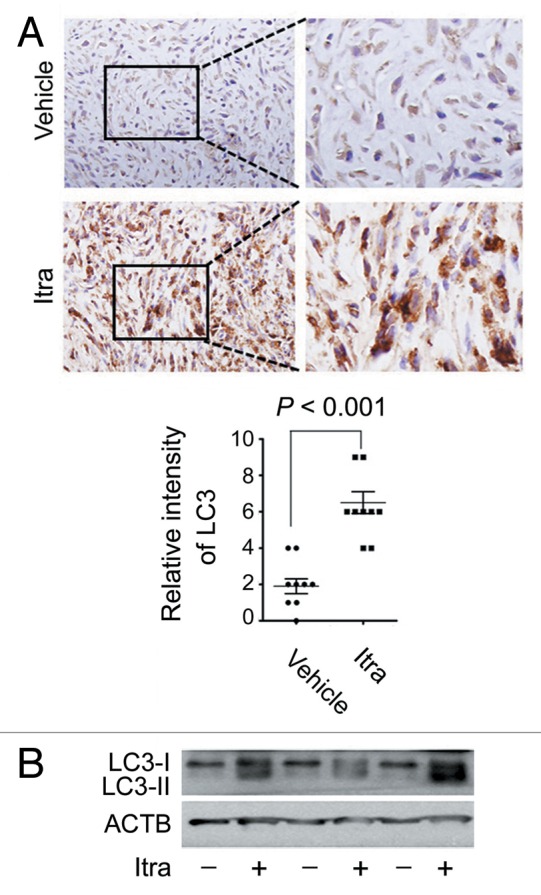
Figure 3. Itraconazole induces autophagy in vivo. (A) Nude mice with U87 subcutaneous tumor xenografts were treated with hydroxypropyl-cyclodextrin (vehicle, n = 9) or 75 mg/kg itraconazole (n = 9) twice daily by oral gavage for 3 wk. LC3 expression in tumor xenografts was examined by immunohistochemistry. Eight individual fields of each slide were randomly selected for evaluation of the intensity of LC3 staining. (B) Conversion of LC3-I to LC3-II in tumors from vehicle- or itraconazole-treated mice was examined by immunoblot. Representative image of LC3 immunoblots was shown. Itra, itraconazole.
To evaluate the functional role of itraconazole-induced autophagy in the therapeutic treatment of glioblastoma, target specific siRNAs were utilized to silence expression of ATG5 or BECN1, either of which encodes a key component for autophagosome biogenesis (Fig. 4A–D; Fig. S7A–S7D). Itraconazole-mediated inhibition of proliferation was partially restored when ATG5 or BECN1 was knocked down (Fig. 4E). In agreement with this observation, colony formation assay and bromodeoxyuridine (BrdU) analysis revealed that both the number of colonies and nuclear incorporation of BrdU were increased in the presence of either siATG5 or siBECN1 compared with administration of itraconazole alone (Fig. S7E and S7F). These results suggest that autophagy plays an antiproliferative role in glioblastoma cells in response to itraconazole treatment.
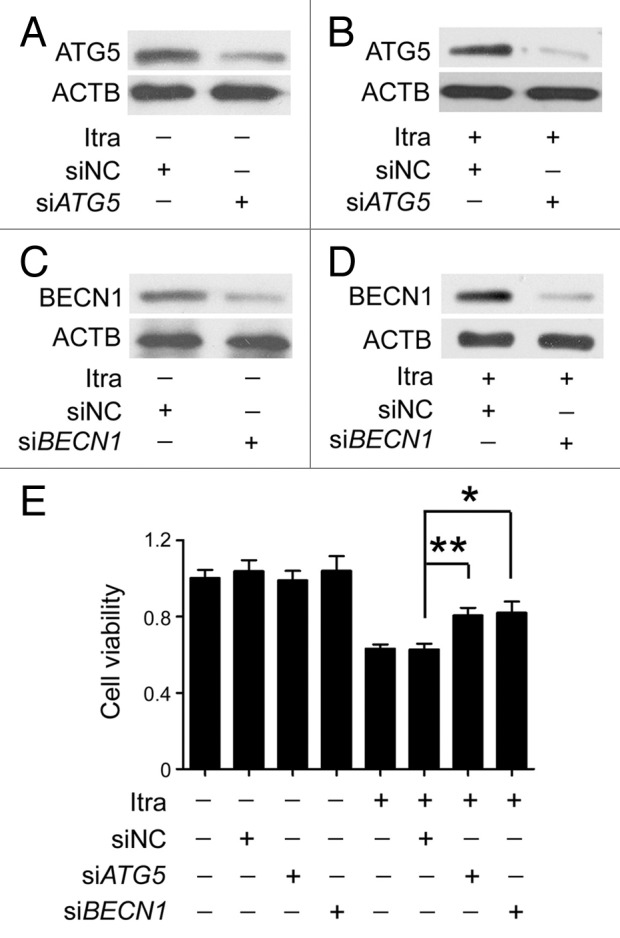
Figure 4. Inhibition of autophagy represses the antiproliferative effect of itraconazole. (A) U87 cells were transfected with siNC (negative control) or siATG5 for 72 h, and expression of ATG5 was examined by immunoblot. The data are representative of 3 independent experiments. (B) U87 cells were transfected with siNC or siATG5 for 36 h, and then treated with 5 μM itraconazole for another 36 h. Expression of ATG5 was examined by immunoblot. The data are representative of 3 independent experiments. (C) U87 cells were transfected with siNC or siBECN1 for 72 h, and expression of BECN1 was examined by immunoblot. The data are representative of 3 independent experiments. (D) U87 cells were transfected with siNC or siBECN1 for 36 h, and then treated with DMSO or 5 μM itraconazole for another 36 h. Expression of BECN1 was examined by immunoblot. The data are representative of 3 independent experiments. (E) U87 cells were transfected with siNC, siATG5, or siBECN1 for 36 h, and then treated with 5 μM itraconazole for another 36 h. Cell proliferation was examined by the MTT assay. The data are representative of 5 independent experiments for the MTT assay. *P < 0.05; **P < 0.01; Itra, itraconazole.
Itraconazole induces autophagy through inhibition of the AKT1-MTOR pathway
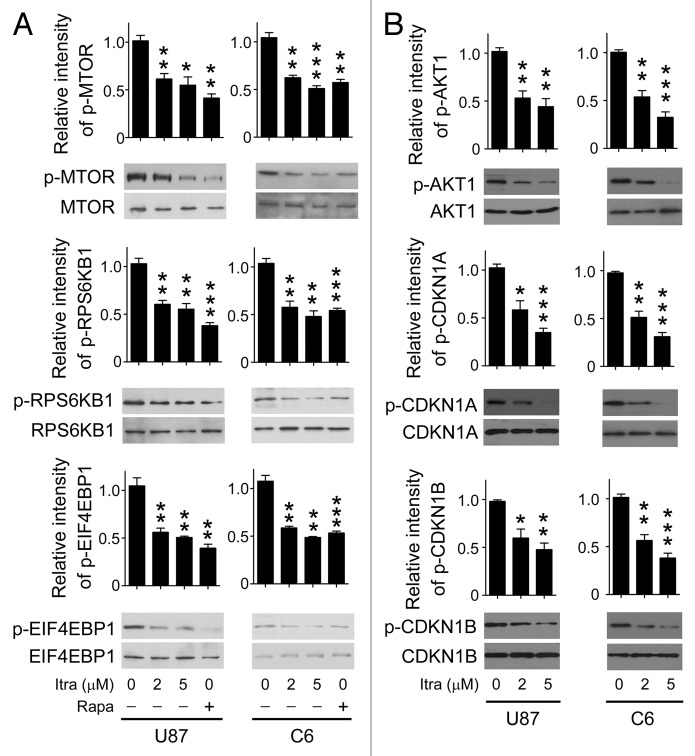
The AKT1-MTOR pathway is a major regulator of autophagy.24 Under conditions such as nutrient deprivation or oxygen stress, the AKT1-MTOR pathway is inhibited while autophagy is induced.25,26 Therefore, it was of particular interest to examine the activation status of the AKT1-MTOR pathway. As shown in Figure 5A and B, itraconazole inhibited the phosphorylation of either AKT1 or MTOR in both U87 and C6 cells. To further validate whether the AKT1-MTOR pathway was suppressed in response to itraconazole treatment, immunoblot analysis was performed to examine the phosphorylation status of CDKN1A (cyclin-dependent kinase inhibitor 1A [p21, Cip1]) and CDKN1B (cyclin-dependent kinase inhibitor 1B [p27, Kip1]), 2 substrates of AKT1, as well as RPS6KB1 (ribosomal protein S6 kinase, 70 kDa, polypeptide 1) and EIF4EBP1 (eukaryotic translation initiation factor 4E binding protein 1), 2 downstream effectors of MTOR.27-29 Itraconazole markedly repressed phosphorylation of CDKN1A, CDKN1B, RPS6KB1, and EIF4EBP1 (Fig. 5A and B). We further examined whether other autophagy-related signaling regulators, including MAPK (mitogen-activated protein kinase)1/3, MAPK14, and MAPK8 were involved in itraconazole-induced autophagy.30,31 As shown in Figure S8A, itraconazole had no obvious effect on the activation of these signaling pathways, indicating a specificity for the inhibition of AKT1-MTOR pathway. To further determine the role of the AKT1-MTOR pathway in itraconazole-induced autophagy, a constitutively active form of AKT1 (ca-AKT1),32,33 was exogenously expressed in itraconazole-treated cells to reactivate the AKT1-MTOR pathway. As shown in Figure S8B, phosphorylation of MTOR, CDKN1A, and CDKN1B was markedly enhanced in response to ca-AKT1 stimulation. As expected, expression of ca-AKT1 markedly attenuated itraconazole-mediated autophagy, indicated by the decreased number of LC3 puncta, reduced levels of LC3-II, and the attenuated formation of BECN1-ATG14-PtdIns3K complexes (Fig. 6A–C; Fig. S8C). Additionally, expression of ca-AKT1 also enhanced cell proliferation in itraconazole-treated cells (Fig. 6D). Interestingly, compared with the repression of autophagy by siBECN1, reactivation of the AKT1-MTOR pathway by ca-AKT1 restored cell viability to a greater extent (Fig. S8D), suggesting that other AKT1-MTOR downstream pathways might also be involved in itraconazole-induced proliferation inhibition. These data support the notion that itraconazole-induced autophagy is due, at least in part, to inhibition of the AKT1-MTOR pathway.
Figure 5. Itraconazole inhibits the AKT1-MTOR pathway. (A) U87 or C6 cells were treated with DMSO, indicated concentrations of itraconazole or 100 nM rapamycin for 36 h. Phosphorylation of MTOR (Ser2448), RPS6KB1 (Ser424 and Thr421), and EIF4EBP1 (Ser65 and Thr70) was examined by immunoblot. Total MTOR, RPS6KB, or EIF4EBP1 respectively was used as the internal control. The data are representative of 3 independent experiments. (B) U87 or C6 cells were treated with DMSO or the indicated concentrations of itraconazole. Phosphorylation of AKT1 (Ser473), CDKN1A (Thr145), and CDKN1B (Thr198) was examined by immunoblot. Total AKT1, CDKN1A, and CDKN1B, respectively was used as the internal control. The data are representative of 3 independent experiments. *P < 0.05; **P < 0.01; ***P < 0.001; Itra, itraconazole; Rapa, rapamycin.
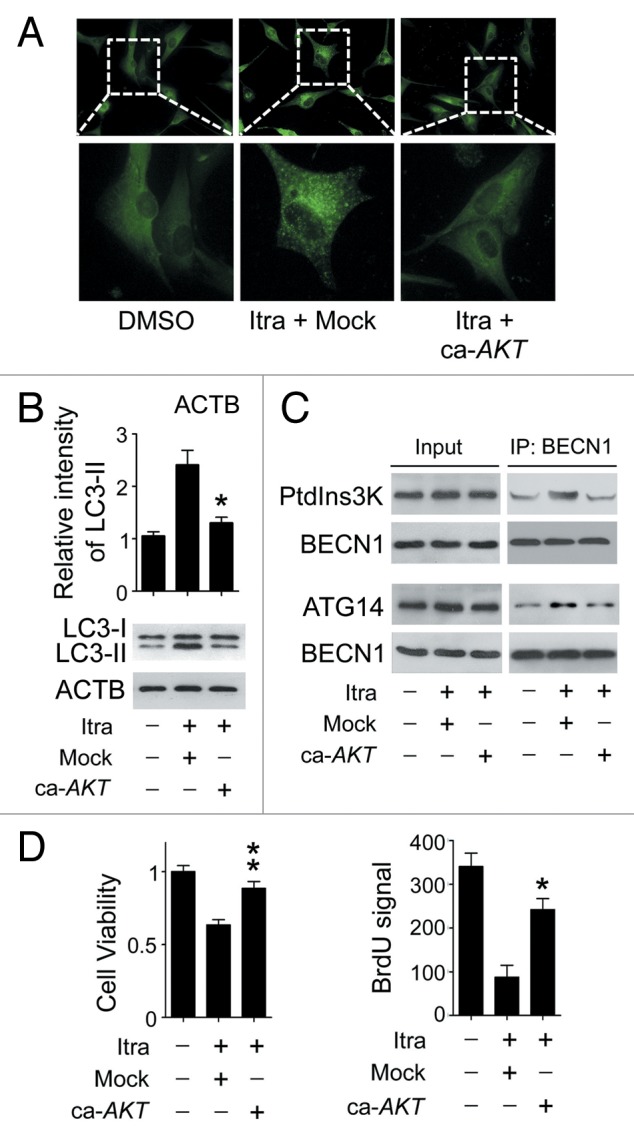
Figure 6. Itraconazole induces autophagy by repressing the AKT1-MTOR pathway. (A) U87 cells were transfected with mock vector or ca-AKT1. Thirty-six hours after transfection, the cells were treated with DMSO or 5 μM itraconazole for another 36 h. Formation of endogenous LC3 puncta were examined by immunofluorescence staining using a fluorescence microscope. The data are representative of 3 independent experiments. (B and C) U87 cells were transfected with mock vector or ca-AKT1. Thirty-six hours after transfection, the cells were treated with DMSO or 5 μM itraconazole for another 36 h. Conversion of LC3-I to LC3-II was examined by immunoblot (B). Interaction between BECN1 and PtdIns3K, or BECN1 and ATG14 was determined by coimmunoprecipitation (C). The data are representative of 3 independent experiments. (D) U87 cells were transfected with mock vector or ca-AKT1. Thirty-six hours after transfection, the cells were treated with DMSO or 5 μM itraconazole for another 36 h. Cell proliferation was examined by the MTT assay (left panel) and the BrdU incorporation assay (right panel). The data are representative of 3 independent experiments for both the MTT assay and BrdU incorporation assays. *P < 0.05; **P < 0.01; Itra, itraconazole.
Itraconazole-induced cholesterol redistribution triggers autophagy via AKT1-MTOR inhibition
Since itraconazole possesses the potential to suppress the biosynthesis of cholesterol, and cholesterol depletion can induce autophagy through AKT1-MTOR inhibition,34,35 we addressed whether itraconazole-induced autophagy was mediated by decreased cholesterol levels. As shown in Figure 7A, treatment with 5 μM itraconazole, which was capable of triggering autophagy (Fig. 2), had no apparent effect on total cholesterol levels, suggesting that itraconazole-induced autophagy in glioblastoma cells is not caused by the reduction of total cellular cholesterol.
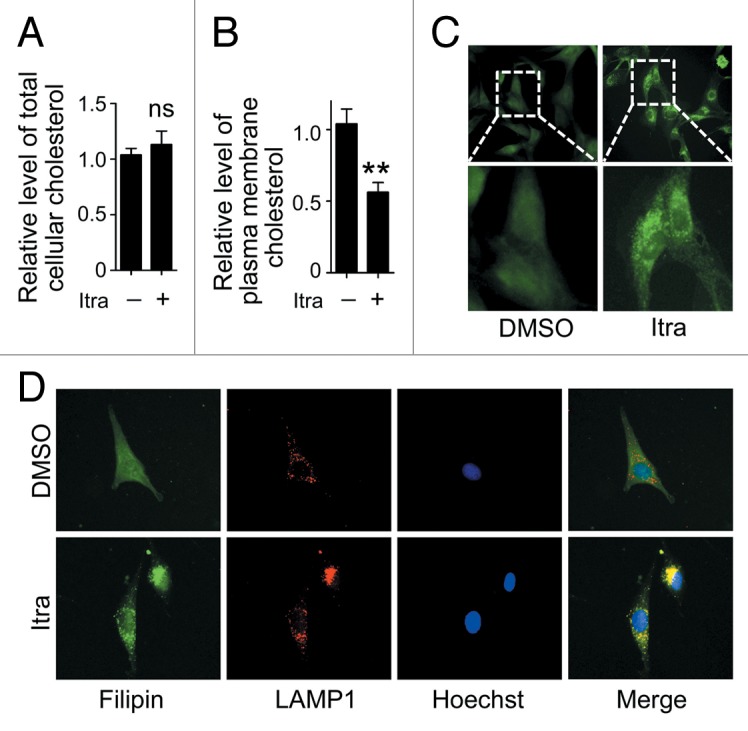
Figure 7. Itraconazole decreases cholesterol content in the plasma membrane. U87 cells were treated with DMSO or 5 μM itraconazole for 36 h. (A) The level of total cellular cholesterol was examined using the Cholesterol Assay Kit. The data are representative of 3 independent experiments. (B) Plasma membrane fraction was isolated by sucrose density gradient centrifugation, and the level of cholesterol on plasma membrane was examined using the Cholesterol Assay Kit. The data are representative of 4 independent experiments. (C) Cytoplasmic cholesterol distribution was examined by filipin staining. The data are representative of 3 independent experiments. (D) Cellular cholesterol distribution was determined by filipin staining coupled with LAMP1 immunofluorescence staining. The data are representative of 3 independent experiments. **P < 0.01; ns, not significant; Itra, itraconazole.
Itraconazole has also been reported to modulate cellular cholesterol distribution, thus resulting in MTOR inhibition.10 Since the plasma membrane is considered to be the major site for cellular cholesterol storage,36 the plasma membrane from itraconazole-treated U87 cells was isolated and the cholesterol content examined. As shown in Figure S9A, the plasma membrane protein ATP1A1 (ATPase, Na+/K+ transporting, α 1 polypeptide), was markedly accumulated in the isolated plasma membrane compared with the whole cell lysate.37 In contrast, both GAPDH (a cytosolic protein) and MT-CO1 (mitochondrially encoded cytochrome c oxidase I; a mitochondrial membrane protein) were rarely detected in the isolated plasma membrane, confirming the purity of the isolated plasma membrane.38,39 Treatment with itraconazole resulted in a marked reduction of plasma membrane cholesterol, compared with the DMSO-treated control group (Fig. 7B). To visualize the localization of cellular cholesterol, filipin, a fluorescent detergent which selectively binds to unesterified cholesterol,36,40 was applied. As shown in Figure 7C, while DMSO-treated control cells demonstrated a diffuse and weak filipin staining, punctate and increased filipin fluorescence signals were observed in the cytoplasm of the U87 cells in response to itraconazole treatment, suggesting accumulation of cholesterol in the cytoplasma. To further determine in which cellular compartments the free cholesterol was trapped, filipin staining was combined with immunofluorescence detection of PDIA (protein disulfide isomerase; a marker for endoplasmic reticulum), CAV1 (caveolin 1, caveolae protein, 22 kDa) or LAMP1 (a marker for late endosomes and lysosomes),10 respectively. As shown in Figure 7D and Figure S9B, a large number of filipin puncta were colocalized with the LAMP1 staining, but not PDIA or CAV1 staining, indicating that cellular cholesterol was probably trapped within the late endosome/lysosome compartment in itraconazole-treated cells. These observations suggest that itraconazole decreases the amount of cholesterol on the plasma membrane by mediating abnormal accumulation of cholesterol in endosomes and lysosomes.
To investigate whether decreased cholesterol on the plasma membrane was associated with itraconazole-induced AKT1-MTOR inhibition and autophagy activation, itraconazole-treated U87 or C6 cells were exposed to the MβCD-cholesterol complex, which can replenish the membrane cholesterol content (Fig. S10A).41-43 Although no apparent effects on rapamycin-mediated inhibition of MTOR signaling pathway were observed (Fig. S10B), the addition of the MβCD-cholesterol complex notably restored the phosphorylation levels of AKT1, MTOR, RPS6KB1, and EIF4EBP1 in itraconazole-treated cells (Fig. 8A, Fig. S11; Fig. S12A). To rule out the possibility of direct physical interaction between the MβCD-cholesterol complex and itraconazole, cells were first treated with itraconazole for 36 h, washed with PBS, and subsequently exposed to the MβCD-cholesterol complex for 4 h. It can be seen that the MβCD-cholesterol complex was still capable of effectively reactivating the AKT1-MTOR signaling pathway (Fig. 8B; Fig. S12B), suggesting that the MβCD-cholesterol complex-mediated rescue of the AKT1-MTOR signaling pathway was not acquired through its direct binding to itraconazole. In agreement with these observations, the MβCD-cholesterol complex markedly attenuated itraconazole-induced autophagy, which was demonstrated by decreased LC3-II expression, a reduced number of LC3 immunofluorescence puncta, and the depressed formation of autophagic vacuoles (Fig. 9A–C; Fig. S13A–S13D).
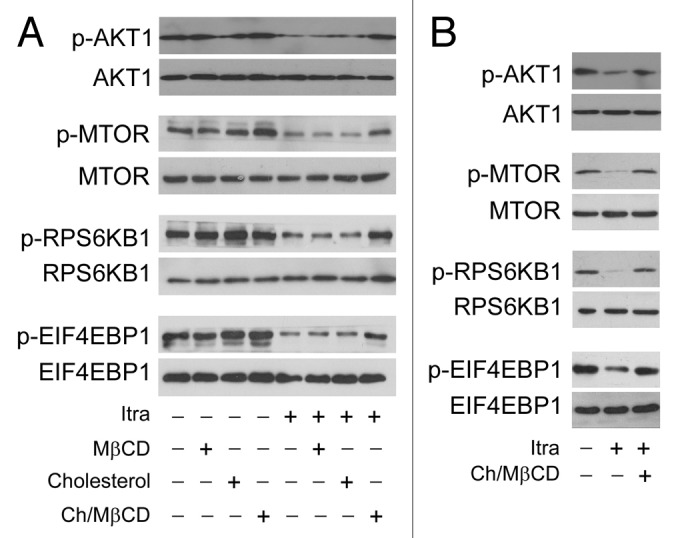
Figure 8. Itraconazole-induced cholesterol redistribution inhibits the AKT1-MTOR pathway. (A) U87 cells were treated with itraconazole (5 μM) in the presence of MβCD (1 mg/ml), cholesterol (20 μg/ml) or the MβCD-cholesterol complex (containing 1 mg/ml MβCD and 20 μg/ml cholesterol) for 36 h. Phosphorylation of AKT1 (Ser473), MTOR (Ser2448), RPS6KB1 (Ser424 and Thr421), and EIF4EBP1 (Ser65 and Thr70) was examined by immunoblot. Total AKT1, MTOR, RPS6KB, or EIF4EBP1 was used as internal control for p-AKT1, p-MTOR, p-RPS6KB, or p-EIF4EBP1, respectively. The data are representative of 3 independent experiments. (B) U87 cells were treated with itraconazole (5 μM) for 36 h, washed with PBS, and then incubated with the MβCD-cholesterol complex (containing 2 mg/ml MβCD and 80 μg/ml cholesterol) for 4 h. Phosphorylation of AKT1 (Ser473), MTOR (Ser2448), RPS6KB1 (Ser424 and Thr421), and EIF4EBP1 (Ser65 and Thr70) was examined by immunoblot. Total AKT1, MTOR, RPS6KB, or EIF4EBP1 was respectively used as internal control. The data are representative of 3 independent experiments. Ch/MβCD, MβCD-cholesterol complex; Itra, itraconazole.
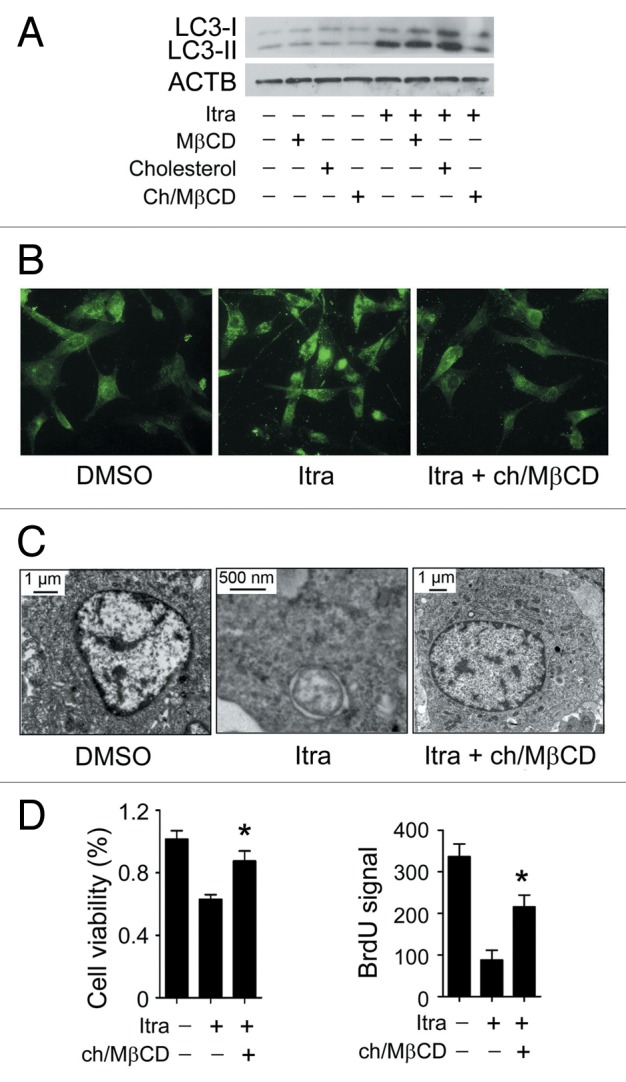
Figure 9. Itraconazole-induced cholesterol redistribution induces autophagy. (A) U87 cells were treated with itraconazole (5 μM) in the presence of MβCD (1 mg/ml), cholesterol (20 μg/ml) or the MβCD-cholesterol complex (containing 1 mg/ml MβCD and 20 μg/ml cholesterol) for 36 h. Conversion of LC3-I to LC3-II was examined by immunoblot. ACTB was used as the internal control for LC3. The data are representative of 3 independent experiments. (B) U87 cells were treated with itraconazole (5 μM) in the presence or absence of the MβCD-cholesterol complex (containing 1 mg/ml MβCD and 20 μg/ml cholesterol) for 36 h. Formation of endogenous LC3 puncta was examined via immunofluorescence staining using a fluorescence microscope. The data are representative of 3 independent experiments. (C) U87 cells were treated with DMSO or 5 μM itraconazole for 36 h in the presence or absence of the MβCD-cholesterol complex (containing 1 mg/ml MβCD and 20 μg/ml cholesterol). The formation of autophagic vacuoles was examined by TEM. The data are representative of 3 independent experiments. (D) U87 cells were treated with itraconazole (5 μM) in the presence or absence of the MβCD-cholesterol complex (containing 1 mg/ml MβCD and 20 μg/ml cholesterol) for 36 h. Cell proliferation was determined by the MTT assay (left panel) or the BrdU incorporation assay (right panel). The data are representative of 4 independent experiments for the MTT assay, and 3 independent experiments for the BrdU incorporation assay. *P < 0.05; Ch/MβCD, MβCD-cholesterol complex; Itra, itraconazole.
As in our pilot study, U18666A, another reagent that stimulated accumulation of cholesterol in the late endosome and lysosome compartments,44 also inhibited cell proliferation of glioblastoma cells (Fig. S13E). We therefore investigated whether itraconazole-mediated cholesterol depletion of the plasma membrane was responsible for its aforementioned antiproliferative effects in glioblastoma cells. To this end, U87 cells were treated with itraconazole in the presence or absence of the MβCD-cholesterol complex. As expected, cell proliferation of itraconazole-treated cells could be noticeably rescued by the addition of the MβCD-cholesterol complex (Fig. 9D). Therefore, our data suggest that itraconazole-mediated AKT1-MTOR inhibition and subsequent autophagy induction can be largely attributed to cholesterol depletion on the plasma membrane.
Itraconazole induces redistribution of cellular cholesterol through repression of SCP2
To explore the mechanisms underlying itraconazole-mediated depletion of cholesterol on the plasma membrane, a 2-dimensional PAGE (2-DE)-based proteomic study was performed to identify the key proteins involved in this process. A total of 24 differentially expressed spots were analyzed by ESI-Q-TOF tandem mass spectrometry, and 26 distinct proteins were identified. Representative paired gels from the 2-DE analyses are shown in Figure S14A. Detailed information of the regulated proteins, including their isoelectric point and molecular weight, are given in Table S1. Cluster analysis was performed using the Cluster software tool (Fig. S14B).
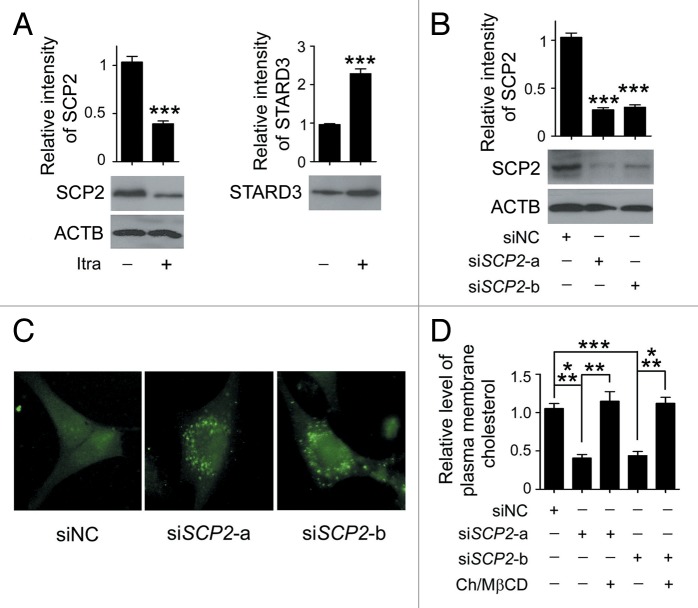
Notably, among the regulated proteins, itraconazole induced a reduced expression of sterol carrier protein X, but elevated expression of STARD3 (StAR-related lipid transfer [START] domain containing 3) (Fig. S14C). The 58-kDa sterol carrier protein X is thought to be the precursor of SCP2 (sterol carrier protein 2) that can be posttranslationally processed to 13-kDa SCP2.45,46 The cleaved SCP2 can bind to cholesterol with high affinity, and is involved in transporting cytoplasmic cholesterol to the plasma membrane.46 STARD3 is a transmembrane protein that shares homology with the cholesterol-binding domain (START domain) of the steroidogenic acute regulatory protein, and participates in cholesterol efflux from late endosomes independently of Niemann-Pick disease, type C1.47 Since aberrant regulation of either SCP2 or STARD3 is sufficient to result in defective cellular cholesterol trafficking and distribution, expression of these 2 proteins in response to itraconazole treatment was further examined by immunoblot analysis. Consistent with our proteomic data, treatment with itraconazole markedly reduced SCP2 expression in a range of glioblastoma cell lines (Fig. 10A; Fig. S15A). However, the expression pattern of STARD3 among the cell lines tested was inconsistent (Fig. 10A; Fig. S15A). SCP2 was therefore selected for further mechanistic studies.
Figure 10. Reduced SCP2 expression induces deprivation of cholesterol in the plasma membrane. (A) U87 cells were treated with DMSO or 5 μM itraconazole for 36 h and the expression of SCP2 and STARD3 was examined by immunoblot. The data are representative of 3 independent experiments. (B) U87 cells were transfected with siNC, siSCP2-a, or siSCP2-b. Expression of SCP2 was examined by immunoblot 72 h after transfection. The data are representative of 3 independent experiments. (C) U87 cells were transfected with siNC, siSCP2-a, or siSCP2-b for 72 h. Cholesterol distribution was examined by filipin staining. The data are representative of 3 independent experiments. (D) U87 cells were transfected with siNC, siSCP2-a, or siSCP2-b. Thirty-six hours after transfection, the cells were incubated with fresh medium or medium containing the MβCD-cholesterol complex (containing 1 mg/ml MβCD and 20 μg/ml cholesterol) for another 36 h. The plasma membrane fraction was isolated by sucrose density gradient centrifugation, and the level of cholesterol in the plasma membrane was examined using the Cholesterol Assay Kit. The data are representative of 3 independent experiments. **P < 0.01; ***P < 0.001; ns, not significant; Ch/MβCD, MβCD-cholesterol complex.
Next, we sought to determine the molecular mechanisms underlying itraconazole-induced SCP2 downregulation. As shown in Figure S15B, the level of SCP2 mRNA was markedly decreased in itraconazole-treated cells compared with control cells. Further, treatment with MG132 (a proteasome inhibitor) or chloroquine (an autophagy inhibitor) showed no apparent effects on itraconazole-induced SCP2 repression (Fig. S15C).48-50 These results indicated that decreased SCP2 expression was likely due to inhibition of SCP2 gene transcription, instead of proteasome- or autophagy-mediated protein degradation.
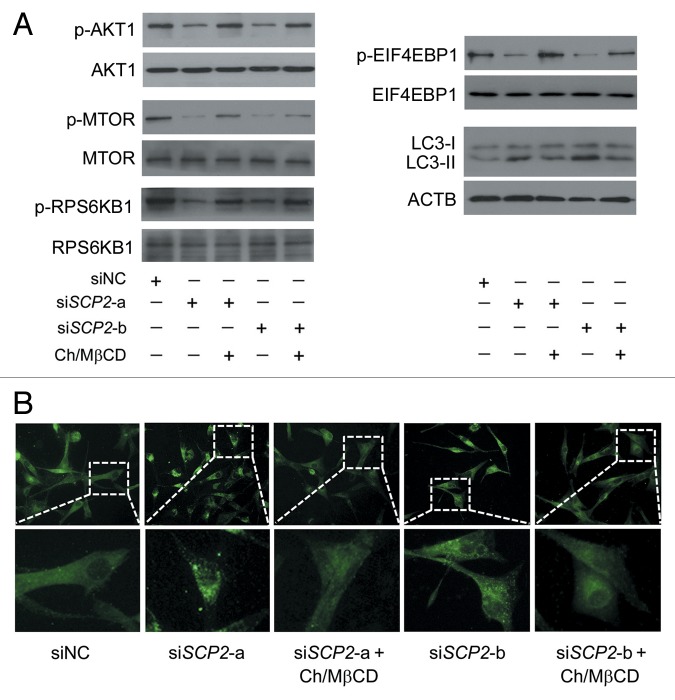
To validate whether repression of SCP2 could mimic itraconazole-induced cellular responses, endogenous SCP2 in U87 cells was knocked down using specific siRNAs (Fig. 10B). Loss of SCP2 induced a marked decrease in plasma membrane cholesterol accompanied by an apparent accumulation of cytoplasmic cholesterol (Fig. 10C and D), which was similar to the distribution pattern of cellular cholesterol observed in itraconazole-treated cells (Fig. 7C). Furthermore, knockdown of SCP2 also resulted in inhibition of the AKT1-MTOR signaling pathway and activation of the autophagy process, both of which could be substantially abolished by treating the cells with the MβCD-cholesterol complex (Fig. 11A and B; Fig. S16A and S16B).
Figure 11. Reduced SCP2 expression inhibits the AKT1-MTOR pathway and induces autophagy. (A) U87 cells were transfected with siNC, siSCP2-a, or siSCP2-b. Thirty-six hours after transfection, the cells were incubated with fresh medium or medium containing the MβCD-cholesterol complex (containing 1 mg/ml MβCD and 20 μg/ml cholesterol) for another 36 h. Phosphorylation of AKT1 (Ser473), MTOR (Ser2448), RPS6KB1 (Ser424 and Thr421), and EIF4EBP1 (Ser65 and Thr70) and conversion of LC3-I to LC3-II were examined by immunoblot. Total AKT1, MTOR, RPS6KB, or EIF4EBP1 was used as internal control for p-AKT1, p-MTOR, p-RPS6KB or p-EIF4EBP1, respectively. ACTB was used as the internal control for LC3. The data are representative of 3 independent experiments. (B) U87 cells were transfected with siNC, siSCP2-a, or siSCP2-b. Thirty-six hours after transfection, the cells were incubated with fresh medium or medium containing the MβCD-cholesterol complex (containing 1 mg/ml MβCD and 20 μg/ml cholesterol) for another 36 h. Formation of endogenous LC3 puncta was examined via immunofluorescence staining using a fluorescence microscope. The data are representative of 3 independent experiments. Ch/MβCD, MβCD-cholesterol complex.
Finally, to determine whether SCP2 was a functional downstream effector of itraconazole, SCP2 was exogenously expressed in itraconazole-treated cells. Expression of SCP2 markedly increased the plasma cholesterol content as well as phosphorylated forms of AKT1, MTOR, RPS6KB1, and EIF4EBP1 in itraconazole-treated cells (Fig. S17; Fig. 12A; Fig. S18A). Accordingly, itraconazole-induced autophagosome formation was significantly reduced upon SCP2 expression (Fig. 12A and B; Fig. S18B). Taken together, these data indicate that itraconazole triggers antiproliferative autophagy in glioblastoma cells by inducing SCP2-associated cellular cholesterol redistribution and subsequent inactivation of the MTOR signaling pathway.
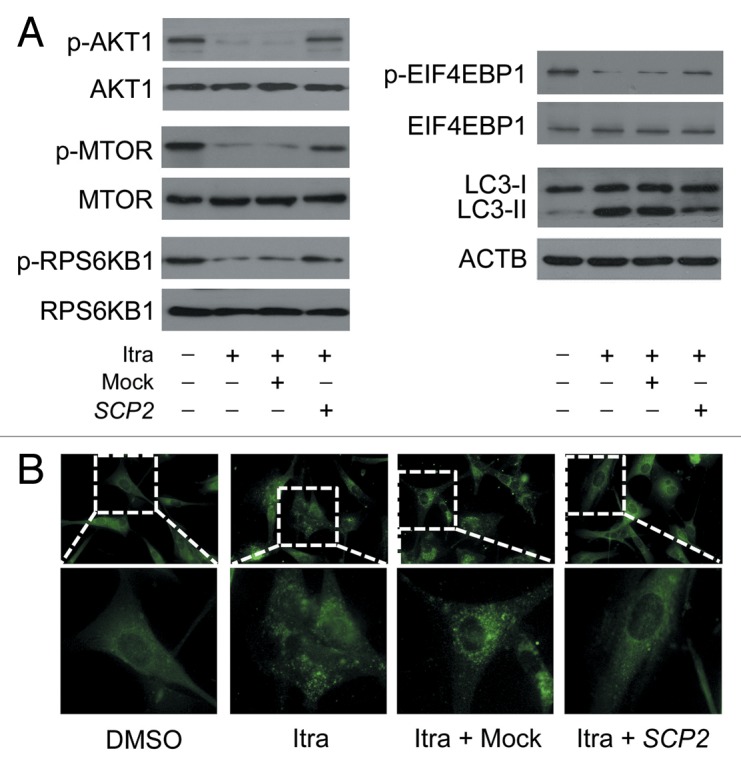
Figure 12. Overexpression of SCP2 attenuates itraconazole-mediated MTOR inhibition and autophagy activation. U87 cells were transfected with mock vector or SCP2 expression plasmid. After 36 h, cells were treated with DMSO or 5 μM itraconazole for another 36 h. (A) Phosphorylation of AKT1 (Ser473), MTOR (Ser2448), RPS6KB1 (Ser424 and Thr421), and EIF4EBP1 (Ser65 and Thr70) and conversion of LC3-I to LC3-II were examined by immunoblot. Total AKT1, MTOR, RPS6KB1, or EIF4EBP1 was used as internal control for p-AKT1, p-MTOR, p-RPS6KB1, or p-EIF4EBP1, respectively. ACTB was used as the internal control for LC3. The data are representative of 3 independent experiments. (B) Formation of endogenous LC3 puncta was examined via immunofluorescence staining using a fluorescence microscope. The data are representative of 3 independent experiments. Itra, itraconazole.
Discussion
Itraconazole, an FDA-approved triazole antifungal agent, is currently being explored as a potential anticancer agent for non-small cell lung cancer, prostate cancer and medulloblastoma.8,51,52 However, the molecular mechanisms underlying itraconazole-mediated suppression of tumor growth have not been clearly determined. Although autophagy is frequently upregulated in tumors as a response to chemotherapy, the precise role of autophagy in regulating cancer cell death or survival remains controversial. In this study, we report a novel apoptosis-independent anticancer effect of itraconazole on glioblastoma cells. Our findings demonstrate that itraconazole-induced autophagy plays an essential role in drug-induced growth arrest in glioblastoma cells.
Inhibition of MTOR is well known as a crucial step for autophagy induction through dephosphorylation of unc-51 like autophagy activating kinase 1 and autophagy-related 13.53 However, autophagy can also be initiated and regulated in an MTOR-independent pathway.54,55 In this study, we found that the MTOR signaling pathway was markedly inhibited in itraconazole-treated cells, which is in line with a previous report.10 Notably, we demonstrated that AKT1, a positive upstream regulator of MTOR, was also inactivated upon itraconazole treatment. Moreover, reactivation of AKT1 by exogenous expression of ca-AKT1 substantially abolished itraconazole-induced autophagy and cell proliferation inhibition, suggesting that AKT1 inactivation likely plays an essential role in itraconazole-mediated antitumor effects.
Besides regulation of the autophagic process, AKT1-MTOR signaling is involved in diverse biological processes, such as cell growth, metabolism, and tumorigenesis.56 Interestingly, our data showed that overexpression of ca-AKT1 enhanced cell proliferation to a greater extent compared with treatment with an autophagy inhibitor alone in the context of itraconazole treatment, suggesting that, besides autophagy, other AKT1-MTOR downstream pathways are involved in itraconazole-induced inhibition of proliferation. Further work will be conducted to elaborate the potential crosstalk between itraconazole-induced autophagy and the complex downstream signaling cascades of AKT1-MTOR.
The correct intracellular distribution of cholesterol among cellular membranes is essential for diverse biological functions of mammalian cells, including signal transduction and membrane trafficking.57-59 During intracellular lipid trafficking, cholesterol is transported from sorting endosomes to late endosomes and lysosomes, from which cholesterol can efflux and reach the plasma membrane.36 In this study, we found that itraconazole induced aberrant cellular compartmentalization, and the redistribution of cellular cholesterol comprised a marked depletion of plasma membrane cholesterol with concomitant accumulation of cytoplasmic cholesterol in late endosomes and lysosomes. Depletion of cholesterol in the plasma membrane represses AKT1 activity by impairing AKT1 phosphorylation at the regulatory sites. Diminished AKT1 activity then results in inhibition of MTOR, activation of autophagy, and suppression of cell proliferation. Intriguingly, replenishment of membrane cholesterol by the MβCD-cholesterol complex resulted in a remarkable attenuation of the itraconazole-induced MTOR inhibition, autophagy activation, and suppression of cell proliferation, indicating that decreased content of cholesterol on the plasma membrane is a critical mediator of the anticancer effect of itraconazole.
Accumulating evidence has indicated that a number of proteins mediate intracellular cholesterol transfer, including CAV1, SCP2, and STARD3.10,47,60,61 Utilizing proteomic analysis, we identified SCP2 as the transfer protein in itraconazole-mediated cholesterol trafficking. SCP2, also called nonspecific lipid transfer protein, enhances cholesterol transfer out of the lysosomal membrane, as well as the regulation of multiple lipid signaling pathways in the plasma membrane.45,46 Our data showed that silencing of SCP2 led to inhibition of MTOR signaling, activation of autophagy, and reduction of plasma membrane cholesterol. Additional experiments further confirmed that these changes could be attenuated in itraconazole-treated cells by SCP2 overexpression, suggesting that SCP2 is a crucial effector in itraconazole-mediated cholesterol redistribution and autophagy.
The importance of autophagy in anticancer therapy has driven an active interest in the development of compounds that can positively or negatively regulate autophagy in cancer cells. This study shows that itraconazole induces autophagy in glioblastoma cells. We have defined the links between itraconazole-mediated cellular cholesterol redistribution and the antiproliferative effects on glioblastoma cells. Furthermore, our findings explain, at least in part, the molecular mechanisms by which itraconazole disrupts normal cellular cholesterol trafficking and inactivates the MTOR signaling pathway. Inhibition of autophagy decreases the cytotoxicity of itraconazole, suggesting that using autophagy-inducing agents may enhance the potential anticancer activity of itraconazole.
Materials and Methods
Cell culture
Human U87 (ATCC, HTB-14), LN-229 (ATCC, CRL-2611), U118 (ATCC, HTB-15), A-172 (ATCC, CRL-1620) glioblastoma cells and rat C6 (ATCC, CCL-107) glioma cells were cultured in Dulbecco Modified Eagle’s Medium (ATCC, 30-2002) or Ham F-12 Nutrient Mixture (Gibco, 11765-054) respectively, supplemented with 10% fetal bovine serum (ATCC, 30-2020), 105 U/L penicillin, and 100 mg/L streptomycin (Sigma, P0781) at 37 °C in an atmosphere containing 5% CO2. Cells were grown to 70% to 80% confluency in dishes or cell culture plates and treated under various conditions as indicated.
Reagents
Rapamycin (Sigma, R8781), MG-132 (Sigma, M7449), U18666A (Sigma, U3633), methyl-β-cyclodextrin (Sigma, C4555), cholesterol (Sigma, C4951), pepstatin A (Sigma, P4265), E64d (Sigma, E8640), and chloroquine (Sigma, C6628) were purchased from Sigma.
Itraconazole (Sigma, I6657) was prepared as a solution in dimethyl sulfoxide (DMSO) for use in in vitro experiments. Itraconazole oral solution for in vivo experiments was obtained from Xi'an Janssen Pharmaceutica Ltd. (H20080401).
SCP2 expression plasmid and the corresponding mock vector were purchased from GeneCopoeia (EX-C0019-M68). The construct of the HA-tagged constitutively active AKT1 was prepared as reported previously.33
Antibodies used in this study were against: BECN1 (Santa Cruz, sc-11427), ACTB (Santa Cruz, sc-69879), BCL2 (Santa Cruz, sc-492), RPS6KB1 (Santa Cruz, sc-9027), p-RPS6KB1 (Santa Cruz, sc-7984-R), EIF4EBP1 (Santa Cruz, sc-6025), p-EIF4EBP1 (Santa Cruz, sc-12884), LAMP1 (Santa Cruz, sc-20011), MTOR (Millipore, 04-385), p-MTOR (Millipore, 09-213), p-MAPK1/3 (Cell Signaling Technology, 4377), MAPK11/12/14 (Cell Signaling Technology, 8690), p-MAPK11/13/14 (Cell Signaling Technology, 4511), PtdIns3K (Cell Signaling Technology, 4263), LC3 (MBL, PM036), ATG14 (MBL, PD026), MAPK1/3 (Abcam, ab79853), PDIA (Abcam, ab2792), MKI67 (Abcam, ab15580), CAV1 (Abcam, ab2910), SCP2 (Santa Cruz, sc-32835), STARD3 (Proteintech, 20292-1-AP), SQSTM1 (Santa Cruz, sc-25575), ATG5 (Abcam, ab78073), AKT1 (Abcam, ab124341), p-AKT1 (Abcam, ab81283), CDKN1A (Abcam, ab7960), p-CDKN1A (Abcam, ab47300), CDKN1B (Abcam, ab7961), p-CDKN1B (Abcam, ab64949), ATP1A1 (Abcam, ab353), MT-CO1 (Abcam, ab14705), HA tag (Santa Cruz, sc-53516) and GAPDH (Abcam, ab8245).
Cell viability assay
Cell viability assay was performed as reported previously with minor modifications.62 Cells were plated in 96-well cell culture plates (3 × 10³ cells/well) and subjected to the indicated treatments for 36 h. Then 20 μl of 3-(4,5-dimethylthiazol-2-yl)-2,5-diphenyltetrazolium bromide (MTT, 5 mg/ml) was added to each well. After 4 h incubation, the medium was removed and 150 μl of DMSO was added to each well to dissolve the crystal formazan dye. Absorbance was measured at 570 nm on an enzyme-linked immunosorbent assay reader. For relative quantification, the value of absorbance in each group was normalized to that in the control group.
TUNEL assay
Terminal deoxynucleotidyl transferase dUTP nick end labeling (TUNEL) assay was performed using the DeadEnd™ Fluorometric TUNEL system (Promega, G3250) as described previously.62 Cells for assay were seeded into 6-well cell culture plates. When the cells reached 70% to 80% confluency, the medium was replaced by fresh culture medium containing indicated concentrations of itraconazole. Cells were washed with PBS (Beyotime, C0221A) twice and fixed in 4% methanol-free formaldehyde solution in PBS for 25 min at 4 °C, followed by permeabilization with 0.2% Triton X-100 (Beyotime, ST795) in PBS for 5 min at room temperature. Staining was according to the manufacturer’s instructions.
Colony formation assay
Colony formation assay was performed as reported previously with minor modifications.63 Briefly, 150 cells (untreated or transfected with siRNAs) were seeded in a 60-mm dish. The cells were continuously cultured in the presence or absence of the indicated concentration of itraconazole for 14 d. Clones were stained with Giemsa (Sigma-Aldrich, 48900-500ML-F) and counted using a microscope. Only those cell clusters containing more than 50 cells were considered as clones.
BrdU assay
BrdU incorporation was assayed using the BrdU Cell Proliferation Assay Kit (Cell Signaling Technology, 6813). Briefly, cells were plated in 96-well cell culture plates (3 × 10³ cells/well) and subjected to the indicated treatments. After treatment, 10 μM BrdU was added to each well, and the cells were incubated for 4 h. BrdU signal was determined by measuring the absorbance at 450 nm.
Immunoblot
Cell samples were lysed with 50 mM Tris-base, 1.0 mM EDTA, 150 mM NaCl, 0.1% SDS, 1% Triton X-100, 1% sodium deoxycholate (Sigma-Aldrich, D6750-25G) and 1 mM phenylmethanesulfonyl fluoride (Sigma-Aldrich, 78830-5G). Proteins (20 to 60 μg) were size-fractionated by 12% SDS-PAGE, and then transferred to PVDF membranes (Millipore, ISEQ00010). After blocking, the membranes were incubated with primary antibodies: LC3 (1:1000), ACTIN (1:1000), SQSTM1 (1:400), BECN1 (1:500), ATG14 (1:1000), BCL2 (1:500), PtdIns3K (1:1000), ATG5 (1:1000), p-MTOR (1:1000), MTOR (1:1000), p-RPS6KB1 (1:500), pRPS6KB1 (1:500), p-EIF4EBP1 (1:500), EIF4EBP1 (1:500), p-MAPK1/3 (1:1000), MAPK1/3 (1:1000), p-MAPK11/13/14 (1:1000), MAPK11/12/14 (1:1000), p-MAPK8/9 (1:1000), MAPK8/9 (1:1000), STARD3 (1:500), SCP2 (1:500), AKT1 (1:1000), p-AKT1 (1:500), CDKN1A (1:1000), p-CDKN1A (1:500), CDKN1B (1:1000), p-CDKN1B (1:500), ATP1A1 (1:1000), HA tag (1:1000), GAPDH (1:2000), and MT-CO1 (1:1000). After washing with Tris-buffered saline containing 0.1% Tween 20 (Beyotime, ST825) (TBST), the blots were probed with secondary antibodies (ZSGB-BIO, ZB-2306, ZB-2305, ZB-2301) for 1 h at room temperature. Target proteins were examined using enhanced chemiluminescence reagents (Millipore, WBKLS0500). Band intensity was determined by densitometry using ImageJ software. The relative intensity of each band was standardized to the corresponding internal control. For relative quantification, the intensity of each band was standardized to the corresponding internal control and normalized to the intensity of the band of control group.
Flow cytometry
For cell cycle analysis, the cells were harvested by trypsinization and fixed in 70% ice-cold ethanol at −20 °C overnight. Cells were then washed with PBS, resuspended in 1 ml PBS containing 50 μg/ml PI (Beyotime, ST512) and 100 μg/ml RNase A (Beyotime, ST576), and incubated at 37 °C for 30 min in the dark. DNA content was determined with an EPICS Elite ESP cell sorting system (Beckman Coulter, Fullerton, CA, USA). For cell death analysis, the cells were harvested and washed once with PBS, then resuspended and incubated in PI-ANXA5 solution (KeyGEN Biotech, KGA108). Flow cytometry was performed with a FACSCalibur flow cytometer (Becton Dickinson, San Jose, CA USA).
Electron microscopy
Electron microscopy analysis was performed as described previously.64-66 Cells were harvested, pelleted, and fixed in paraformaldehyde, 0.1% glutaraldehyde in 0.1 M sodium cacodylate for 2 h, post fixed with 1% OsO4 for 1.5 h, washed and finally stained for 1 h in 3% aqueous uranyl acetate. The samples were then rinsed with water, dehydrated with graded alcohol (50%, 75%, and 95 to 100% alcohol), and embedded in Epon-Araldite resin (Canemco-Marivac, Montreal, PQ, Canada). Ultrathin sections were cut on a Reichert ultramicrotome (Reichert-Jung, Heidelberg, Germany), counterstained with 0.3% lead citrate and examined on an EM420 transmission electron microscope (Philips, Eindhoven, The Netherlands). The cytoplasmic area occupied by the autophagic vacuoles was determined using Image Pro Plus version 3 software.67
Coimmunoprecipitation
Cells were lysed with RIPA buffer (40 mM TRIS-HCl, pH 7.5, 150 mM NaCl, 0.5% Nonidet P-40 [Beyotime, P0013F], protease inhibitors protease inhibitor cocktail [Sigma, P8340], 5% glycerol, 10 mM NaF). Whole cell lysates obtained by centrifugation were incubated with 1 to 4 μg of antibody and Sepharose protein A/protein G beads (Rockland, PAG50-00-0002) overnight at 4 °C. The immune-complexes were then washed 3 times with RIPA buffer and separated by 12% SDS-PAGE for western blot analysis.
Tumor xenograft model
All studies were approved by the Institutional Animal Care and Treatment Committee of Sichuan University. Healthy female nude mice (BALB/c, 6 to 8 wk of age, infertile, 18 to 20 g of weight) were injected subcutaneously with U 87 cells (5 × 10⁶ cells/mouse). When the tumors reached 50 to 70 mm3 in volume (calculated as V = L × W2/2), mice were treated with either hydroxypropyl-cyclodextrin (vehicle control) or itraconazole (75 mg/kg oral twice daily). Animals were sacrificed after 3 wk. Tumor tissues were isolated and frozen in liquid nitrogen or fixed in formalin immediately.
Immunohistochemistry
Immunohistochemistry was performed as reported previously.68-71 Briefly, sections were dewaxed and rehydrated. Antigen retrieval was performed by pretreatment of the slides in citrate-EDTA antigen retrieval solution (Beyotime, P0086) in a microwave oven for 12 min. The slides were incubated with PBS containing 3% hydrogen peroxide for 15 min, PBS containing 5% albumin from bovine serum (Biosharp, BS043C) for 30 min, and subsequently the primary antibody at 4 °C overnight. The slides were then probed with horseradish peroxidase-conjugated secondary antibody (Fuzhou Maixin Biotech, KIT-5030) for 1 h at 37 °C, followed by reaction with diaminobenzidine (Beyotime, ST033) and counterstaining with Mayer hematoxylin (Beyotime, C0107).
To score the immunostaining intensity, at least 8 individual fields were examined and 100 cells were counted in each field. Cells with cytoplasmic LC3 immunoreactivity were considered as positive staining cells. The immunostaining intensity (A) was divided into 4 grades (negative, weak, moderate, and strong), and the score for each grade determined as follows: negative, 0; weak, 1; moderate, 2; strong, 3. The proportion of positive-staining cells (B) was divided into 5 grades (< 5%, 6 to 25%, 26 to 50%, 51 to 75% and > 75%), and the score for each grade determined as follows: < 5%,0; 6 to 25%, 1; 26 to 50%, 2; 51 to 75%, 3; > 75%, 4. The scoring was performed and confirmed by 2 individual experienced pathologists. The final score for each slide was calculated as A × B, as described previously.21,72 The final score for each slide was defined as low expression (0 to 4) or high expression (5 to 12).
Purification of plasma membrane
The plasma membrane fraction was purified according to previous reports with minor modifications.73-75 Cells were washed twice with ice-cold phosphate-buffered saline, scraped, and transferred into 5 ml of sucrose Buffer A (250 mM sucrose, 30 mM histidine, 1 mM EDTA-Na, pH 7.4). The cells were homogenized with a ball-bearing homogenizer. The cell lysates were then centrifuged at 1000 g for 5 min to remove the nuclei, cell debris, or unbroken cells. The supernatants were transferred to ultracentrifuge tubes and centrifuged at 100,000 g for 1 h using a Beckman type 65 rotor (Beckman Coulter, Fullerton, CA). The pellet was resuspended in 1.35 M sucrose and separated via a discontinuous sucrose density gradient (0.25 M, 0.90 M, and 1.35 M) by centrifugation at 350,000 g for 2 h. The fraction from the interface between the 0.9 and 1.35 M sucrose layers was then loaded on top of a linear gradient of 5 to 20% Optiprep (Sigma-Aldrich, D1556-250ML), and subjected to centrifuge at 95,000 g for 18 h. The plasma membrane was harvested from fractions near the top of the gradient. The protein concentration of the plasma membrane sample was determined using the DC protein assay (Bio-Rad, 500-0111). The purity of the plasma membrane sample was examined by immunoblot.
Cholesterol determination
Cholesterol concentration was measured using the Total Cholesterol Assay Kit (Applygen, E1015) according to the manufacturer’s protocol. For relative quantification, the content of membrane cholesterol in each group was normalized to that of the control group.
2-DE and MS/MS analysis
U87 cells were treated with either 5 µM itraconazole or DMSO for 36 h. 2-DE and MS/MS analysis was performed as described previously.76 Briefly, cells were dissolved in lysis buffer (7 M urea [Sigma-Aldrich, U6504-500G], 2 M thiourea [Sigma-Aldrich, 88810-500G], 4% CHAPS [Bio-Rad, 161-0460-MSDS], 100 mM DTT [Bio-Rad, 161-0610-MSDS], 0.2% pH 3–10 ampholyte [Bio-Rad, 163-1113-MSDS]) in the presence of a protease inhibitor (Sigma, P8340). Samples were loaded into IPG strips (17 cm, pH3-10NL; Bio-Rad, 163-2009) using a passive rehydration method, and then subjected to isoelectric focusing (Bio-Rad). The second dimension separation was performed using 12% SDS-PAGE. The gels were stained with CBB R-250 (Bio-Rad, 161-0438-MSDS). Identification and quantitation of protein spots was performed using PDQuest software (Bio-Rad).
In-gel protein digestion was performed using mass spectrometry grade trypsin (Trypsin Gold; Promega, PR-V5280) according to the manufacturer’s instructions. Gel spots were destained with 100 mM NH4HCO3/50% acetonitrile (Sigma-Aldrich, 271004-1L) and dehydrated with 100% ACN. The gels were then incubated with trypsin (Promega, V5280), followed by double extraction with 50% ACN/5% trifluoroacetic acid. The peptide extracts were dried in a speed-VAC concentrator (Thermo Fisher Scientific, Waltham, MA), and subjected to mass spectrometric analysis using a Q-TOF mass spectrometer (Micromass, Manchester, UK) fitted with an ESI source.
Filipin staining
Cells were fixed with 4% (wt/vol) paraformaldehyde in PBS for 30 min and stained with 50 μg/ml filipin (Sigma, F9765) in PBS for 2 h. Images were captured using a fluorescence microscope (Carl Zeiss Microimaging Inc., Thornwood, NY).
Immunofluorescence
Cells were fixed with 4% paraformaldehyde, and then incubated with PBS containing 3% albumin from bovine serum (Biosharp, BS043C) for 30 min. The slides were then probed with primary antibody at 4 °C overnight, and subsequently FITC- or TRITC-conjugated secondary antibodies (ZSGB-BIO, ZF-0311, ZF-0313, ZF-0316) at room temperature for 1 h. Images were captured using a DM2500 fluorescence microscope (LEICA, Wetzlar, Germany).
Semiquantitative RT-PCR
Total RNAs were extracted and purified using Trizol reagent (Invitrogen, 15596-026) following the manufacturer’s instructions. CDNAs were prepared from 1 μg total RNAs using ExScriptTM reagent kit (TAKARA, 6110A) according to the manufacturer’s instructions. The primer sequences were as follows: SCP2, 5′-TCAGCAGTGG ACCAGGCATG TGTTG-3′ (F) and 5′-TGCTTCACTG GCCAAAATTG CTGCT-3′ (R); ACTB, 5′-CGGGAAATCG TGCGTGAC-3′ (F) and 5′-TGGAAGGTGG ACAGCGAGG-3′ (R). The PCR products were analyzed by electrophoresis through 2% agarose gels and visualized by SYBR Gold (Life Technologies, S-11494) staining.
Small RNA interference
ATG5, BECN1, SCP2, and negative control (NC) siRNAs were synthesized by Genephama. The sequences of siRNAs were as follows: human ATG5 siRNA, sense: 5′-GACGUUGGUA ACUGACAAAT T-3′ and antisense: 5′-UUUGUCAGUU ACCAACGUCT T-3′; human BECN1 siRNA, sense: 5′-GGAGCCAUUU AUUGAAACUT T-3′ and antisense: 5′-AGUUUCAAUA AAUGGCUCCT T-3′; human SCP2 siRNA-a sense: 5′-GGAGGAAAGU GGGUCAUAAT T-3′ and antisense: 5′-UUAUGACCCA CUUUCCUCCT T-3′; human SCP2 siRNA-b sense: 5′-GUGCUUCCUA ACUCAGAUAT T-3′ and antisense: 5′-UAUCUGAGUU AGGAAGCACT T-3′. U87 cells were transfected with siRNAs by using Lipofectamine 2000 reagent (Invitrogen, 11668027) according to the manufacturer’s protocol.
Statistical data analysis
Comparisons between the 2 groups were performed by the Student t test. Statistical significance was defined as *P < 0.05; **P < 0.01; ***P < 0.001.
Supplementary Material
Disclosure of Potential Conflicts of Interest
No potential conflicts of interest were disclosed.
Acknowledgment
This work was financially supported by grants from the National 973 Basic Research Program of China (2013CB911300, 2011CB910703), the National Science and Technology Major Project (2012ZX09501001-003), Chinese NSFC (81302205, 81172173, 81225015, and J1103518), doctoral fund from Chinese MOE (20120181110024) and Sichuan Basic Research Program (0040205301A52).
Glossary
Abbreviations:
- 2-DE
2-dimensional polyacrylamide gel electrophoresis
- AKT1
v-akt murine thymoma viral oncogene homolog 1
- ATP1A1
ATPase, Na+/K+ transporting, alpha 1 polypeptide
- ATG5
autophagy-related 5
- ATG14
autophagy-related 14
- AVs
autophagic vacuoles
- BCL2
B-cell CLL/lymphoma 2
- BECN1
Beclin 1
- CAV1
caveolin 1
- CDKN1A
cyclin-dependent kinase inhibitor 1A
- CDKN1B
cyclin-dependent kinase inhibitor 1B
- EIF4EBP1
eukaryotic translation initiation factor 4E binding protein 1
- ER
endoplasmic reticulum
- LAMP1
lysosomal-associated membrane protein 1
- MAPK
mitogen-activated protein kinase
- MβCD
methyl-β-cyclodextrin
- MT-CO1
mitochondrially encoded cytochrome c oxidase I
- MTOR
mechanistic target of rapamycin
- MKI67
marker of proliferation Ki-67
- PDIA
protein disulfide isomerase
- PI
propidium iodide
- RPS6KB1
ribosomal protein S6 kinase, 70 kDa, polypeptide 1
- PtdIns3K
class III phosphatidylinositol 3-kinase
- SCP2
sterol carrier protein 2
References
- 1.Huse JT, Holland E, DeAngelis LM. Glioblastoma: molecular analysis and clinical implications. Annu Rev Med. 2013;64:59–70. doi: 10.1146/annurev-med-100711-143028. [DOI] [PubMed] [Google Scholar]
- 2.Lima FR, Kahn SA, Soletti RC, Biasoli D, Alves T, da Fonseca AC, Garcia C, Romão L, Brito J, Holanda-Afonso R, et al. Glioblastoma: therapeutic challenges, what lies ahead. Biochim Biophys Acta. 2012;1826:338–49. doi: 10.1016/j.bbcan.2012.05.004. [DOI] [PubMed] [Google Scholar]
- 3.Reardon DA, Wen PY. Therapeutic advances in the treatment of glioblastoma: rationale and potential role of targeted agents. Oncologist. 2006;11:152–64. doi: 10.1634/theoncologist.11-2-152. [DOI] [PubMed] [Google Scholar]
- 4.Ohgaki H, Kleihues P. Genetic pathways to primary and secondary glioblastoma. Am J Pathol. 2007;170:1445–53. doi: 10.2353/ajpath.2007.070011. [DOI] [PMC free article] [PubMed] [Google Scholar]
- 5.Wen PY, Kesari S. Malignant gliomas in adults. N Engl J Med. 2008;359:492–507. doi: 10.1056/NEJMra0708126. [DOI] [PubMed] [Google Scholar]
- 6.Panda NK. Itraconazole - a potent antifungal drug. Indian J Otolaryngol Head Neck Surg. 1997;49:293–4. doi: 10.1007/BF02991297. [DOI] [PMC free article] [PubMed] [Google Scholar]
- 7.Aftab BT, Dobromilskaya I, Liu JO, Rudin CM. Itraconazole inhibits angiogenesis and tumor growth in non-small cell lung cancer. Cancer Res. 2011;71:6764–72. doi: 10.1158/0008-5472.CAN-11-0691. [DOI] [PMC free article] [PubMed] [Google Scholar]
- 8.Kim J, Tang JY, Gong R, Kim J, Lee JJ, Clemons KV, Chong CR, Chang KS, Fereshteh M, Gardner D, et al. Itraconazole, a commonly used antifungal that inhibits Hedgehog pathway activity and cancer growth. Cancer Cell. 2010;17:388–99. doi: 10.1016/j.ccr.2010.02.027. [DOI] [PMC free article] [PubMed] [Google Scholar]
- 9.Chong CR, Xu J, Lu J, Bhat S, Sullivan DJ, Jr., Liu JO. Inhibition of angiogenesis by the antifungal drug itraconazole. ACS Chem Biol. 2007;2:263–70. doi: 10.1021/cb600362d. [DOI] [PubMed] [Google Scholar]
- 10.Xu J, Dang Y, Ren YR, Liu JO. Cholesterol trafficking is required for mTOR activation in endothelial cells. Proc Natl Acad Sci U S A. 2010;107:4764–9. doi: 10.1073/pnas.0910872107. [DOI] [PMC free article] [PubMed] [Google Scholar]
- 11.Tasdemir E, Maiuri MC, Galluzzi L, Vitale I, Djavaheri-Mergny M, D’Amelio M, Criollo A, Morselli E, Zhu C, Harper F, et al. Regulation of autophagy by cytoplasmic p53. Nat Cell Biol. 2008;10:676–87. doi: 10.1038/ncb1730. [DOI] [PMC free article] [PubMed] [Google Scholar]
- 12.He C, Klionsky DJ. Regulation mechanisms and signaling pathways of autophagy. Annu Rev Genet. 2009;43:67–93. doi: 10.1146/annurev-genet-102808-114910. [DOI] [PMC free article] [PubMed] [Google Scholar]
- 13.Scarlatti F, Bauvy C, Ventruti A, Sala G, Cluzeaud F, Vandewalle A, Ghidoni R, Codogno P. Ceramide-mediated macroautophagy involves inhibition of protein kinase B and up-regulation of beclin 1. J Biol Chem. 2004;279:18384–91. doi: 10.1074/jbc.M313561200. [DOI] [PubMed] [Google Scholar]
- 14.Shao Y, Gao Z, Marks PA, Jiang X. Apoptotic and autophagic cell death induced by histone deacetylase inhibitors. Proc Natl Acad Sci U S A. 2004;101:18030–5. doi: 10.1073/pnas.0408345102. [DOI] [PMC free article] [PubMed] [Google Scholar]
- 15.Takeuchi H, Kondo Y, Fujiwara K, Kanzawa T, Aoki H, Mills GB, Kondo S. Synergistic augmentation of rapamycin-induced autophagy in malignant glioma cells by phosphatidylinositol 3-kinase/protein kinase B inhibitors. Cancer Res. 2005;65:3336–46. doi: 10.1158/0008-5472.CAN-04-3640. [DOI] [PubMed] [Google Scholar]
- 16.Chen N, Karantza-Wadsworth V. Role and regulation of autophagy in cancer. Biochim Biophys Acta. 2009;1793:1516–23. doi: 10.1016/j.bbamcr.2008.12.013. [DOI] [PMC free article] [PubMed] [Google Scholar]
- 17.Kondo Y, Kondo S. Autophagy and cancer therapy. Autophagy. 2006;2:85–90. doi: 10.4161/auto.2.2.2463. [DOI] [PubMed] [Google Scholar]
- 18.Yang ZJ, Chee CE, Huang S, Sinicrope FA. The role of autophagy in cancer: therapeutic implications. Mol Cancer Ther. 2011;10:1533–41. doi: 10.1158/1535-7163.MCT-11-0047. [DOI] [PMC free article] [PubMed] [Google Scholar]
- 19.Carew JS, Kelly KR, Nawrocki ST. Autophagy as a target for cancer therapy: new developments. Cancer Manag Res. 2012;4:357–65. doi: 10.2147/CMAR.S26133. [DOI] [PMC free article] [PubMed] [Google Scholar]
- 20.Rikiishi H. Novel Insights into the Interplay between Apoptosis and Autophagy. Int J Cell Biol. 2012;2012:317645. doi: 10.1155/2012/317645. [DOI] [PMC free article] [PubMed] [Google Scholar]
- 21.Li Z, Zhao X, Bai S, Wang Z, Chen L, Wei Y, Huang C. Proteomics identification of cyclophilin a as a potential prognostic factor and therapeutic target in endometrial carcinoma. Mol Cell Proteomics. 2008;7:1810–23. doi: 10.1074/mcp.M700544-MCP200. [DOI] [PMC free article] [PubMed] [Google Scholar]
- 22.Simonsen A, Tooze SA. Coordination of membrane events during autophagy by multiple class III PI3-kinase complexes. J Cell Biol. 2009;186:773–82. doi: 10.1083/jcb.200907014. [DOI] [PMC free article] [PubMed] [Google Scholar]
- 23.Pattingre S, Tassa A, Qu X, Garuti R, Liang XH, Mizushima N, Packer M, Schneider MD, Levine B. Bcl-2 antiapoptotic proteins inhibit Beclin 1-dependent autophagy. Cell. 2005;122:927–39. doi: 10.1016/j.cell.2005.07.002. [DOI] [PubMed] [Google Scholar]
- 24.Jung CH, Ro SH, Cao J, Otto NM, Kim DH. mTOR regulation of autophagy. FEBS Lett. 2010;584:1287–95. doi: 10.1016/j.febslet.2010.01.017. [DOI] [PMC free article] [PubMed] [Google Scholar]
- 25.Jung CH, Jun CB, Ro SH, Kim YM, Otto NM, Cao J, Kundu M, Kim DH. ULK-Atg13-FIP200 complexes mediate mTOR signaling to the autophagy machinery. Mol Biol Cell. 2009;20:1992–2003. doi: 10.1091/mbc.E08-12-1249. [DOI] [PMC free article] [PubMed] [Google Scholar]
- 26.Chen Y, McMillan-Ward E, Kong J, Israels SJ, Gibson SB. Mitochondrial electron-transport-chain inhibitors of complexes I and II induce autophagic cell death mediated by reactive oxygen species. J Cell Sci. 2007;120:4155–66. doi: 10.1242/jcs.011163. [DOI] [PubMed] [Google Scholar]
- 27.Schmelzle T, Hall MN. TOR, a central controller of cell growth. Cell. 2000;103:253–62. doi: 10.1016/S0092-8674(00)00117-3. [DOI] [PubMed] [Google Scholar]
- 28.Liang J, Zubovitz J, Petrocelli T, Kotchetkov R, Connor MK, Han K, Lee JH, Ciarallo S, Catzavelos C, Beniston R, et al. PKB/Akt phosphorylates p27, impairs nuclear import of p27 and opposes p27-mediated G1 arrest. Nat Med. 2002;8:1153–60. doi: 10.1038/nm761. [DOI] [PubMed] [Google Scholar]
- 29.Zhou BP, Liao Y, Xia W, Spohn B, Lee MH, Hung MC. Cytoplasmic localization of p21Cip1/WAF1 by Akt-induced phosphorylation in HER-2/neu-overexpressing cells. Nat Cell Biol. 2001;3:245–52. doi: 10.1038/35060032. [DOI] [PubMed] [Google Scholar]
- 30.Sridharan S, Jain K, Basu A. Regulation of autophagy by kinases. Cancers (Basel) 2011;3:2630–54. doi: 10.3390/cancers3022630. [DOI] [PMC free article] [PubMed] [Google Scholar]
- 31.Webber JL. Regulation of autophagy by p38α MAPK. Autophagy. 2010;6:292–3. doi: 10.4161/auto.6.2.11128. [DOI] [PubMed] [Google Scholar]
- 32.Bodine SC, Stitt TN, Gonzalez M, Kline WO, Stover GL, Bauerlein R, Zlotchenko E, Scrimgeour A, Lawrence JC, Glass DJ, et al. Akt/mTOR pathway is a crucial regulator of skeletal muscle hypertrophy and can prevent muscle atrophy in vivo. Nat Cell Biol. 2001;3:1014–9. doi: 10.1038/ncb1101-1014. [DOI] [PubMed] [Google Scholar]
- 33.Kohn AD, Takeuchi F, Roth RA. Akt, a pleckstrin homology domain containing kinase, is activated primarily by phosphorylation. J Biol Chem. 1996;271:21920–6. doi: 10.1074/jbc.271.36.21920. [DOI] [PubMed] [Google Scholar]
- 34.Schneider B, Gerdsen R, Plat J, Dullens S, Björkhem I, Diczfalusy U, Neuvonen PJ, Bieber T, von Bergmann K, Lütjohann D. Effects of high-dose itraconazole treatment on lipoproteins in men. Int J Clin Pharmacol Ther. 2007;45:377–84. doi: 10.5414/CPP45377. [DOI] [PubMed] [Google Scholar]
- 35.Cheng J, Ohsaki Y, Tauchi-Sato K, Fujita A, Fujimoto T. Cholesterol depletion induces autophagy. Biochem Biophys Res Commun. 2006;351:246–52. doi: 10.1016/j.bbrc.2006.10.042. [DOI] [PubMed] [Google Scholar]
- 36.Maxfield FR, Wüstner D. Intracellular cholesterol transport. J Clin Invest. 2002;110:891–8. doi: 10.1172/JCI0216500. [DOI] [PMC free article] [PubMed] [Google Scholar]
- 37.Bivona TG, Wiener HH, Ahearn IM, Silletti J, Chiu VK, Philips MR. Rap1 up-regulation and activation on plasma membrane regulates T cell adhesion. J Cell Biol. 2004;164:461–70. doi: 10.1083/jcb.200311093. [DOI] [PMC free article] [PubMed] [Google Scholar]
- 38.Zhang B, Srirangam A, Potter DA, Roman A. HPV16 E5 protein disrupts the c-Cbl-EGFR interaction and EGFR ubiquitination in human foreskin keratinocytes. Oncogene. 2005;24:2585–8. doi: 10.1038/sj.onc.1208453. [DOI] [PMC free article] [PubMed] [Google Scholar]
- 39.Chaudhuri D, Sancak Y, Mootha VK, Clapham DE. MCU encodes the pore conducting mitochondrial calcium currents. Elife. 2013;2:e00704. doi: 10.7554/eLife.00704. [DOI] [PMC free article] [PubMed] [Google Scholar]
- 40.Katzenstein IP, Spielvogel AM, Norman AW. Stoichiometry of interaction of the polyene antibiotic, filipin, with free and liposomal-bound cholesterol. J Antibiot (Tokyo) 1974;27:943–51. doi: 10.7164/antibiotics.27.943. [DOI] [PubMed] [Google Scholar]
- 41.Klein U, Gimpl G, Fahrenholz F. Alteration of the myometrial plasma membrane cholesterol content with beta-cyclodextrin modulates the binding affinity of the oxytocin receptor. Biochemistry. 1995;34:13784–93. doi: 10.1021/bi00042a009. [DOI] [PubMed] [Google Scholar]
- 42.Winegar DA, Salisbury JA, Sundseth SS, Hawke RL. Effects of cyclosporin on cholesterol 27-hydroxylation and LDL receptor activity in HepG2 cells. J Lipid Res. 1996;37:179–91. [PubMed] [Google Scholar]
- 43.Awad AB, Chen YC, Fink CS, Hennessey T. beta-Sitosterol inhibits HT-29 human colon cancer cell growth and alters membrane lipids. Anticancer Res. 1996;16(5A):2797–804. [PubMed] [Google Scholar]
- 44.Roff CF, Goldin E, Comly ME, Cooney A, Brown A, Vanier MT, Miller SP, Brady RO, Pentchev PG. Type C Niemann-Pick disease: use of hydrophobic amines to study defective cholesterol transport. Dev Neurosci. 1991;13:315–9. doi: 10.1159/000112179. [DOI] [PubMed] [Google Scholar]
- 45.Gallegos AM, Atshaves BP, Storey SM, Starodub O, Petrescu AD, Huang H, McIntosh AL, Martin GG, Chao H, Kier AB, et al. Gene structure, intracellular localization, and functional roles of sterol carrier protein-2. Prog Lipid Res. 2001;40:498–563. doi: 10.1016/S0163-7827(01)00015-7. [DOI] [PubMed] [Google Scholar]
- 46.Puglielli L, Rigotti A, Greco AV, Santos MJ, Nervi F. Sterol carrier protein-2 is involved in cholesterol transfer from the endoplasmic reticulum to the plasma membrane in human fibroblasts. J Biol Chem. 1995;270:18723–6. doi: 10.1074/jbc.270.32.18723. [DOI] [PubMed] [Google Scholar]
- 47.Hölttä-Vuori M, Alpy F, Tanhuanpää K, Jokitalo E, Mutka AL, Ikonen E. MLN64 is involved in actin-mediated dynamics of late endocytic organelles. Mol Biol Cell. 2005;16:3873–86. doi: 10.1091/mbc.E04-12-1105. [DOI] [PMC free article] [PubMed] [Google Scholar]
- 48.Liu J, Xia H, Kim M, Xu L, Li Y, Zhang L, Cai Y, Norberg HV, Zhang T, Furuya T, et al. Beclin1 controls the levels of p53 by regulating the deubiquitination activity of USP10 and USP13. Cell. 2011;147:223–34. doi: 10.1016/j.cell.2011.08.037. [DOI] [PMC free article] [PubMed] [Google Scholar]
- 49.Hrecka K, Hao C, Gierszewska M, Swanson SK, Kesik-Brodacka M, Srivastava S, Florens L, Washburn MP, Skowronski J. Vpx relieves inhibition of HIV-1 infection of macrophages mediated by the SAMHD1 protein. Nature. 2011;474:658–61. doi: 10.1038/nature10195. [DOI] [PMC free article] [PubMed] [Google Scholar]
- 50.Rao R, Balusu R, Fiskus W, Mudunuru U, Venkannagari S, Chauhan L, Smith JE, Hembruff SL, Ha K, Atadja P, et al. Combination of pan-histone deacetylase inhibitor and autophagy inhibitor exerts superior efficacy against triple-negative human breast cancer cells. Mol Cancer Ther. 2012;11:973–83. doi: 10.1158/1535-7163.MCT-11-0979. [DOI] [PubMed] [Google Scholar]
- 51.Rudin CM, Brahmer JR, Juergens RA, Hann CL, Ettinger DS, Sebree R, Smith R, Aftab BT, Huang P, Liu JO. Phase 2 study of pemetrexed and itraconazole as second-line therapy for metastatic nonsquamous non-small-cell lung cancer. J Thorac Oncol. 2013;8:619–23. doi: 10.1097/JTO.0b013e31828c3950. [DOI] [PMC free article] [PubMed] [Google Scholar]
- 52.Antonarakis ES, Heath EI, Smith DC, Rathkopf D, Blackford AL, Danila DC, King S, Frost A, Ajiboye AS, Zhao M, et al. Repurposing itraconazole as a treatment for advanced prostate cancer: a noncomparative randomized phase II trial in men with metastatic castration-resistant prostate cancer. Oncologist. 2013;18:163–73. doi: 10.1634/theoncologist.2012-314. [DOI] [PMC free article] [PubMed] [Google Scholar]
- 53.Kroemer G, Mariño G, Levine B. Autophagy and the integrated stress response. Mol Cell. 2010;40:280–93. doi: 10.1016/j.molcel.2010.09.023. [DOI] [PMC free article] [PubMed] [Google Scholar]
- 54.Matsui Y, Takagi H, Qu X, Abdellatif M, Sakoda H, Asano T, Levine B, Sadoshima J. Distinct roles of autophagy in the heart during ischemia and reperfusion: roles of AMP-activated protein kinase and Beclin 1 in mediating autophagy. Circ Res. 2007;100:914–22. doi: 10.1161/01.RES.0000261924.76669.36. [DOI] [PubMed] [Google Scholar]
- 55.Mammucari C, Milan G, Romanello V, Masiero E, Rudolf R, Del Piccolo P, Burden SJ, Di Lisi R, Sandri C, Zhao J, et al. FoxO3 controls autophagy in skeletal muscle in vivo. Cell Metab. 2007;6:458–71. doi: 10.1016/j.cmet.2007.11.001. [DOI] [PubMed] [Google Scholar]
- 56.Zoncu R, Efeyan A, Sabatini DM. mTOR: from growth signal integration to cancer, diabetes and ageing. Nat Rev Mol Cell Biol. 2011;12:21–35. doi: 10.1038/nrm3025. [DOI] [PMC free article] [PubMed] [Google Scholar]
- 57.Incardona JP, Eaton S. Cholesterol in signal transduction. Curr Opin Cell Biol. 2000;12:193–203. doi: 10.1016/S0955-0674(99)00076-9. [DOI] [PubMed] [Google Scholar]
- 58.Puri V, Watanabe R, Dominguez M, Sun X, Wheatley CL, Marks DL, Pagano RE. Cholesterol modulates membrane traffic along the endocytic pathway in sphingolipid-storage diseases. Nat Cell Biol. 1999;1:386–8. doi: 10.1038/14084. [DOI] [PubMed] [Google Scholar]
- 59.Calay D, Vind-Kezunovic D, Frankart A, Lambert S, Poumay Y, Gniadecki R. Inhibition of Akt signaling by exclusion from lipid rafts in normal and transformed epidermal keratinocytes. J Invest Dermatol. 2010;130:1136–45. doi: 10.1038/jid.2009.415. [DOI] [PubMed] [Google Scholar]
- 60.Zanlungo S, Amigo L, Mendoza H, Miquel JF, Vío C, Glick JM, Rodríguez A, Kozarsky K, Quiñones V, Rigotti A, et al. Sterol carrier protein 2 gene transfer changes lipid metabolism and enterohepatic sterol circulation in mice. Gastroenterology. 2000;119:1708–19. doi: 10.1053/gast.2000.20198. [DOI] [PubMed] [Google Scholar]
- 61.Schroeder F, Gallegos AM, Atshaves BP, Storey SM, McIntosh AL, Petrescu AD, Huang H, Starodub O, Chao H, Yang H, et al. Recent advances in membrane microdomains: rafts, caveolae, and intracellular cholesterol trafficking. Exp Biol Med (Maywood) 2001;226:873–90. doi: 10.1177/153537020122601002. [DOI] [PubMed] [Google Scholar]
- 62.Tong A, Zhang H, Li Z, Gou L, Wang Z, Wei H, Tang M, Liang S, Chen L, Huang C, et al. Proteomic analysis of liver cancer cells treated with suberonylanilide hydroxamic acid. Cancer Chemother Pharmacol. 2008;61:791–802. doi: 10.1007/s00280-007-0536-2. [DOI] [PubMed] [Google Scholar]
- 63.Wang Z, Jiang L, Huang C, Li Z, Chen L, Gou L, Chen P, Tong A, Tang M, Gao F, et al. Comparative proteomics approach to screening of potential diagnostic and therapeutic targets for oral squamous cell carcinoma. Mol Cell Proteomics. 2008;7:1639–50. doi: 10.1074/mcp.M700520-MCP200. [DOI] [PMC free article] [PubMed] [Google Scholar]
- 64.Li J, Liu R, Lei Y, Wang K, Lau QC, Xie N, Zhou S, Nie C, Chen L, Wei Y, et al. Proteomic analysis revealed association of aberrant ROS signaling with suberoylanilide hydroxamic acid-induced autophagy in Jurkat T-leukemia cells. Autophagy. 2010;6:711–24. doi: 10.4161/auto.6.6.12397. [DOI] [PubMed] [Google Scholar]
- 65.Fischer CL, Walters KS, Drake DR, Dawson DV, Blanchette DR, Brogden KA, Wertz PW. Oral mucosal lipids are antibacterial against Porphyromonas gingivalis, induce ultrastructural damage, and alter bacterial lipid and protein compositions. Int J Oral Sci. 2013;5:130–40. doi: 10.1038/ijos.2013.28. [DOI] [PMC free article] [PubMed] [Google Scholar]
- 66.Zituni D, Schütt-Gerowitt H, Kopp M, Krönke M, Addicks K, Hoffmann C, Hellmich M, Faber F, Niedermeier W. The growth of Staphylococcus aureus and Escherichia coli in low-direct current electric fields. Int J Oral Sci. 2014;6:7–14. doi: 10.1038/ijos.2013.64. [DOI] [PMC free article] [PubMed] [Google Scholar]
- 67.Paglin S, Lee NY, Nakar C, Fitzgerald M, Plotkin J, Deuel B, Hackett N, McMahill M, Sphicas E, Lampen N, et al. Rapamycin-sensitive pathway regulates mitochondrial membrane potential, autophagy, and survival in irradiated MCF-7 cells. Cancer Res. 2005;65:11061–70. doi: 10.1158/0008-5472.CAN-05-1083. [DOI] [PubMed] [Google Scholar]
- 68.Liu R, Li J, Xie K, Zhang T, Lei Y, Chen Y, Zhang L, Huang K, Wang K, Wu H, et al. FGFR4 promotes stroma-induced epithelial-to-mesenchymal transition in colorectal cancer. Cancer Res. 2013;73:5926–35. doi: 10.1158/0008-5472.CAN-12-4718. [DOI] [PubMed] [Google Scholar]
- 69.Kobayashi H, Kumagai K, Gotoh A, Eguchi T, Yamada H, Hamada Y, Suzuki S, Suzuki R. Upregulation of epidermal growth factor receptor 4 in oral leukoplakia. Int J Oral Sci. 2013;5:14–20. doi: 10.1038/ijos.2013.10. [DOI] [PMC free article] [PubMed] [Google Scholar]
- 70.Guo J, Chen H, Wang Y, Cao CB, Guan GQ. A novel porcine acellular dermal matrix scaffold used in periodontal regeneration. Int J Oral Sci. 2013;5:37–43. doi: 10.1038/ijos.2013.1. [DOI] [PMC free article] [PubMed] [Google Scholar]
- 71.Jiang WP, Sima ZH, Wang HC, Zhang JY, Sun LS, Chen F, Li TJ. Identification of the involvement of LOXL4 in generation of keratocystic odontogenic tumors by RNA-Seq analysis. Int J Oral Sci. 2014;6:31–8. doi: 10.1038/ijos.2013.96. [DOI] [PMC free article] [PubMed] [Google Scholar]
- 72.Feng YZ, Shiozawa T, Miyamoto T, Kashima H, Kurai M, Suzuki A, Ying-Song J, Konishi I. Overexpression of hedgehog signaling molecules and its involvement in the proliferation of endometrial carcinoma cells. Clin Cancer Res. 2007;13:1389–98. doi: 10.1158/1078-0432.CCR-06-1407. [DOI] [PubMed] [Google Scholar]
- 73.Tziakas DN, Kaski JC, Chalikias GK, Romero C, Fredericks S, Tentes IK, Kortsaris AX, Hatseras DI, Holt DW. Total cholesterol content of erythrocyte membranes is increased in patients with acute coronary syndrome: a new marker of clinical instability? J Am Coll Cardiol. 2007;49:2081–9. doi: 10.1016/j.jacc.2006.08.069. [DOI] [PubMed] [Google Scholar]
- 74.Yamada S, Lieber CS. Decrease in microviscosity and cholesterol content of rat liver plasma membranes after chronic ethanol feeding. J Clin Invest. 1984;74:2285–9. doi: 10.1172/JCI111656. [DOI] [PMC free article] [PubMed] [Google Scholar]
- 75.Chen Y, Cai T, Wang H, Li Z, Loreaux E, Lingrel JB, Xie Z. Regulation of intracellular cholesterol distribution by Na/K-ATPase. J Biol Chem. 2009;284:14881–90. doi: 10.1074/jbc.M109.003574. [DOI] [PMC free article] [PubMed] [Google Scholar]
- 76.Tong A, Gou L, Lau QC, Chen B, Zhao X, Li J, Tang H, Chen L, Tang M, Huang C, et al. Proteomic profiling identifies aberrant epigenetic modifications induced by hepatitis B virus X protein. J Proteome Res. 2009;8:1037–46. doi: 10.1021/pr8008622. [DOI] [PubMed] [Google Scholar]
Associated Data
This section collects any data citations, data availability statements, or supplementary materials included in this article.


