

Abstract
Association studies of candidate genes with complex traits have generally used one or a few single nucleotide polymorphisms (SNPs), although variation in the extent of linkage disequilibrium (LD) within genes markedly influences the sensitivity and precision of association studies. The extent of LD and the underlying haplotype structure for most candidate genes are still unavailable. We sampled 193 blacks (African-Americans) and 160 whites (European-Americans) and estimated the intragenic LD and the haplotype structure in four genes of the renin–angiotensin system. We genotyped 25 SNPs, with all but one of the pairs spaced between 1 and 20 kb, thus providing resolution at small scale. The pattern of LD within a gene was very heterogeneous. Using a robust method to define haplotype blocks, blocks of limited haplotype diversity were identified at each locus; between these blocks, LD was lost owing to the history of recombination events. As anticipated, there was less LD among blacks, the number of haplotypes was substantially larger, and shorter haplotype segments were found, compared with whites. These findings have implications for candidate-gene association studies and indicate that variation between populations of European and African origin in haplotype diversity is characteristic of most genes.
[The sequence data described in this paper are available in GenBank under the following accession nos: AGT, MIM 106150; Renin, MIM 179820; ACE, MIM 106180; Angiotensin receptor I, MIM 106165. Supplementary material is available online at http://www.genome.org.]
The pattern of linkage disequilibrium (LD) at a locus has important implications for disease gene mapping using comparisons of allele frequencies in affected and unaffected individuals (Lander and Schork 1994; Jorde 2000; Risch 2000; Abecasis et al. 2001). Virtually all association studies conducted for complex phenotypes use only one marker, either a single nucleotide polymorphism (SNP) or an Alu element. The adequacy of this design depends critically on the extent of LD within the gene or region being investigated, and which SNP is used for analysis. The inability to take population-genetics architecture into account probably contributes to the inconsistent and disappointing results seen in complex-trait association studies.
Estimates of the extent of LD across the human genome vary considerably (Tishkoff et al. 1996; Kruglyak 1999; Dunning et al. 2000; Taillon-Miller et al. 2000; Abecasis et al. 2001; Reich et al. 2001). Substantial heterogeneity has been observed across various regions; many features, including biological and stochastic factors, likely contribute to this phenomenon (Taillon-Miller et al. 2000; Abecasis et al. 2001; Reich et al. 2001). Because LD also reflects the history of a population in terms of age and the number of founders, it would also be anticipated that different populations would have different patterns. In particular, shorter LDs and greater haplotype diversity have been seen in human African-origin populations (Chakravarti et al. 1984; Zhu et al. 2000; Reich et al. 2001). Reich et al. (2001) recently examined 19 randomly selected genomic regions spanning 160 kb in a sample of Swedes and Nigerians. Among Europeans, the half-length of LD, which is considered a useful minimum for association studies, was 60 kb, whereas it was only 5 kb for the Africans (Reich et al. 2001). These results are consistent with the previous reports of greater genetic diversity among Africans, both at the level of individual polymorphisms and haplotypes (Cargill et al. 1999; Halushka et al. 1999; Rieder et al. 1999).
Recent investigations of global haplotype patterns demonstrate that pronounced haplotype structure on “blocks” exists in the human genome (Daly et al. 2001; Johnson et al. 2001; Patil et al. 2001). By considering haplotypes as the basic unit, rather than individual SNPs, Daly et al. (2001) found that LD is clearly a monotonic function of physical distance and that historical recombination is the major determinant of the breakdown in LD. This finding has important implications for association mapping. In a study of Crohn's disease, Rioux et al. (2001) successfully performed an association analysis using haplotype blocks and isolated a 250-kb segment harboring the susceptibility locus from the original 18-cM region.
The renin–angiotensin system (RAS) plays a critical physiological role in the cardiovascular system. The primary genes that comprise the RAS have, perhaps not surprisingly, been the focus of an enormous number of association studies over the last decade. Even though important genetic influences have been noted for the direct phenotype of some of the RAS genes, most notably angiotensin I-converting enzyme (ACE; Soubrier et al. 1994), their role as susceptibility or protective genes for cardiovascular disease is still unresolved (Fornage et al. 1998; O'Malley et al. 1999; Keavney et al. 2000; Zhu et al. 2000; Svetky et al. 2001). It is reasonable to assume that more detailed information about the organization of genetic variation at these loci will be required before the full impact of the RAS genes can be appreciated. The purpose of our study was to determine the LD distribution and haplotype structure in the RAS genes among individuals within and between populations by genotyping a set of SNPs in a community-based sample of U.S. whites (European-Americans) and blacks (African-Americans).
RESULTS
Our original data set includes 193 black families and 160 white families. Because the numbers of siblings in the two groups were comparable, we randomly selected one sibling from each family after excluding the probands. The genotyped siblings, thus selected, included 193 black and 160 white individuals. Five SNPs were genotyped in each of the four genes, with the exception of ACE, for which 10 SNPs were genotyped. The length of the genomic segments covered in each gene were, Renin (REN), 14 kb; angiotensin receptor type I (AGTR1), 45 kb; angiotensinogen (AGT), 4.5 kb; and ACE, 21 kb. In Table 1 the minor allele frequencies for the SNPs in the four genes are presented for both populations, along with p-values for the HWE test. The δc values for all the SNPs between whites and blacks are also presented in the last column. The minor allele frequencies were all >10%, with the exception of REN C-3212T, AGTR1 A44221G, and ACE A7941G in whites, and AGT C3889T in blacks. No significant departure from HWE was found, except for ACE A7941G and ACE C19329T in whites. In general, blacks had a higher frequency of the alleles that were designated as minor among whites. To quantify the degree of population diversity, FST (Wright 1931), which is defined as the genetic variance among populations divided by the genetic variance within the total population, was calculated. Our data yielded a value for FST of 0.084, with a 95% confidence interval of (0.049, 0.119) obtained by bootstrapping all sites (Weir 1996).
Table 1.
Genetic Polymorphisms in the RAS Genes, Whites and Blacks
| Polymorphisma (minor allele) | dbSNPb | Whites | Blacks | δc | ||
| minor allele freq. | HWE P value | minor allele freq. | HWE P value | |||
| REN | ||||||
| C-4021T (T) | 0.12 | 0.24 | 0.28 | 0.29 | 0.16 | |
| C-3212T (T) | 0.08 | 0.07 | 0.13 | 0.06 | 0.05 | |
| A4280C (C) | rs5705 | 0.12 | 1.0 | 0.30 | 0.08 | 0.18 |
| G5795T (G) | rs5707 | 0.25 | 0.28 | 0.30 | 0.58 | 0.05 |
| C10377T (T) | 0.12 | 0.23 | 0.18 | 0.63 | 0.06 | |
| AGTR1 | ||||||
| A-777T (A) | rs275651 | 0.14 | 1.0 | 0.31 | 0.86 | 0.17 |
| G-680T (G) | rs275652 | 0.14 | 0.2 | 0.26 | 0.18 | 0.12 |
| A-119G (G) | rs275653 | 0.15 | 0.35 | 0.26 | 0.14 | 0.11 |
| C43732T (T) | rs5182 | 0.50 | 0.64 | 0.21 | 0.07 | 0.29 |
| A44221G (G) | rs5183 | 0.05 | 1.0 | 0.33 | 0.32 | 0.28 |
| AGT | ||||||
| C-532T (T) | rs5046 | 0.12 | 0.23 | 0.11 | 1.0 | 0.01 |
| A-217G (A) | rs5049 | 0.13 | 0.27 | 0.26 | 0.85 | 0.13 |
| A-6G (A) | rs5051 | 0.48 | 0.12 | 0.84 | 0.80 | 0.36 |
| C3889T (C) | rs4762 | 0.11 | 1.0 | 0.09 | 0.64 | 0.02 |
| C4072T (T) | rs699 | 0.48 | 0.71 | 0.15 | 0.36 | 0.33 |
| ACE | ||||||
| A-239T (T) | rs4291 | 0.47 | 0.42 | 0.34 | 0.26 | 0.13 |
| A7941G (G) | rs4318 | 0.05 | 0.001 | 0.20 | 0.11 | 0.15 |
| C8342T (C) | rs4321 | 0.39 | 0.87 | 0.38 | 0.74 | 0.01 |
| A10539G (A) | rs4335 | 0.40 | 0.52 | 0.74 | 1.0 | 0.34 |
| A11599G (A) | rs4343 | 0.42 | 0.42 | 0.73 | 0.86 | 0.31 |
| A12292G (A) | rs4344 | 0.38 | 1.0 | 0.37 | 0.21 | 0.01 |
| A15990G (G) | rs4353 | 0.39 | 0.86 | 0.35 | 0.44 | 0.04 |
| C17911T (C) | rs4359 | 0.38 | 0.74 | 0.55 | 0.87 | 0.17 |
| C19329T (C) | rs4362 | 0.40 | 0.002 | 0.54 | 0.65 | 0.14 |
| A20060G (A) | rs4363 | 0.39 | 1.0 | 0.55 | 0.56 | 0.16 |
Name given based on the position relative to exon 1 according to NCBI build number 30.
SNP ID in database dbSNP.
Linkage Disequilibrium
The most informative approach to defining LD would involve characterization of the haplotypes in each gene. Unfortunately, genotype information was missing for a number of SNPs, in particular for AGT. Therefore, we first examined pairwise LD measured by Lewontin's D‘ (Table 2). Because some entries in the 2-by-2 tables testing for LD were rare, we used Fisher’s exact test to test the null hypothesis that D‘ = 0. The p-values were then adjusted by the number of SNP pairs in the gene using a Bonferroni correction, because pairwise LD tests within a gene were not independent. In Table 2 the shaded area indicates that significant LD exists within each gene after adjusting for multiple tests. The relevant findings are summarized separately for each gene below.
Table 2.
Linkage Disequilibrium Statistic (D′) in RAS Genes in Whites (Lower Triangle) and Blacks (Upper Triangle)
| 1. REN | C-4021T | C-3212T | A4280C | G5795T | C10377T | |||||
| C-4021T | — | 1.00 | 0.10 | 0.57 | 0.12 | |||||
| C-3212T | 1.00 | — | 1.0 | 0.73 | 1.0 | |||||
| A4280C | 1.00 | 1.00 | — | 0.95 | 0.57 | |||||
| G5795T | 1.00 | 1.00 | 1.00 | — | 0.02 | |||||
| C10377T | 1.00 | 1.00 | 1.00 | 1.00 | — | |||||
| 2. AGTR1 | A-777T | G-680T | A-119G | C43732T | A44221G | |||||
| A-777T | — | 1.00 | 1.00 | 0.12 | 0.10 | |||||
| G-680T | 1.00 | — | 1.00 | 0.09 | 0.10 | |||||
| A-119G | 1.00 | 1.00 | — | 0.08 | 0.10 | |||||
| C43732T | 0.13 | 0.03 | 0.10 | — | 1.00 | |||||
| A44221G | 1.00 | 1.00 | 1.00 | 1.00 | — | |||||
| 3. AGT | C-532T | A-217G | A-6G | C3889T | C4072T | |||||
| C-532T | — | 1.00 | 1.00 | 1.00 | 1.00 | |||||
| A-217G | 1.00 | — | 1.00 | 1.00 | 1.00 | |||||
| A-6G | 1.00 | 1.00 | — | 1.00 | 1.00 | |||||
| C3889T | 1.00 | 1.00 | 1.00 | — | 0.93 | |||||
| C4072T | 0.87 | 0.87 | 0.96 | 1.00 | — | |||||
| 4. ACE | A-239T | A7941G | C8342T | A10593G | A11599G | A12292G | A15990G | C17911T | C19329T | A20060G |
| A-239T | — | 0.42 | 0.30 | 0.26 | 0.24 | 0.29 | 0.27 | 0.33 | 0.19 | 0.33 |
| A7941G | 0.50 | — | 0.80 | 1.00 | 1.00 | 1.00 | 0.93 | 0.79 | 0.72 | 0.76 |
| C8342T | 0.96 | 0.43 | — | 1.00 | 0.96 | 0.95 | 0.95 | 0.81 | 0.62 | 0.70 |
| A10593G | 0.98 | 0.41 | 0.99 | — | 1.00 | 1.00 | 1.00 | 0.98 | 0.83 | 1.00 |
| A11599G | 0.94 | 0.27 | 0.97 | 0.99 | — | 0.96 | 0.96 | 0.96 | 0.81 | 0.98 |
| A12292G | 0.98 | 0.44 | 0.99 | 1.00 | 0.99 | — | 0.96 | 0.82 | 0.62 | 0.71 |
| A15990G | 0.96 | 0.42 | 0.99 | 0.99 | 0.97 | 1.00 | — | 1.00 | 0.74 | 0.89 |
| C17911T | 0.98 | 0.44 | 1.00 | 1.00 | 0.99 | 1.00 | 1.00 | — | 0.85 | 0.88 |
| C19329T | 0.92 | 0.42 | 0.99 | 1.00 | 0.99 | 1.00 | 1.00 | 1.00 | — | 0.82 |
| A20060G | 0.96 | 0.44 | 0.97 | 0.99 | 0.97 | 0.99 | 1.00 | 1.00 | 1.00 | — |
Shaded area indicates statistical significance (p < 0.0001) after adjusting for multiple tests.
REN
In whites all observed D‘ values were equal to 1, whereas this was true for only three of the D‘ values among blacks. As noted, when D‘ = 1, in the absence of intragenic recombination and repeated mutation, the maximum number of haplotypes that can be observed for a pair of SNPs is 3. These data therefore indicate an absence of intragenic recombination and repeated mutation in whites. In whites, LD among C-4021T, C-3212T, and C10377T was significant, but not with A4280C or G5795T. These results demonstrate that the LD test is not necessarily significant even when D‘ = 1. Except for G5795T, all the markers studied here had low minor allele frequencies. For SNPs with this distribution the test of LD may not have much power (Thompson et al. 1988). In blacks significant LD occurred between C-4021T and C-3212T, and between A4280C and G5795T, C10377T. Overall, therefore, considerable LD exists in this gene among whites, but much less occurs among blacks.
AGTR1
In the AGTR1 gene, two LD clusters, separated by 44 kb, were observed for both whites and blacks. One cluster consisted of the SNPs A-777T, G-680T, and A-119G, and the other consisted of C43732T and A44221G. Within these clusters all the D‘ values were equal to 1, but LD was weak between them, indicating frequent recombination events.
AGT
At the AGT locus the D‘ values were >0.8 for both the black and the white samples. Seven of the 10 pairwise D‘ estimates in whites and 9 of 10 in blacks were equal to 1, leading us to conclude neither recombination nor multiple mutations are present in both whites and blacks. Eight of the 10 and 3 of the 10 pairwise tests were statistically significant in whites and blacks, respectively. Significant LD was only observed between neighboring SNPs in blacks. In both populations C3889T was not in significant LD with any of the other SNPs, except for A-6G in whites. The minor allele T for C3889T had a low frequency in both whites and blacks.
ACE
For ACE, all the D‘ values were >0.9 in whites, yielding significant LD, except for A7941G, which had a minor allele A frequency of 5% in whites. In blacks, all the D‘ values were >0.6 except for some associated with A-239T. Significant LD was also found among all markers except A-239T.
To provide an overall estimate of LD versus distance, we plotted both D‘ and r2 against distance for the two groups (Fig. 1). LD decays as distance increases independent of the measure in blacks. However, LD decays much slower in whites than that in blacks, probably because of the short region considered. The pronounced contrast by racial group is likewise apparent in this graphical format.
Figure 1.


Comparison of LD between blacks and whites based on D‘ and r2. (A) |D‘| for blacks. (B) |D‘| for whites. (C) r2 for blacks. (D) r2 for whites. In blacks, both D‘ and r2 decay as the distance increases, although considerable variation is observed. In whites, the decay of D‘ values demarcated by the ellipse are apparently owing to the effects of rare minor allele frequency (ACE A7941G, f(G) = 0.05). The rare minor allele frequency (AGTR1 A44221G, f(G) = 0.05) is also associated with D‘ values of 1, as indicated in the circle. Excluding the D‘ values in the ellipse and the circle leads to a slower decay of the D‘ value in whites as the distance increases than that in blacks. Similarly, the low r2 values in the ellipse among whites are caused by the minor alleles being rare. These r2 values are derived from at least one SNP with an allele frequency <0.15. After excluding these values, r2 decays as the distance increases.
Haplotype Analysis
We next defined the haplotypes and estimated their corresponding frequencies using the computer program PHASE. Stable estimates were obtained using 10,000 burn-in cycles and 10,000 iterations (see Supplementary Tables 1–4 available online at http://www.genome.org). The number of haplotypes among blacks was greater except for AGT, and haplotypes shared in both populations account for 90% of those occurring in whites, but much less in blacks. The frequencies of those haplotypes occurring only in whites were 7.1% for ACE, 1.5% for AGTR1, 8.1% for REN, and 3.3% for AGT. The number of major haplotypes (frequency ≧ 4%) in whites was less than among blacks. To obtain the global LD for each of the 4 genes we performed simulation tests (Blanton and Chakravarti 1987; Antonarakis et al. 1988). We estimated the distribution of the number of different haplotypes under the assumption of random association of the SNPs within a gene when all of the observed chromosomes were sampled. Table 3 presents these results based on 1000 replications. The first column represents the candidate genes, and columns 2 to 5 present the number of chromosomes observed, the number of different haplotypes inferred by PHASE, the average number of haplotypes by simulations, and the minimum number of haplotypes by simulations in whites, respectively. Similar results in blacks appear in columns 6 through 9. In each of the four genes, the observed number of haplotypes was less than the minimum number simulated under the random association assumption. These results imply that the empirical p-values of global LD tests are <0.001, leading to the conclusion that strong global LD exists within all four genes.
Table 3.
Simulation Results for Testing for the Global LD in the RAS Genes
| Whites | Blacks | |||||||
| no. of Chr | no. of haplotypes | no. of Chr | no. of haplotypes | |||||
| observed | expecteda | minimum no. | observed | expecteda | minimum no. | |||
| REN | 320 | 5 | 20 | 15 | 378 | 13 | 28 | 23 |
| AGTR1 | 202 | 6 | 18 | 13 | 340 | 9 | 30 | 24 |
| AGT | 214 | 8 | 22 | 16 | 138 | 6 | 17 | 11 |
| ACE | 286 | 14 | 209 | 190 | 362 | 31 | 249 | 221 |
Average number based on 1000 replications.
Haplotype Blocks
Using the definition provided in Methods, we defined the haplotype blocks in the four genes. Table 4 displays the haplotypes and the corresponding frequencies in blocks. The solid lines between two blocks indicate that >4% of all chromosomes are observed. One haplotype block for REN in whites was defined with four major haplotypes. To represent them, A4280C, G5795T, and only one of the three markers (C-4021T, C-3212T, and C10377T), are required, because the latter set are in complete LD. In contrast, two similar blocks were defined in blacks, one consisting of C-4021T and C-3212T and the other consisting of A4280C and G5795T. The SNP C10377T does not fall into either block. All four SNPs are necessary to represent the two blocks. Surprisingly, to represent most of the haplotypes (frequency ≧ 4%) in this gene for blacks, all five SNPs are required, although the genomic segment covered is only 14 kb long. When we considered each block as a locus and the haplotypes as the corresponding alleles, we obtained the δc values of 0.16 and 0.22 for these two blocks. We also found that the δc value for a block is greater than the δc values for the SNPs within the block.
Table 4.
Blocks and Haplotype Frequencies Within a Block in the RAS Genes
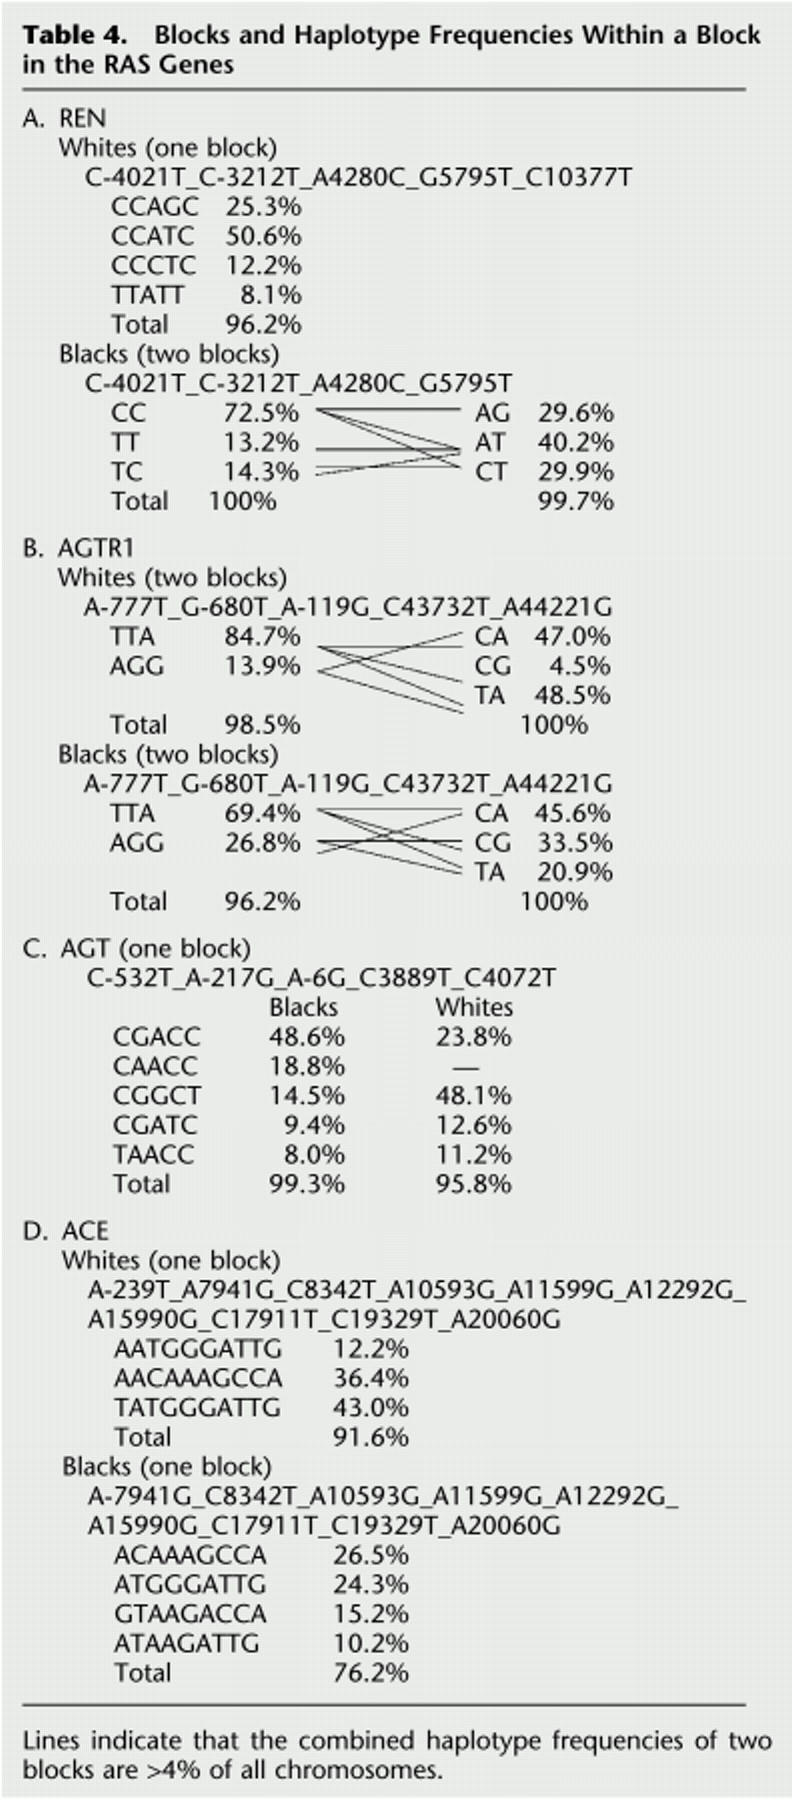 |
Lines indicate that the combined haplotype frequencies of two blocks are >4% of all chromosomes.
In the AGTR1 gene, there are two blocks for both whites and blacks, with one block consisting of A-777T, G-680T, and A-119G, and the other including markers C43732T and A44221G. For both whites and blacks, any one of A-777T, G-680T, and A-119G can represent the first block. In the second block, only C43732T is necessary to represent this block in whites, but both C43732T and A44221G are required for blacks. The δc values we obtained for these two blocks were 0.17 and 0.29. Similar to the Renin gene, the δc value for a block is not less than the δc values for the SNPs within the block in this gene.
In AGT there is one block that can be defined in both whites and blacks. AGT C3889T and one SNP from each of the two pairs C-532T/A-217G or A-6G/C4072T are necessary to represent the four major haplotypes in whites. However, to represent the five major haplotypes in blacks, both C-532T and A-217G must be included. Considering this block as a locus, we obtained the δc value 0.43, which is greater than the δc values of all five SNPs.
In the ACE gene, all the SNPs define one block in whites. Only two SNPs, namely, A-239T and any other SNP except A7941G are required to represent most haplotypes. In blacks, our definition also identifies a block including A7941G, C8342T, A10593G, A11599G, A12292G, A15990G, C17911T, C19329T, and A20060G. However, A-239T does not fall within this block because the haplotype distribution exceeds the 95% bootstrap confidence interval after adding this SNP. The four major haplotypes only account for 76% of the total in this block. Three SNPs, namely, A7941G, one of A10593G and A11599G, and one of C8342T, A12292G, and A15990G are required to represent the four major haplotypes. Considering this block as a locus, we obtained the δc value 0.47, which is greater than the δc values of all nine SNPs.
By defining DNA segments in this fashion, LD within a block is virtually complete, with historical recombination or repeated mutation at their margins. We consistently observed that haplotype blocks were shorter among blacks and consisted of a subset of the SNPs from the blocks in whites. It is also interesting to note that when the haplotypes were considered as the alleles there was much more heterozygosity, and therefore more information derived from the samples than could be obtained from typing single SNPs. To verify the consistency of these results we conducted similar analyses for a data set that included one parent from each family, and the results were essentially the same.
DISCUSSION
Our analysis makes possible a detailed description of the genomic organization of a sample of important cardiovascular candidate genes in two populations with contrasting levels of diversity. Although the number of SNPs we studied is relatively small, the sample size is large, compared with more recent genomic analyses, and the data presented here permit several conclusions. The primary source of heterogeneity in terms of the LD was observed between the two populations. Among whites very little historical recombination can be detected in the RAS genes, and only the SNPs at the AGTR1 gene, which were spaced at 45 kb, show LD clusters that defined two haplotype blocks, with an interval of substantially decreased LD between these two sections. Among blacks, on the other hand, LD was weaker than among whites, except for AGT, for which the LD in blacks and whites was similar. The explanation for the similar LD in AGT among blacks and whites may be that a small region in this gene has been examined, with the largest distance between two markers being <4 kb. Although population admixture may change the LD pattern, with the small difference in allele frequencies and such a short distance, it would be unlikely to have a major effect. More haplotypes are also observed in blacks, with the exception of the AGT gene, for which the reverse was true. However, in AGT there are five major haplotypes in blacks, but only four in whites. Among whites, there was one block observed in ACE, AGT, and REN, and two in the AGTR1 receptor. However, among blacks more haplotype blocks could be defined. These findings in whites are consistent with recent reports (Daly et al. 2001; Patil et al. 2001), which concluded that haplotype blocks range from 10–100 kb in European-derived populations. Our study also indicates that the African populations have much shorter haplotype blocks. The clustering of blocks also indicates local hotspots of recombination (Chakravarti et al. 1984; Clark et al. 1998; Templeton et al. 2000; Jeffreys et al. 2001). Taken together, these haplotype analyses clearly demonstrate that blacks have more haplotype diversity at these loci than do persons of European descent. The pairwise LD analysis is also consistent with this result. Within a block, three or four haplotypes will usually account for >90% of the total haplotypes. Based on these findings, we were able to select fewer SNPs to represent most of the haplotypes within a block.
We also defined haplotype blocks by using the method of Daly et al. (2001). The differences of defining haplotype blocks by these two methods occurred only in the REN and ACE genes in blacks. In REN, the method by Daly and colleagues defines two blocks, with the second block including SNPs A4280C, G5795T, and C10377T; in ACE, it defines two blocks, with the second block including C19329T and A20060G. However, the score statistics of the blocks, defined by the ratio of haplotypic heterozygosity and expected haplotypic heterozygosity (Daly et al. 2001), are not significantly different from that of blocks defined in our method, indicating that the differences may be due to the sampling variation. Thus, the haplotype blocks defined in these two methods are essentially the same.
Confidence in the generalizability of our findings is reinforced by their congruence with previous reports. Whether based on single genes (Halushka et al. 1999; Zhu et al. 2000) or random genomic segments (Reich et al. 2001), the relevant published data are similar in every respect to our findings. Even though they used very different sampling methods to choose genomic regions and markers, Reich et al. (2001) report estimates of LD half-length similar to ours, namely, 5 kb for blacks. Our findings therefore extend the observation of short LD to persons of African descent in the Western Hemisphere. Although the confidence limits on the estimated LD half-lengths have not been well defined, the similarity of the finding among U.S. blacks and Nigerians indicates that recent population admixture in the U.S. has not noticeably increased the extent of LD when we deal with a genomic distance <45 kb.
Variation in the extent of LD among human populations has obvious implications for gene mapping (Tishkoff et al. 1996; Wright et al. 1999; Taillon-Miller et al. 2000; Abecasis et al. 2001; Reich et al. 2001). Jorde (2000) has drawn attention to the possibility that a two-tiered strategy would be most efficient for association studies. If the aim is to localize a genetic effect within a 50–100-kb range, then European populations might be targeted; on the other hand, to carry out fine-mapping at the 1–5-kb range, a study of African-origin groups would be more productive. We recently demonstrated the practical significance of this observation in a study localizing the 3′ region within the ACE gene that has the greatest influence on ACE plasma activity (Zhu et al. 2000). In Jamaicans the effect could be resolved to a small region; however, in Germans, given the limited number of recombination events that were available to study, localization was not possible (Zhu et al. 2000). Similarly, using 13 markers in ACE in a Nigerian sample, we were able to identify a second 5′ region that influenced plasma activity and use this information to find an association with blood pressure (Zhu et al. 2001). Using all the segregating variability expressed in populations of African ancestry, Zhu et al. (2001) demonstrated the limitations of the much-studied Alu motif in ACE as a marker of susceptibility. This experience, if it can be generalized, indicates that association studies can become more informative if the appropriate target population is chosen and the entire store of genetic information at the target locus is fully exploited.
Our estimates of δc values indicate that defining haplotype blocks could increase the δc values, thereby increasing the power to detect LD in an admixed population. With the availability of abundant SNPs across the human genome (Sachidanandam et al. 2001), we should be able to define the necessary haplotype blocks (Daly et al. 2001; Patil et al. 2001). It might, therefore, be possible to select dense blocks with maximum haplotype frequency differences between two founder populations to conduct genome-wide admixture mapping.
Several limitations of this study must be acknowledged. The SNPs were chosen on the basis of frequency and the available published information, but we have no way to evaluate whether this introduced a bias. However, with the large sample size and the replication of the results by selecting one parent from each family, such bias should be negligible. Although the probands for this study were identified based on blood pressure near the upper 15%, the age–gender-specific distribution, our analysis sample excluded all the probands. Furthermore, our sampling method is unlikely to influence the patterns of LD, because the variation of blood pressure explained by this region is very small (Zhu et al. 2001).
It seems reasonable to suggest that the complexity of genomic organization has been underestimated in most association studies of complex traits. Multiple variants, both in coding and promoter sequences, may well have complementary small effects. If this is true for most genes, more exhaustive search methods will be required than have been used. Defining the haplotype blocks in the region of interest may be the necessary first step to avoid the “hit or miss” approach that characterizes mapping based on single SNPs.
METHODS
Selection of Participants
The participants in this study were enrolled in the GenNet component of the NHLBI-sponsored Family Blood Pressure Program (Province et al. 2000); the design and sampling procedures are to be published (B.A. Thiel, A. Chakravarti, R.S. Cooper, A. Luke, S. Lewis, A. Lynn, H. Tiwari, N.J. Schork, A.B. Weder, unpubl.). In brief, sibships including persons between the ages of 25 and 40 were enrolled if their systolic (SBP) or diastolic (DBP) blood pressures were in the upper 25th and 15th percentile for black or white, respectively. African-Americans were recruited in Maywood, Illinois, whereas persons of European descent were enrolled in Tecumseh, Michigan; ethnic classification was based on self-identification. The protocols were reviewed and approved by the review boards of the respective institutions. The original sample included 616 individuals from 201 black families in Maywood, and 618 individuals from 160 white families in Tecumseh. Our analysis focused on a sibling set consisting of one sibling randomly selected from each family, after excluding the proband. This sampling scheme should reduce the bias due to the ascertainment. The siblings chosen included 193 blacks and 160 whites.
Laboratory Methods
SNPs of the Renin–Angiotensin System
The candidate genes studied were REN (MIM 179820), AGTR1 (MIM 106165), AGT (MIM 106150), and ACE (MIM 106180) (http://www.ncbi.nlm.nih.gov/Omim). A total of 25 SNPs were genotyped. Because the human genomic sequences are still being refined, the position of an SNP within a gene may be different from previous publications. We named an SNP based on its position relative to the first base of exon 1 (according to the NCBI human genome sequence build 30) and also gave its corresponding reference SNP identification numbers (rs#; Table 1). The cytogenetic map, polymorphic sites, and location of the SNPs for the REN, AGTR1, and AGT genes used in this study are shown in Table 5. The 10 ACE SNPs were obtained from Rieder et al. (1999).
Table 5.
Polymorphisms of Genes of the Renin-Angiotensin System
| Gene | Cytogenetic map | Polymorphisms | Location in gene | Reference |
| REN | 1q32 | C-4021T | Promotor | See Supplementary Fig. 1 |
| C-3212T | Promoter | See Supplementary Fig. 1 | ||
| A4280C | Exon 2 | |||
| G5795T | Intron 4 | |||
| C10377T | Intron 8 | See Supplementary Fig. 1 | ||
| AGTR1 | 3q21–q25 | A-777T | Promoter | |
| G-680T | Promoter | |||
| A-119G | Promoter | |||
| T43732C | Exon 5 | |||
| A44221G | Exon 5 | |||
| AGT | 1q42–q43 | C-532T | Promoter | |
| C-217T | Promoter | |||
| A-6G | Promoter | |||
| C3889T(T174M) | Exon 2 | |||
| C4072T(M235T) | Exon 2 |
DNA Isolation
DNA from buffy coat samples was extracted using the Puregene commercial kit, which combines cell lysis and protein precipitation (Gentra System, Inc.). DNA concentration was assessed by a Tecan GENIos Fluorometer using Picogreen.
Genotyping
The PrimerExpress software was used to design probes and primers, and a 5′ nuclease allelic discrimination Taqman assay was used for SNP genotyping (Perkin-Elmer Biosystems). The assay includes two fluorescent Taqman oligonucleotide probes: an allele 1-specific probe labeled with VIC and an allele 2-specific probe labeled with FAM (6-carboxyfluorescein). The VIC or FAM reporter dye is covalently attached to the 5′-terminal base of the probe, and a nonfluorescent quencher dye, TAMRA (6-carboxy-tetramethylrhodamine), is attached at the 3′ end. Each 25-μL PCR reaction contained 50 ng of genomic DNA, 900 nM each PCR primer (Research Genetics), 200 nM each probe, and Taqman Universal PCR Master Mix (a solution containing AmpErase Uracil-N-glycosylase (UNG), deoxyribonucleotides, uridine, passive reference dye (ROX), TaqGold DNA polymerase, and reaction buffer (Applied Biosystems P/N 4316033). Amplifications were performed under the following conditions: 50°C for 2 min for AmpErase UNG degradation of any carryover DNA, followed by AmpliTaq Gold enzyme activation at 95°C for 10 min before 40 cycles of 95°C for 15 sec and 62°C for 1 min in a PTC-225 DNA Engine Tetrad thermal cycler (MJ Reseach). Fluorescence in each well was measured after PCR using the ABI Prism 7700 Sequence Detector System (SDS, PE Biosystems).
Statistical Analysis
Allele frequencies for each SNP were calculated by allele counting, and the Hardy–Weinberg equilibrium was tested using the χ2 test with 1 df. Pairwise LD was measured by D‘ (Lowontin 1964) and r2 (Hill and Robertson 1968) within each ethnic sample. Pairwise LD was tested by Fisher’s exact test (Chakravarti et al. 1984). For each gene, haplotypes were reconstructed using the computer progran PHASE (Stephens et al. 2001). PHASE uses Gibbs sampling to estimate the posterior probabilities of an individual's haplotypes given the observed genotypes, and thereby assigns haplotype phases. A global test of LD was performed according to the simulation method of Blanton and Chakravarti (1987), in which the observed number of haplotypes was compared with the simulated number of haplotypes under the assumption of linkage equilibrium (Antonarakis et al. 1988).
We defined a block as a DNA region in which there was no apparent historical recombination. To determine these intervals, we first examined the pairwise D‘ values. A pairwise D‘ value of 1 indicates that no more than three of the four possible haplotypes are observed (Leitersdor et al. 1989) and indicates the rarity of recombination between a pair of SNPs. We first searched for intervals in which all SNPs had pairwise D‘ > 0.8 and assumed that they constituted the minimum blocks. These intervals were then expanded by adding SNPs to the ends to find the longest intervals, as follows: The estimated haplotypes and their 95% confidence intervals were bootstrapped before adding an SNP. If the haplotype frequencies after adding an SNP fell into the corresponding 95% confidence intervals, we concluded that the added marker belonged to the same block. We repeated this procedure until we found that adding a marker led to a statistical change in the haplotype distribution. Based on this definition, we would anticipate that no apparent recombination events had occurred within a block.
We also calculated composite δc, which is defined as half of the sum of the absolute value of all allelic frequency differences at a locus (Shriver et al. 1997):
 |
where fi1 and fi2 are the frequencies of the i-th allele in two populations. The magnitude of δc is the principal determinant of the efficiency for admixture mapping (Chakraborty and Weiss 1988; Chakraborty et al. 1991). We first calculated the δc value for each SNP and next the δc values for a block by considering block haplotypes as alleles.
WEB SITE REFERENCES
http://www.ncbi.nlm.nih.gov/Omim; Online Mendelian Inheritance in Man (OMIM).
Acknowledgments
We thank Hongyu Zhao for helpful comments. We thank Donghui Kan for his assistance in programming. This work was supported by grants from the National Heart, Lung and Blood Institute (UOI–HL54485; HL54466; HL65702).
The publication costs of this article were defrayed in part by payment of page charges. This article must therefore be hereby marked “advertisement” in accordance with 18 USC section 1734 solely to indicate this fact.
E-MAIL xzhu1@lumc.edu; FAX (708) 327-9009.
Article and publication are at http://www.genome.org/cgi/doi/10.1101/gr.302003. Article published online before print in January 2003.
REFERENCES
- 1.Abecasis G., Noguchi, E., Heinzmann, A., Traherne, J., Bhattacharyya, S., Leaves, N., Anderson, G., Zhang, Y., Lench, N., Carey, A., et al. 2001. Extent and distribution of linkage disequilibrium in three genomic regions. Am. J. Hum. Genet. 68: 191-197. [DOI] [PMC free article] [PubMed] [Google Scholar]
- 2.Antonarakis S.E., Oettgen, P., Chakravarti, A., Halloran, S.L., Hudson, R.R., Feisee, L., and Karathanasis, S.K. 1988. DNA polymorphism haplotypes of the human apolipoprotein APOA1–APOC3–APOA4 gene cluster. Hum. Genet. 80: 265-273. [DOI] [PubMed] [Google Scholar]
- 3.Blanton S.H. and Chakavarti, A. 1987. A global test of linkage disequilibrium. Am. J. Hum. Genet. 41: A250. [Google Scholar]
- 4.Bonnardeaux A., Davies, E., Jeunemaitre, , Fery, I., Charu, A., Clauser, E., Tiret, L., Cambien, F., Corval, P., and Soubrier, F. 1994. Angiotensin II type 1 receptor gene polymorphisms in human essential hypertension. Hypertension 24: 63-69. [DOI] [PubMed] [Google Scholar]
- 5.Cargill M., Altshuler, D., Ireland, J., Skalar, P., Ardlie, K., Patil, N., Shaw, N., Lane, C., Lim, E., Kalyanaraman, N., et al. 1999. Characterization of single-nucleotide polymorphisms in coding regions of human genes. Nat. Genet. 22: 231-238. [DOI] [PubMed] [Google Scholar]
- 6.Chakraborty R. and Weiss, K.M. 1988. Admixture as a tool for finding linkage genes and detecting that difference from allelic association between loci. Proc. Natl. Acad. Sci. 85: 9119-9123. [DOI] [PMC free article] [PubMed] [Google Scholar]
- 7.Chakraborty R., Kamboh, M.I., and Ferrell, R.E. 1991. ‘Unique’ alleles in admixed populations: A strategy for determining ‘hereditary’ population differences of disease frequencies. Ethn. Dis. 1: 245-256. [PubMed] [Google Scholar]
- 8.Chakravarti A., Buetow, K.H., Antonarakis, S.E., Waber, P.G., Boehm, C.D., and Kazazian, H.H. 1984. Nonuniform recombination within the human β-globin gene cluster. Am. J. Hum. Genet. 36: 1239-1258. [PMC free article] [PubMed] [Google Scholar]
- 9.Clark A.G., Weiss, K.M., Nickerson, D.A., Taylor, S.L., Buchanan, A., Stengard, J., Salomaa, V., Vartiainen, E., Perola, M., Boerwinkle, E., et al. 1998. Haplotype structure and population genetic inferences from nucleotide sequence variation in human lipoprotein lipase. Am. J. Hum. Genet. 63: 595-612. [DOI] [PMC free article] [PubMed] [Google Scholar]
- 10.Daly M.J., Rioux, J.D., Schaffner, S.F., Hudson, T.J., and Lander, E.S. 2001. High-resolution haplotype structure in the human genome. Nat. Genet. 29: 229-232. [DOI] [PubMed] [Google Scholar]
- 11.Dunning A., Durocher, F., Healy, C., Teare, M., McBride, S., Carlomagno, F., Xu, C., Dawson, E., Rhodes, S., Ueda, S., et al. 2000. The extent of linkage disequilibrium in four populations with distinct demographic histories. Am. J. Hum. Genet. 67: 1544-1554. [DOI] [PMC free article] [PubMed] [Google Scholar]
- 12.Erdmann J., Riedel, K., Rohde, K., Folgmann, I., Wienker, T., Fleck, E., and Regitz-Zagrosek, V. 1999. Characterization of polymorphisms in the promoter of the human angiotensinogen II subtype 1 (AT1) receptor gene. Ann. Hum. Genet. 63: 369-374. [DOI] [PubMed] [Google Scholar]
- 13.Fornage M., Amos, C.I., Kardia, S., Sing, C.F., Turner, S.T., and Boerwinkle, E. 1998. Variation in the region of the angiotensin-converting enzyme gene influences interindividual differences in blood pressure levels in young white males. Circulation 97: 1773-1779. [DOI] [PubMed] [Google Scholar]
- 14.Halushka M., Fan, J.-B., Bentley, K., Hsie, L., Weder, A., Cooper, R.S., Lipshutz, R., and Chakravarti, A. 1999. Patterns of single-nucleotide polymorphisms in candidate genes for blood pressure homeostasis. Nat. Genet. 22: 239-247. [DOI] [PubMed] [Google Scholar]
- 15.Hill W.G. and Robertson, A. 1968. Linkage disequilibrium in finite populations. Theor. Appl. Genet. 38: 226-231. [DOI] [PubMed] [Google Scholar]
- 16.Inoue I., Nakajima, T., Williams, C.S., Quackenbush, J., Puryear, R., Powers, M., Cheng, T., Ludwig, E.H., Sharma, A.M., Hata, A., et al. 1997. A nucleotide substitution in the promoter of human angiotensinogen is associated with essential hypertension and affects basal transcription in vitro. J. Clin. Invest. 99: 1786-1797. [DOI] [PMC free article] [PubMed] [Google Scholar]
- 17.Jeffreys A.J., Kauppi, L., and Neumann, R. 2001. Intensely punctate meiotic recombination in the class II region of the major histocompatibility complex. Nat. Genet. 29: 217-222. [DOI] [PubMed] [Google Scholar]
- 18.Jeunemaitre X., Soubrier, F., Kotelevtsev, Y.V., Lifton, R.P., Williams, C.S., Charu, A., Hunt, S.C., Hopkins, P.N., Williams, R.R., Lalouel, J.M., et al. 1992. Molecular basis of human hypertension: Role of angiotensinogen. Cell 71: 169-180. [DOI] [PubMed] [Google Scholar]
- 19.Johnson G.C.L., Esposito, L., Barratt, B.J., Smith, A.N., Heward, J., Genova, G.D., Ueda, H., Cordell, H.J., Eaves, I.A., Dudbridge, F., et al. 2001. Haplotype tagging for the identification of common disease genes. Nat. Genet. 29: 233-237. [DOI] [PubMed] [Google Scholar]
- 20.Jorde L.B. 2000. Linkage disequilibrium and the search for complex disease genes. Genome Res. 10: 1435-1444. [DOI] [PubMed] [Google Scholar]
- 21.Keavney B., McKenzie, C., Parish, S., Palmer, A., Clark, S., Youngman, L., Delepine, M., Lathrop, M., Peto, R., and Collins, R. 2000. For the ISIS Collaborators. Large-scale test of hypothesised associations between the angiotensin-converting-enzyme insertion/deletion polymorphism and myocardial infarction in about 5000 cases and 6000 controls. Lancet 355: 434-444. [DOI] [PubMed] [Google Scholar]
- 22.Kruglyak L. 1999. Prospects for whole-genome linkage disequilibrium mapping of common disease genes. Nat. Genet. 22: 139-144. [DOI] [PubMed] [Google Scholar]
- 23.Lander E.S. and Schork, N.J. 1994. Genetic dissection of complex traits. Science 265: 2037-2048. [DOI] [PubMed] [Google Scholar]
- 24.Leitersdor E., Chakravarti, A., and Hobbs, H.H. 1989. Polymorphic DNA haplotypes at the LDL receptor locus. Am. J. Hum. Genet. 44: 409-442. [PMC free article] [PubMed] [Google Scholar]
- 25.Lowontin R.C. 1964. The interaction of selection and linkage. I. General considerations. Genetics 49: 49-67. [DOI] [PMC free article] [PubMed] [Google Scholar]
- 26.O'Malley J.P., Maslen, C.L., and Illingworth, D.R. 1999. Angiotensin-converting enzyme and cardiovascular disease risk. Curr. Op. Lipid. 10: 407-415. [DOI] [PubMed] [Google Scholar]
- 27.Patil N., Berno, A.J., Hinds, D.A., Barrett, W.A., Doshi, J.M., Hacker, C.R., Kautzer, C.R., Lee, D.H., Marjoribanks, C., McDonough, D.P., et al. 2001. Blocks of limited haplotype diversity revealed by high-resolution scanning of human chromosome 21. Science 294: 1719-1723. [DOI] [PubMed] [Google Scholar]
- 28.Province M.A., Boerwinkle, E., Chakravarti, A., Cooper, R., Fornage, M., Leppert, M., Risch, N., and Ranade, K. 2000. Lack of association of the angiotensinogen-6 polymorphism with blood pressure levels in the comprehensive NHLBI Family Blood Pressure Program. J. Hypertens. 18: 867-875. [DOI] [PubMed] [Google Scholar]
- 29.Reich D.E., Cargill, M., Bolk, S., Ireland, J., Sabeti, P.C., Richter, D.J., Lavery, T., Kouyoumjia, R., Farhadian, S.F., Ward, R., et al. 2001. Linkage disequilibrium in the human genome. Nature 411: 199-204. [DOI] [PubMed] [Google Scholar]
- 30.Rieder M.J., Taylor, S.L., Clark, A.G., and Nickerson, D.A. 1999. Sequence variation in the human angiotensin converting enzyme. Nat. Genet. 22: 59-62. [DOI] [PubMed] [Google Scholar]
- 31.Rioux J.D., Daly, M.J., Silverberg, M.S., Lindbald, K., Steinhart, H., Cohen, Z., Delmonte, T., Kocher, K., Miller, K., Guschwan, S., et al. 2001. Genetic variation in the 5q31 cytokine gene cluster confers susceptibility to Crohn disease. Nat. Genet. 29: 223-228. [DOI] [PubMed] [Google Scholar]
- 32.Risch N.J. 2000. Searching for genetic determinants in the new millennium. Nature 405: 847-856. [DOI] [PubMed] [Google Scholar]
- 33.Sachidanandam R., Weissman, D., Schmidt, S.C., Kakol, J.M., Stein, L.D., Marth, G., Sherry, S., Mullikin, J.C., Mortimore, B.J., Willey, D.L., et al. 2001. A map of human genome sequence variation containing 1.42 million single nucleotide polymorphisms. Nature 409: 928-933. [DOI] [PubMed] [Google Scholar]
- 34.Shriver M.D., Smith, M.W., Jin, L., Marcini, A., Akey, J.M., Deka, R., and Rerrel, R.E. 1997. Ethnic-affiliation estimation by use of population-specific DNA markers. Am. J. Hum. Genet. 60: 957-964. [PMC free article] [PubMed] [Google Scholar]
- 35.Soubrier F., Nadaud, S., and Williams, T.A. 1994. Angiotensin I converting enzyme gene: Regulation, polymorphism and implications in cardiovascular diseases. Eur. Heart J. 15: 24-29. [DOI] [PubMed] [Google Scholar]
- 36.Stephens M., Smith, N.J., and Donnelly, P. 2001. A new statistical method for haplotype reconstruction from population data. Am. J. Hum. Genet. 68: 978-989. [DOI] [PMC free article] [PubMed] [Google Scholar]
- 37.Svetky L.P., Moore, T.J., Simons-Morton, D.G., Appel, L.J., Bray, G.A., Sacks, F.M., Ard, J.D., Mortensen, R.M., Mitchell, S.R., Conlin, P.R., et al. 2001. For the DASH Collaborative Group. Angiotensinogen genotype and blood pressure response in the Dietary Approaches to Stop Hypertension (DASH) study. J. Hypertens. 19: 1949-1956. [DOI] [PubMed] [Google Scholar]
- 38.Taillon-Miller P., Bauer-Sardina, I., Saccone, N., Putzel, J., Laitinen, T., Cao, A., Kere, J., Pilia, G., Rice, J., and Kwok, P. 2000. Juxtaposed regions of extensive and minimal linkage disequilibruim in human Xq25 and Xq28. Nat. Genet. 25: 246-247. [DOI] [PubMed] [Google Scholar]
- 39.Templeton A.R., Clark, A.G., Weiss, K.M., Nickerson, D.A., Boerwinkle, E., and Sing, C.F. 2000. Recombinational and mutational hotspots within the human lipoprotein lipase gene. Am. J. Hum. Genet. 66: 69-83. [DOI] [PMC free article] [PubMed] [Google Scholar]
- 40.Thompson E.A., Deeb, S., Walker, S., and Motulsky, A.G. 1988. The detection of linkage disequilibrium between closely linked markers: RFLPs of the olipoprotein genes. Am. J. Hum. Genet. 42: 113-124. [PMC free article] [PubMed] [Google Scholar]
- 41.Tishkoff S.A., Dietzsch, E., Speed, W., Pakstis, A.J., Kidd, J.R., Cheung, K., Bonne-Tamir, B., Santachiara-Benerecetti, A.S, Moral, P., Krings, M., et al. 1996. Global patterns of the linkage disequilibrium at the CD4 locus and modern human origins. Science 271: 1380-1387. [DOI] [PubMed] [Google Scholar]
- 42.Weir B.S., 1996. Genetic data analysis II. Sinauer Associates, Sunderland, MA.
- 43.Wright A.F., Carothers, A.D., and Piratsu, M. 1999. Population choice in mapping genes for complex diseases. Nat. Genet. 23: 397-404. [DOI] [PubMed] [Google Scholar]
- 44.Wright W. 1931. Evolution in Mendelian populations. Genetics 16: 97-159. [DOI] [PMC free article] [PubMed] [Google Scholar]
- 45.Zhu X., McKenzie, C., Forrester, T., Nickerson, D.A., Cooper, R.S., and Rieder, M.J. 2000. Localization of a small genomic region associated with elevated ACE. Am. J. Hum. Genet. 67: 1144-1153. [DOI] [PMC free article] [PubMed] [Google Scholar]
- 46.Zhu X., Bouzekri, N., Southam, L., Cooper, R.S., Adeyemo, A., McKenzie, C.A., Luke, A., Chen, G., Elston, R.C., and Ward, R. 2001. Linkage and association analysis of angiotensin I-converting enzyme (ACE) gene polymorphisms with ACE concentration and blood pressure. Am. J. Hum. Genet. 68: 1139-1148. [DOI] [PMC free article] [PubMed] [Google Scholar]