

Abstract
Alzheimer’s disease (AD) has a strong propensity to run in families. However, the known risk genes excluding APOE are not clinically useful. In various complex diseases, gene studies have targeted rare alleles for unsolved heritability. Our study aims to elucidate previously unknown risk genes for AD by targeting rare alleles. We used data from five publicly available genetic studies from the Alzheimer’s Disease Neuroimaging Initiative (ADNI) and the database of Genotypes and Phenotypes (dbGaP). A total of 4,171 cases and 9,358 controls were included. The genotype information of rare alleles was imputed using 1,000 genomes. We performed gene-based analysis of rare alleles (minor allele frequency≤3%). The genome-wide significance level was defined as meta P<1.8×10⁻⁶ (0.05/number of genes in human genome = 0.05/28,517). ZNF628, which is located at chromosome 19q13.42, showed a genome-wide significant association with AD. The association of ZNF628 with AD was not dependent on APOE ε4. APOE and TREM2 were also significantly associated with AD, although not at genome-wide significance levels. Other genes identified by targeting common alleles could not be replicated in our gene-based rare allele analysis. We identified that rare variants in ZNF628 are associated with AD. The protein encoded by ZNF628 is known as a transcription factor. Furthermore, the associations of APOE and TREM2 with AD were highly significant, even in gene-based rare allele analysis, which implies that further deep sequencing of these genes is required in AD heritability studies.
Introduction
Alzheimer’s disease (AD) is a leading cause of dementia and is known to have high heritability (as high as 60–80%) [1], [2]. Genome-wide association studies (GWAS) have identified several risk genes for AD such as ABCA7, BIN1, CD33, CD2AP, CLU, CR1, EPHA1, MS4A6A/MS4A4E, and PICALM [3]–[7]. The known risk genes for AD explain only 30% of heritability [8], [9]. Aside from APOE ε4, reported risk genes have low clinical significance because of their small effect sizes [7]. The common variant hypothesis posited common diseases are attributed to common variants and this hypothesis is base concept for GWAS [10], [11]. However, similar to other common diseases, the heritability of AD cannot be fully explained by common alleles [12].
There are growing reports regarding rare variants related to complex diseases [13]–[17]. Contrary to the common variant hypothesis, variants with low frequency could be primary causes for common diseases, according to the rare variant hypothesis [11], [18]. The rationale of the rare variant hypothesis is that allele variants with low frequencies have a higher probability of functional significance [12]. A large scale exome sequencing study has indicated that 95.7% SNPs with functional importance are rare variants [19]. Additionally, the number of variants with loss of function showed an inverse correlation with MAF [20], [21]. Considering their functional significance, rare variants may have large effect sizes. Recently, rare alleles in TREM2, APP, and PLD3 have been reported to have association with AD [22]–[24]. Thus, the identification of more risk or protective rare alleles associated with AD is required.
Although rare alleles are promising targets for genetic association studies of complex diseases, the analyses of rare alleles remains challenging. For example, very large sample sizes are required to detect rare alleles that have modest effect sizes [19]. Deep sequencing of large samples is too expensive for typical researchers to perform. The mutational loads within the same genes, regions, or pathways can be alternative approach [13], [25]. However, a large number of candidate rare alleles within specific regions are more difficult to obtain and interpret, than genotyping of a few loci.
Improvement of imputation methods has allowed accurate inference of rare alleles [26]. According to 1000 genomes study [20], the mean squared Pearson correlation coefficients (R 2) between rare SNPs (MAF 0.5%–5%) and imputed dosages were 0.7–0.9 in the European ancestry. Furthermore, mutational loads of rare alleles within genes obtained from imputation can confer high power [27]. In this study, we aimed to find risk genes for AD using gene-based analysis of rare alleles deduced from 1000 genomes and publicly available GWAS data.
Materials and Methods
Subjects
We used publicly available GWAS data from the Alzheimer’s Disease Neuroimaging Initiative (ADNI), Genetic Alzheimer’s Disease Associations (GenADA) study, Electronic Medical Records and Genomics (eMERGE), the National Institute on Aging Late Onset Alzheimer’s Disease (NIA-LOAD) family study, and the Framingham study. ADNI data were obtained from https://ida.loni.ucla.edu. GenADA (dbGaP accession number: phs000219.v1) [28], [29], eMERGE (dbGaP accession number: phs000234.v1), NIA-LOAD (dbGaP accession number: phs000168.v1), and the Framingham study (dbGaP accession number: phs000007.v16) data were downloaded from dbGaP (http://www.ncbi.nlm.nih.gov/gap). Subjects with European ancestry were included. After genotypic quality control (QC), missing phenotypic data exclusion, and ethnic group selection, 4171 cases and 9358 control were included in this study. Summaries about the studies are shown in Table 1. Additional information for each study were detained in File S1. The institutional review board of Ilsan hospital approved our study. Written informed consent was given by participants. In addition patient records were anonymized prior to analysis.
Table 1. Characteristics of studies.
| Study | Genotyping platform | Case/Controlwith genetic data | Case/control after QC* | No of SNPs after QC | No of imputed SNPs§ | No of imputed rare (MAF≤3%) SNPs§ |
| ADNI | Illumina Human610-Quad | 350/169 | 350/169 | 533479 | 16242208 | 8608819 |
| ADNI2 | Illumina GenomeStudio v2009.1 | 53/125 | 53/125 | 634701 | 14860121 | 7257490 |
| GenADA | Affimetrix Mapping250K_NspMapping250K_Sty | 782/806 | 779/803 | 432763 | 14441395 | 6863818 |
| eMERGE | Illumina Human660W-Quad_v1_A | 676/1843 | 632/1843 | 535401 | 16190257 | 8572925 |
| NIA-LOAD | Illumina Human610-Quad_v1_B | 2244/2320 | 2098/2095 | 542080 | 19568275 | 11943583 |
| Framingham | Affimetrix Mapping250K_NspMapping250K_Sty | 314/4711 | 259/4323 | 371114 | 16510848 | 8908801 |
* In addition to genotyping QC, we selected only European ancestry without missing information on age and sex.
SNPs with INFO≥0.4.
Genotypic QC and imputation
We excluded alleles with low (<1%) MAF, low (<95%) call rate, and deviation of Hardy-Weinberg Equilibrium (P<10–6). The subjects with low (<95%) call rates, too high autosomal heterozygosity (false discovery rate, FDR<1%) and too high relatedness (identical-by-state, IBS>0.95) were excluded. For genotypic QC, we used the GenABEL package, v 1.69 [30].
After estimating haplotypes using SHAPEIT, v 1.0 [31], imputation with multi-population reference panels of 1000 genomes (phase I, release Mar 2012) was executed using IMPUTE2, v 2.2 with default parameters [32], [33]. We discarded imputated SNPs with INFO<0.4. The dosage data of imputation were used for further analyses. The dosage means the expected genotype score [34].
Statistical analyses
In the association study, we adjusted for age, sex, years of education, and significant principle components (PCs) of the genetic stratification (File S1). For consistency across studies, years of education were categorized as follows: 1, ≤ 4; 2, 4< and ≤10; 3, 11< and ≤ 15; 4, >15 years according to the established methods of stratifications in the GenADA study. We imputed missing years of education to a mean value. The years of education was regarded as a continuous variable.
We performed a weighted, Z score based, fixed-effects, meta-analysis using METAL [35]. The effect sample size (NE) for meta-analysis is given in terms of numbers of AD (NAD) and of controls (NC), as follows [35]:
The forest plot was drawn using ‘rmeta’ R package.
APOE is the strongest risk gene among the known risk genes for AD. In several genome-wide association studies for AD [3], the top ranked genes could show false associations with AD, because they are within same LD block of APOE ε4. In addition, the pathogenesis of AD patients might be different between carriers and noncarriers of APOE ε4 [36]. Therefore, we examined the dependency on APOE ε4 genotype status by two ways. First, the results were compared after adjustment for APOE ε4 genotype status – the number of APOE ε4 allele in each individual. eMERGE and the Framingham study did not include data on APOE ε4 genotype status. Therefore, we used imputed dosages of APOE ε4 for these two studies (Table S1 in File S1). Second, the collinearity between selected genes and APOE ε4 genotype status was examined.
Gene-based rare allele analysis
In this study, gene-based rare allele analysis means accumulations of rare alleles within the same coding region implemented in GRANVIL [27]. The definition of gene boundaries was based on the UCSC genome browser (build 37). The Framingham study showed inflated type I error and skewed results (Figures S1 and S2 in File S1). Therefore, we need to adjust for genetic stratification of the Framingham study using another algorithm implemented in GenABEL v1.69 and ProbABEL v0.30 [30], [37] (Figure S2 in File S1). For gene-based analysis of the Framingham study, we need to make computer program for ourselves. We made a dosage of a gene (D) similar to an allele’s dosage in the Framingham study, as follows [27].
Where Gi is a dosage of the ith SNP and n is a number of rare alleles within a gene that were used in the analysis.
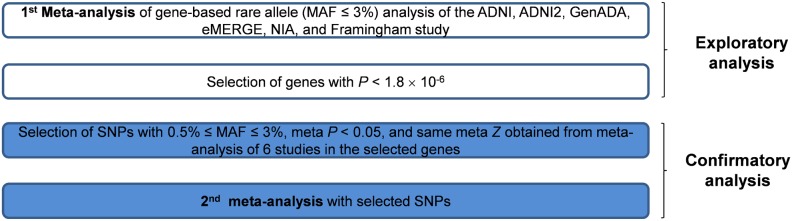
Analyses proceeded in two steps. The overall study scheme is shown in Figure 1. We performed the first meta-analysis to select genes with genome-wide significance. The genome-wide significance was defined as significance of P<1.8×10⁻⁶ (0.05/number of genes in human genome in UCSC genome browser (build 37) = 0.05/28517). However, there are three shortcomings in the gene-based rare allele analysis using imputation. First, it is difficult to interpret if there are a lot of rare alleles in a gene. Second, by pooling risk and protective alleles, power can be decreased. However, considering such directions before selecting candidate genes, overinflation of type I error can be problematic. Third the accuracy of imputation can be decreased in rare alleles with very low MAF. We performed confirmatory analysis (the second meta-analysis) with selected SNPs We did confirmatory analysis, according to two reasons. First, if we could test genetic risk factors with a small number of SNPs, it would be more convenient for genotyping and interpretation. Therefore, we selected several risk SNPs in the finally selected gene according to meta P and meta Z (P<0.05 and Z>0) after performing classical SNP based GWAS and meta-analysis. Second, we excluded rare variants with MAF<0.5%, because the imputation accuracy decreases in very low MAF [20].
Figure 1. The overall scheme of this study.
Results
The first meta-analysis
In the meta-analysis, ZNF628 had genome-wide significance (meta P = 5.3×10⁻⁷ [OR 1.5, 95% CI 1.3–1.8]) (Table 2 and Figure 2A). SNPs in ZNF628 used in this study are summarized in Table S2 in File S1. In addition, APOE had also genome-wide significance (meta P = 1.4×10⁻⁶). Other genes with high significances, but not with genome-wide significance were TOMM40, MMP1, NAPRT1, TREM2, and CBLB.
Table 2. The highly ranked seven genes in the first meta-analyses.
| Gene | CHR | Start | not adjusted for APOE ε4 | adjusted for APOE ε4 | |||
| Meta Z * | Meta P | direction§ | Meta Z | Meta P | |||
| ZNF628 | 19 | 55987698 | 5.0 | 5.3×10⁻⁷ | ++++++ | 5.2 | 1.3×10⁻⁷ |
| APOE | 19 | 45409038 | 4.8 | 1.4×10⁻⁶ | +?+++– | 2.3 | 0.023 |
| TOMM40 | 19 | 45394477 | 4.1 | 4.0×10⁻⁵ | +–++++ | 2.3 | 0.018 |
| MMP1 | 11 | 102654407 | 4.0 | 6.6×10⁻⁵ | –++++ | 4.1 | 4.0×10⁻⁵ |
| NAPRT1 | 8 | 144656956 | 3.9 | 7.8×10⁻⁵ | ++++++ | 4.5 | 8.0×10⁻⁶ |
| TREM2 | 6 | 41126245 | 3.8 | 1.2×10⁻⁴ | ++++++ | 4.6 | 3.7×10⁻⁶ |
| CBLB | 3 | 105438891 | 3.8 | 1.5×10⁻⁴ | ++++++ | 3.2 | 0.0015 |
We show the highly ranked genes (meta P<2.0×10⁻⁴) in the first meta-analysis in this table.
Protein names: zinc finger protein 628, ZNF628; apolipoprotein E, APOE; translocase of outer mitochondrial membrane 40, TOMM40; matrix metallopeptidase 1, MMP1; nicotinate phosphoribosyltransferase domain containing 1, NAPRT1; triggering receptor expressed on myeloid cells 2, TREM2; Cbl proto-oncogene B, E3 ubiquitin protein ligase, CBLB.
* Larger absolute Z score represents smaller P and the direction of the Z score represents the direction of risk [35].
The signs mean those of the Z score of each study. The question mark represents missing data in the study because of low INFO or high MAF. The order of the signs is ADNI, ADNI2, GenADA, eMERGE, NIA-LOAD, and Framingham study.
Figure 2. Forest plots showing the association of ZNF628 with AD.

Results are (A) with all rare SNPs (the first meta-analysis) and (B) with only selected risk SNPs (the second meta-analysis). The weight of each study was calculated by 4/(1/NAD+1/NC), where NAD and NC are numbers of AD and controls, respectively [35].
Dependency on APOE ε4 genotype status
We examined the dependencies of the selected genes by adjusting for APOE ε4 (Table 2). The significance of ZNF628 was remained, even after adjustment. However, the significance of APOE decreased after adjustment for APOE ε4 (after adjustment, P value of APOE increased to 0.023).
Additionally, the collinearity between ZNF628 and APOE ε4 genotype status were examined based on the variance inflation factor (VIF, Table S3 in File S1). The VIFs of all studies were approximately 1.
Meta-analysis with selected risk SNPs (the confirmatory second analysis)
For a more applicable clinical approach, we identified significant risk SNPs by meta P and meta Z scores. Furthermore, considering the imputation accuracy [20], we selected SNPs with 0.5% ≤ MAF≤3%. Two risk SNPs (dbSNP ID: rs112407198 and rs73057174) selected within ZNF628 were synonymous SNPs (Figure 3). As shown in Figure 2B and Table 3, gene-based rare allele analysis using only selected SNPs had genome-wide significance with moderately high effect size (meta P = 3.7×10⁻⁷ [OR 1.7, 95% CI 1.4–2.0]).
Figure 3. Schematic representation of ZNF628 with locations of SNPs used in gene-based rare allele analysis in this study.
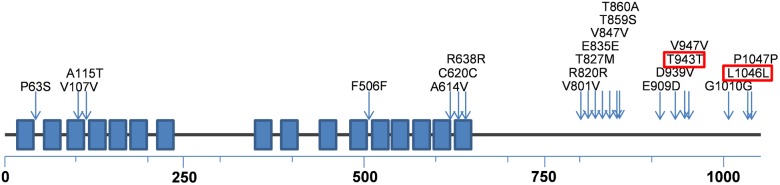
ZNF628 is a protein 1059 amino acids long. We briefly showed the domains (boxes) and the locations of SNPs (arrows) in a schematic linear structure of ZNF628. Blue boxes denote C2H2-type zinc finger domains. dbSNP ID can be found in Table S2 in File S1. SNPs within red boxes were used in the second analysis.
Table 3. Results of the second meta-analysis (confirmatory analysis).
| rs112407198 (position: 19∶55995401) | rs73057174 (position: 19∶55995710) | Gene-based | ||||||||||||
| Study | MAF | INFO | not adjusted for APOE ε4 | adjusted for APOE ε4 | MAF | INFO | not adjustedfor APOE ε4 | adjusted forAPOE ε4 | P not adjustedfor APOE ε4 | P adjustedfor APOE ε4 | ||||
| beta | P | beta | P | beta | P | beta | P | |||||||
| ADNI | 0.011 | 0.78 | 0.29 | 0.70 | 0.09 | 0.91 | 0.029 | 0.91 | 0.08 | 0.85 | 0.39 | 0.40 | 0.73 | 0.43 |
| ADNI2 | 0.009 | 0.82 | –8.7 | 0.79 | 0.50 | 0.87 | 0.031 | 0.95 | –0.30 | 0.63 | –0.083 | 0.90 | 0.74 | 0.55 |
| GenADA | 0.011 | 0.47 | 1.99 | 0.0052 | 1.93 | 0.0079 | 0.022 | 0.67 | 0.52 | 0.11 | 0.59 | 0.093 | 0.0045 | 0.0049 |
| eMERGE | 0.012 | 0.72 | 0.16 | 0.65 | 0.11 | 0.75 | 0.022 | 0.90 | 0.32 | 0.15 | 0.26 | 0.26 | 0.14 | 0.26 |
| NIA | 0.013 | 0.74 | 0.24 | 0.39 | 0.079 | 0.80 | 0.024 | 0.90 | 0.46 | 0.011 | 0.62 | 0.0015 | 0.0084 | 0.0042 |
| Framingham | 0.011 | 0.41 | 1.31 | 0.0079 | 1.34 | 0.0066 | 0.019 | 0.55 | 1.35 | 0.00026 | 1.34 | 0.00029 | 1.0×10⁻⁵ | 9.7×10⁻⁶ |
| Meta | 0.0043 | 0.019 | 2.8×10⁻⁵ | 2.7×10⁻⁶ | 3.7×10⁻⁷ | 2.8×10⁻⁷ | ||||||||
Key: MAF, minor allele frequency; INFO, imputation quality score made by IMPUTE2.
Gene-based rare allele analyses for the genes known to be associated with AD
Interestingly, rare alleles in APOE and TREM2 showed significantly high association with AD (Table 2). Thus, we tested rare alleles of other known genes associated with AD. The most highly ranked nine genes in the AlzGene database [38] (ABCA7, PICALM, CLU, MS4A6A/MS4AE, CD33, BIN1, CR1, and CD2AP) were selected for the test. Based on the meta-analysis, only BIN1 had significance (meta P = 0.046), but did not reach to genome-wide significance level (Table 4).
Table 4. Results of gene-based rare allele analysis top ranking genes in the AlzGene database.
| Gene | CHR | start | Meta Z | Meta P | Directions* |
| ABCA7 | 19 | 1040101 | 0.2 | 0.8539 | +++–+ |
| PICALM | 11 | 85668485 | –0.4 | 0.7068 | –?+–+– |
| CLU | 8 | 27454450 | –1.1 | 0.2554 | –++– |
| MS4A6A | 11 | 59939080 | 0.5 | 0.6377 | –+–+–+ |
| CD33 | 19 | 51728334 | –0.4 | 0.7185 | –++– |
| BIN1 | 2 | 127805606 | 2.0 | 0.0460 | ++++– |
| MS4A4E | 11 | 59980567 | 0.5 | 0.6377 | –+–+–+ |
| CR1 | 1 | 207669472 | 0.7 | 0.5050 | ++–+–+ |
| CD2AP | 6 | 47445524 | –1.1 | 0.2593 | –+–+ |
Protein names: ATP-binding cassette, sub-family A, ABCA7; phosphatidylinositol binding clathrin assembly protein, PICALM; clusterin, CLU; membrane-spanning 4-domains, subfamily A, member 6A, MS4A6A; CD33 molecule, CD33; bridging integrator 1, BIN1; putative membrane-spanning 4-domains subfamily A member 4E, MS4A4E; complement component (3b/4b) receptor 1, CR1; CD2-associated protein, CD2AP.
* The signs represent those of the Z score of each study. The question mark represents missing data in the study because of low INFO or high MAF. The order of the signs is ADNI, ADNI2, GenADA, eMERGE, NIA, and Framingham study.
Discussion
We performed meta-analysis with publicly available genetic studies of AD with imputed rare (MAF≤3%) alleles. ZNF628 was identified to have significant association with AD. Additionally, our rare allele analysis revealed the significant association of APOE and TREM2 with AD, which suggested that our results were valid and that these genes require further study [39], [40].
ZNF628 is a C2H2-zinc finger protein, a type of transcription factors [41] consisting of three exons. C2H2-type zinc finger proteins are known to be essential for normal growth and development [41]. ZNF628 is found in mammals, but not Zebra fish or C. elegans [41]. ZNF628 is evenly expressed in various tissues including brain [42], [43]. ZNF628 is conserved among mammals and seems to be functionally important [41]. The possible DNA binding site is the sequence motif – C/GA/TA/TGGTTGGTTGC [41]. As this time, the target proteins and related human disorders associated with ZNF628 have not been reported. It is possible that the rare alleles in ZNF628 change the expression levels of certain proteins related to AD pathogenesis.
In the selected allele analysis of ZNF628 (the second confirmatory analysis), P and Z values of two SNPs (rs112407198 and rs73057174) reached the criteria of P<0.05 and Z>0. These SNPs are located outside the C2H2-type zinc finger domains and synonymous SNPs (Figure 3). The synonymous mutations are known to change the protein expression level and conformation [44] by affecting mRNA structure [45] or changing the time of cotranslational folding [46]. The altered expression levels or structure of ZNF628 could affect the expression level of other proteins.
There were no dependencies between ZNF628 and APOE ε4 genotype status. ZNF628 is separated from APOE by more than 108 bp, although they are both located on chromosome 19. Therefore, ZNF628 is not included in same LD block with APOE ε4. ZNF628 did not lose its significance in meta-analysis even after adjustment for APOE ε4 genotype status. Therefore, ZNF628 appears to be related with AD independently from APOE ε4. In contrast, the significance of APOE was affected by APOE ε4. The association of the rare alleles in APOE with AD was highly significant (P = 1.4×10⁻⁶) with AD, although this significance disappeared after adjusting for APOE ε4. This suggested that rare alleles in the same LD block with APOE ε4 conferred significant association with AD.
Other risk genes that have been found in GWAS targeting common alleles were not replicated in our gene-based rare allele analysis. Only TREM2, which has been identified in previous studies targeting rare alleles, showed high significance levels [39], [40]. Common alleles with small effect sizes have been explained by synthetic association of rare alleles [47], [48]. Recently, however, this hypothesis was not confirmed in a large-scale study of seven common immune diseases [49]. Similarly, we could not show association of rare alleles within the known genes with AD.
There are several limitations in this study. First, a replication study with real genotyping is required. However, 1000 genomes-based imputations can enable us to find refined and novel signals [50]. Furthermore, the sample size and power can be increased by imputation [51] and meta-analysis [52]. Our gene-based rare variant analysis by imputation have comparable high power with re-sequencing analysis, especially with a large number of sample size [27]. Second, rare alleles analysis of ZNF628 of this study was performed in White populations. Although this result should be replicated in different populations, it is difficult to identify. The two important selected SNPs of our study, rs11247198 and rs73057174, have not been reported in Asian populations, whereas higher MAF has been identified in Black populations (especially in the Bushmen). Third, current methods of rare allele analysis still have problems and need more powerful and consistent methods [53]. The simulated studies using 20 different tools did not generate consistent results [54]. Therefore, simulation studies to identify methods that generate the optimal results are required [53]. Additionally, the directions of SNPs for related diseases are not usually considered [53]. Lastly, the SNPs in introns could not be considered because of limited our computational resources.
In conclusion, we observed a noble association between ZNF628 and AD. Considering the biological role of the ZNF628 protein, it may contribute to AD by regulating various AD-related proteins expressions. Functional studies to elucidate its contribution to AD pathogenesis are required. Additionally, further studies addressing different populations should be replicated to assess the value of the ZNF628 rare allele as a genetic biomarker of AD.
Supporting Information
Supplement text, tables, and figures.
(DOCX)
Acknowledgments
We used the supercomputing resource of the Korea Institute of Science and Technology Information (KISTI).
ADNI got a grant from the National Institute on Aging, the National Institute of Biomedical Imaging and Bioengineering. Additionally, ADNI was supported by the following: Alzheimer’s Association; Alzheimer’s Drug Discovery Foundation; BioClinica, Inc.; Biogen Idec Inc.; Bristol-Myers Squibb Company; Eisai Inc.; Elan Pharmaceuticals, Inc.; Eli Lilly and Company; F. Hoffmann-La Roche Ltd and its affiliated company Genentech, Inc.; GE Healthcare; Innogenetics, N.V.; IXICO Ltd.; Janssen Alzheimer Immunotherapy Research & Development, LLC.; Johnson & Johnson Pharmaceutical Research & Development LLC.; Medpace, Inc.; Merck & Co., Inc.; Meso Scale Diagnostics, LLC.; NeuroRx Research; Novartis Pharmaceuticals Corporation; Pfizer Inc.; Piramal Imaging; Servier; Synarc Inc.; and Takeda Pharmaceutical Company. ADNI clinical sites in Canada got funds from the Canadian Institutes of Health Research. The Foundation for the National Institutes of Health (www.fnih.org) facilitated private sector contributions. The grantee organization is the Northern California Institute for Research and Education, and the study is coordinated by the Alzheimer’s Disease Cooperative Study at the University of California, Rev October 16, 2012 San Diego. The Laboratory for Neuro Imaging at the University of California, Los Angeles disseminated ADNI data. ADNI was also supported by NIH grants (P30 AG010129 and K01 AG030514). The genotypic and associated phenotypic data used in the study, “Multi-Site Collaborative Study for Genotype-Phenotype Associations in Alzheimer’s Disease (GenADA)” were provided by the GlaxoSmithKline, R & D Limited. Alzheimer’s Disease Patient Registry (ADPR) and Adult Changes in Thought (ACT) study was supported by a U01 from the National Institute on Aging (Eric B. Larson, PI, U01AG006781). The 3M Corporation gave a gift and it was used to expand the ACT cohort. DNA aliquots sufficient for GWAS from ADPR Probable AD cases, who had been enrolled in Genetic Differences in Alzheimer’s Cases and Controls (Walter Kukull, PI, R01 AG007584) and obtained under that grant, were made available to eMERGE without charge. Genotyping, which was performed at Johns Hopkins University, was supported by the NIH (U01HG004438). GWAS were supported through a Cooperative Agreement from the National Human Genome Research Institute, U01HG004610 (Eric B. Larson, PI). The eMERGE Administrative Coordinating Center (U01HG004603) and the National Center for Biotechnology Information (NCBI) helped phenotype harmonization and genotype data cleaning. The “Genetic Consortium for Late Onset Alzheimer’s Disease” was supported by the Division of Neuroscience, NIA. In NIA-LOAD study, Genetic Consortium for Late Onset Alzheimer’s Disease helped phenotype harmonization and genotype cleaning, as well as with general study coordination. The Genetic Consortium for Late Onset Alzheimer’s Disease includes a GWAS funded as part of the Division of Neuroscience, NIA. The Framingham Heart Study is performed and supported by the National Heart, Lung, and Blood Institute (NHLBI) in collaboration with Boston University (Contract No. N01-HC-25195). Funding for SHARe Affymetrix genotyping was provided by NHLBI Contract N02-HL-64278. The Framingham Dementia Mild Plus Incidence dataset was supported by NIH/NIA grants R01 AG08122 and R01 AG033193. The Framingham Dementia Moderate Plus Incidence dataset was supported by NIH/NIA grants R01 AG08122 and R01 AG033193.
However, we did not receive the commercial funds that are shown in this section. Although the data in our study can be publicly available, it was mandatory to show the funding sources for the studies. This does not alter our adherence to PLOS ONE policies on sharing data and materials.
This manuscript was not written in collaboration with investigators of the Framingham Heart Study and does not necessarily reflect the opinions or views of the Framingham Heart Study, Boston University, or NHLBI.
Some of data used in preparation of this article were obtained from the Alzheimer’s Disease Neuroimaging Initiative (ADNI) database (adni.loni.ucla.edu). As such, the investigators within the ADNI contributed to the design and implementation of ADNI and/or provided data but did not participate in analysis or writing of this report.
A complete listing of ADNI investigators can be found at:http://adni.loni.ucla.edu/wp-content/uploads/how_to_apply/ADNI_Acknowledgement_List.pdf.
Data Availability
The authors confirm that all data underlying the findings are fully available without restriction. ADNI data were obtained from https://ida.loni.ucla.edu. GenADA (dbGaP accession number: phs000219.v1) [28,29], eMERGE (dbGaP accession number: phs000234.v1), NIA-LOAD (dbGaP accession number: phs000168.v1), and the Framingham study (dbGaP accession number: phs000007.v16) data were downloaded from dbGaP (http://www.ncbi.nlm.nih.gov/gap).
Funding Statement
Study design, meta-analysis, and preparation of the manuscript in this study were supported by a grant from the Korea Health 21 R&D Project, Ministry of Health, Welfare, and Family Affairs, Republic of Korea (HI10C2020 and A092004). The funders had no role in study design, data collection and analysis, decision to publish, or preparation of the manuscript.
References
- 1. Pedersen NL, Posner SF, Gatz M (2001) Multiple-threshold models for genetic influences on age of onset for Alzheimer disease: findings in Swedish twins. Am J Med Genet 105: 724–728. [DOI] [PubMed] [Google Scholar]
- 2. Gatz M, Reynolds CA, Fratiglioni L, Johansson B, Mortimer JA, et al. (2006) Role of genes and environments for explaining Alzheimer disease. Arch Gen Psychiatry 63: 168–174. [DOI] [PubMed] [Google Scholar]
- 3. Harold D, Abraham R, Hollingworth P, Sims R, Gerrish A, et al. (2009) Genome-wide association study identifies variants at CLU and PICALM associated with Alzheimer’s disease. Nat Genet 41: 1088–1093. [DOI] [PMC free article] [PubMed] [Google Scholar]
- 4. Lambert JC, Heath S, Even G, Campion D, Sleegers K, et al. (2009) Genome-wide association study identifies variants at CLU and CR1 associated with Alzheimer’s disease. Nat Genet 41: 1094–1099. [DOI] [PubMed] [Google Scholar]
- 5. Hollingworth P, Harold D, Sims R, Gerrish A, Lambert JC, et al. (2011) Common variants at ABCA7, MS4A6A/MS4A4E, EPHA1, CD33 and CD2AP are associated with Alzheimer’s disease. Nat Genet 43: 429–435. [DOI] [PMC free article] [PubMed] [Google Scholar]
- 6. Naj AC, Jun G, Beecham GW, Wang LS, Vardarajan BN, et al. (2011) Common variants at MS4A4/MS4A6E, CD2AP, CD33 and EPHA1 are associated with late-onset Alzheimer’s disease. Nat Genet 43: 436–441. [DOI] [PMC free article] [PubMed] [Google Scholar]
- 7. Seshadri S, Fitzpatrick AL, Ikram MA, DeStefano AL, Gudnason V, et al. (2010) Genome-wide analysis of genetic loci associated with Alzheimer disease. JAMA 303: 1832–1840. [DOI] [PMC free article] [PubMed] [Google Scholar]
- 8. Bertram L (2011) Alzheimer’s genetics in the GWAS era: a continuing story of 'replications and refutations’. Curr Neurol Neurosci Rep 11: 246–253. [DOI] [PubMed] [Google Scholar]
- 9. Sullivan PF, Daly MJ, O’Donovan M (2012) Genetic architectures of psychiatric disorders: the emerging picture and its implications. Nat Rev Genet 13: 537–551. [DOI] [PMC free article] [PubMed] [Google Scholar]
- 10. Reich DE, Lander ES (2001) On the allelic spectrum of human disease. Trends Genet 17: 502–510. [DOI] [PubMed] [Google Scholar]
- 11. Schork NJ, Murray SS, Frazer KA, Topol EJ (2009) Common vs. rare allele hypotheses for complex diseases. Curr Opin Genet Dev 19: 212–219. [DOI] [PMC free article] [PubMed] [Google Scholar]
- 12. Manolio TA, Collins FS, Cox NJ, Goldstein DB, Hindorff LA, et al. (2009) Finding the missing heritability of complex diseases. Nature 461: 747–753. [DOI] [PMC free article] [PubMed] [Google Scholar]
- 13. Asimit J, Zeggini E (2010) Rare variant association analysis methods for complex traits. Annu Rev Genet 44: 293–308. [DOI] [PubMed] [Google Scholar]
- 14. van de Ven JP, Nilsson SC, Tan PL, Buitendijk GH, Ristau T, et al. (2013) A functional variant in the CFI gene confers a high risk of age-related macular degeneration. Nat Genet 45: 813–817. [DOI] [PubMed] [Google Scholar]
- 15. Wheeler E, Huang N, Bochukova EG, Keogh JM, Lindsay S, et al. (2013) Genome-wide SNP and CNV analysis identifies common and low-frequency variants associated with severe early-onset obesity. Nat Genet 45: 513–517. [DOI] [PMC free article] [PubMed] [Google Scholar]
- 16. Huyghe JR, Jackson AU, Fogarty MP, Buchkovich ML, Stancakova A, et al. (2013) Exome array analysis identifies new loci and low-frequency variants influencing insulin processing and secretion. Nat Genet 45: 197–201. [DOI] [PMC free article] [PubMed] [Google Scholar]
- 17. Styrkarsdottir U, Thorleifsson G, Sulem P, Gudbjartsson DF, Sigurdsson A, et al. (2013) Nonsense mutation in the LGR4 gene is associated with several human diseases and other traits. Nature 497: 517–520. [DOI] [PubMed] [Google Scholar]
- 18. Bodmer W, Bonilla C (2008) Common and rare variants in multifactorial susceptibility to common diseases. Nat Genet 40: 695–701. [DOI] [PMC free article] [PubMed] [Google Scholar]
- 19. Tennessen JA, Bigham AW, O’Connor TD, Fu W, Kenny EE, et al. (2012) Evolution and functional impact of rare coding variation from deep sequencing of human exomes. Science 337: 64–69. [DOI] [PMC free article] [PubMed] [Google Scholar]
- 20. Abecasis GR, Auton A, Brooks LD, DePristo MA, Durbin RM, et al. (2012) An integrated map of genetic variation from 1,092 human genomes. Nature 491: 56–65. [DOI] [PMC free article] [PubMed] [Google Scholar]
- 21. MacArthur DG, Balasubramanian S, Frankish A, Huang N, Morris J, et al. (2012) A systematic survey of loss-of-function variants in human protein-coding genes. Science 335: 823–828. [DOI] [PMC free article] [PubMed] [Google Scholar]
- 22. Rovelet-Lecrux A, Legallic S, Wallon D, Flaman JM, Martinaud O, et al. (2012) A genome-wide study reveals rare CNVs exclusive to extreme phenotypes of Alzheimer disease. Eur J Hum Genet 20: 613–617. [DOI] [PMC free article] [PubMed] [Google Scholar]
- 23. Jonsson T, Atwal JK, Steinberg S, Snaedal J, Jonsson PV, et al. (2012) A mutation in APP protects against Alzheimer’s disease and age-related cognitive decline. Nature 488: 96–99. [DOI] [PubMed] [Google Scholar]
- 24. Cruchaga C, Karch CM, Jin SC, Benitez BA, Cai Y, et al. (2014) Rare coding variants in the phospholipase D3 gene confer risk for Alzheimer’s disease. Nature 505: 550–554. [DOI] [PMC free article] [PubMed] [Google Scholar]
- 25. Walsh T, McClellan JM, McCarthy SE, Addington AM, Pierce SB, et al. (2008) Rare structural variants disrupt multiple genes in neurodevelopmental pathways in schizophrenia. Science 320: 539–543. [DOI] [PubMed] [Google Scholar]
- 26. Shea J, Agarwala V, Philippakis AA, Maguire J, Banks E, et al. (2011) Comparing strategies to fine-map the association of common SNPs at chromosome 9p21 with type 2 diabetes and myocardial infarction. Nat Genet 43: 801–805. [DOI] [PMC free article] [PubMed] [Google Scholar]
- 27. Magi R, Asimit JL, Day-Williams AG, Zeggini E, Morris AP (2012) Genome-Wide Association Analysis of Imputed Rare Variants: Application to Seven Common Complex Diseases. Genet Epidemiol 36: 785–796. [DOI] [PMC free article] [PubMed] [Google Scholar]
- 28. Filippini N, Rao A, Wetten S, Gibson RA, Borrie M, et al. (2009) Anatomically-distinct genetic associations of APOE epsilon4 allele load with regional cortical atrophy in Alzheimer’s disease. Neuroimage 44: 724–728. [DOI] [PubMed] [Google Scholar]
- 29. Li H, Wetten S, Li L, St Jean PL, Upmanyu R, et al. (2008) Candidate single-nucleotide polymorphisms from a genomewide association study of Alzheimer disease. Arch Neurol 65: 45–53. [DOI] [PubMed] [Google Scholar]
- 30. Aulchenko YS, Ripke S, Isaacs A, van Duijn CM (2007) GenABEL: an R library for genome-wide association analysis. Bioinformatics 23: 1294–1296. [DOI] [PubMed] [Google Scholar]
- 31. Delaneau O, Marchini J, Zagury JF (2012) A linear complexity phasing method for thousands of genomes. Nat Methods 9: 179–181. [DOI] [PubMed] [Google Scholar]
- 32. Howie B, Fuchsberger C, Stephens M, Marchini J, Abecasis GR (2012) Fast and accurate genotype imputation in genome-wide association studies through pre-phasing. Nat Genet 44: 955–959. [DOI] [PMC free article] [PubMed] [Google Scholar]
- 33. Howie B, Marchini J, Stephens M (2011) Genotype imputation with thousands of genomes. G3 (Bethesda) 1: 457–470. [DOI] [PMC free article] [PubMed] [Google Scholar]
- 34. Zheng J, Li Y, Abecasis GR, Scheet P (2011) A comparison of approaches to account for uncertainty in analysis of imputed genotypes. Genet Epidemiol 35: 102–110. [DOI] [PMC free article] [PubMed] [Google Scholar]
- 35. Willer CJ, Li Y, Abecasis GR (2010) METAL: fast and efficient meta-analysis of genomewide association scans. Bioinformatics 26: 2190–2191. [DOI] [PMC free article] [PubMed] [Google Scholar]
- 36. Rhinn H, Fujita R, Qiang L, Cheng R, Lee JH, et al. (2013) Integrative genomics identifies APOE epsilon4 effectors in Alzheimer’s disease. Nature 500: 45–50. [DOI] [PubMed] [Google Scholar]
- 37. Aulchenko YS, Struchalin MV, van Duijn CM (2010) ProbABEL package for genome-wide association analysis of imputed data. BMC Bioinformatics 11: 134. [DOI] [PMC free article] [PubMed] [Google Scholar]
- 38. Bertram L, McQueen MB, Mullin K, Blacker D, Tanzi RE (2007) Systematic meta-analyses of Alzheimer disease genetic association studies: the AlzGene database. Nat Genet 39: 17–23. [DOI] [PubMed] [Google Scholar]
- 39. Jonsson T, Stefansson H, Steinberg S, Jonsdottir I, Jonsson PV, et al. (2013) Variant of TREM2 associated with the risk of Alzheimer’s disease. N Engl J Med 368: 107–116. [DOI] [PMC free article] [PubMed] [Google Scholar]
- 40. Guerreiro R, Wojtas A, Bras J, Carrasquillo M, Rogaeva E, et al. (2013) TREM2 variants in Alzheimer’s disease. N Engl J Med 368: 117–127. [DOI] [PMC free article] [PubMed] [Google Scholar]
- 41. Chen GY, Muramatsu H, Ichihara-Tanaka K, Muramatsu T (2004) ZEC, a zinc finger protein with novel binding specificity and transcription regulatory activity. Gene 340: 71–81. [DOI] [PubMed] [Google Scholar]
- 42. Wu C, Orozco C, Boyer J, Leglise M, Goodale J, et al. (2009) BioGPS: an extensible and customizable portal for querying and organizing gene annotation resources. Genome Biol 10: R130. [DOI] [PMC free article] [PubMed] [Google Scholar]
- 43. Derrien T, Johnson R, Bussotti G, Tanzer A, Djebali S, et al. (2012) The GENCODE v7 catalog of human long noncoding RNAs: analysis of their gene structure, evolution, and expression. Genome Res 22: 1775–1789. [DOI] [PMC free article] [PubMed] [Google Scholar]
- 44. Sauna ZE, Kimchi-Sarfaty C (2011) Understanding the contribution of synonymous mutations to human disease. Nat Rev Genet 12: 683–691. [DOI] [PubMed] [Google Scholar]
- 45. Nackley AG, Shabalina SA, Tchivileva IE, Satterfield K, Korchynskyi O, et al. (2006) Human catechol-O-methyltransferase haplotypes modulate protein expression by altering mRNA secondary structure. Science 314: 1930–1933. [DOI] [PubMed] [Google Scholar]
- 46. Kimchi-Sarfaty C, Oh JM, Kim IW, Sauna ZE, Calcagno AM, et al. (2007) A “silent” polymorphism in the MDR1 gene changes substrate specificity. Science 315: 525–528. [DOI] [PubMed] [Google Scholar]
- 47. Dickson SP, Wang K, Krantz I, Hakonarson H, Goldstein DB (2010) Rare variants create synthetic genome-wide associations. PLoS Biol 8: e1000294. [DOI] [PMC free article] [PubMed] [Google Scholar]
- 48. Cirulli ET, Goldstein DB (2010) Uncovering the roles of rare variants in common disease through whole-genome sequencing. Nat Rev Genet 11: 415–425. [DOI] [PubMed] [Google Scholar]
- 49. Hunt KA, Mistry V, Bockett NA, Ahmad T, Ban M, et al. (2013) Negligible impact of rare autoimmune-locus coding-region variants on missing heritability. Nature 498: 232–235. [DOI] [PMC free article] [PubMed] [Google Scholar]
- 50. Huang J, Ellinghaus D, Franke A, Howie B, Li Y (2012) 1000 Genomes-based imputation identifies novel and refined associations for the Wellcome Trust Case Control Consortium phase 1 Data. Eur J Hum Genet 20: 801–805. [DOI] [PMC free article] [PubMed] [Google Scholar]
- 51. de Bakker PI, Ferreira MA, Jia X, Neale BM, Raychaudhuri S, et al. (2008) Practical aspects of imputation-driven meta-analysis of genome-wide association studies. Hum Mol Genet 17: R122–128. [DOI] [PMC free article] [PubMed] [Google Scholar]
- 52. Skol AD, Scott LJ, Abecasis GR, Boehnke M (2007) Optimal designs for two-stage genome-wide association studies. Genet Epidemiol 31: 776–788. [DOI] [PubMed] [Google Scholar]
- 53. Bansal V, Libiger O, Torkamani A, Schork NJ (2010) Statistical analysis strategies for association studies involving rare variants. Nat Rev Genet 11: 773–785. [DOI] [PMC free article] [PubMed] [Google Scholar]
- 54.Bansal V, Libiger O, Torkamani A, Schork NJ (2011) An application and empirical comparison of statistical analysis methods for associating rare variants to a complex phenotype. Pac Symp Biocomput: 76–87. [DOI] [PMC free article] [PubMed]
Associated Data
This section collects any data citations, data availability statements, or supplementary materials included in this article.
Supplementary Materials
Supplement text, tables, and figures.
(DOCX)
Data Availability Statement
The authors confirm that all data underlying the findings are fully available without restriction. ADNI data were obtained from https://ida.loni.ucla.edu. GenADA (dbGaP accession number: phs000219.v1) [28,29], eMERGE (dbGaP accession number: phs000234.v1), NIA-LOAD (dbGaP accession number: phs000168.v1), and the Framingham study (dbGaP accession number: phs000007.v16) data were downloaded from dbGaP (http://www.ncbi.nlm.nih.gov/gap).