Abstract
A facile one-step microwave-assisted chemical method has been successfully used for the synthesis of Cu2O/reduced graphene oxide (RGO) composites. Photocatalytic CO2 reduction was then investigated on the junction under ambient conditions. The RGO coating dramatically increases Cu2O activity for CO2 photoreduction to result in a nearly six times higher activity than the optimized Cu2O and 50 times higher activity than the Cu2O/RuOx junction in the 20th hour. Furthermore, an apparent initial quantum yield of approximately 0.34 % at 400 nm has been achieved by the Cu2O/RGO junction for CO2 photoreduction. The photocurrent of the junction is nearly double that of the blank Cu2O photocathode. The improved activity together with the enhanced stability of Cu2O is attributed to the efficient charge separation and transfer to RGO as well as the protection function of RGO, which was proved by XRD, SEM, TEM, X-ray photoelectron spectroscopy, photo-electrochemical, photoluminescence, and impedance characterizations. This study further presents useful information for other photocatalyst modification for efficient CO2 reduction without the need for a noble-metal co-catalyst.
Keywords: carbon, copper, graphene, photosynthesis, reduction
Introduction
In the past decades, the significant rise in greenhouse gas CO2 and the concern about the security of energy supply have received much attention and are regarded as the biggest challenges of the century. The conversion of CO2 into useful chemicals or fuels by artificial photosynthesis has been considered as one of the most promising and compelling approaches to solve both energy and environmental problems simultaneously.1 Since the discovery of the photoreduction of CO2 to form valuable chemicals by using semiconductors, many photocatalysts have been reported.2 However, the current CO2 photoreduction efficiency is still very moderate. Generally, the fast recombination of charge carriers and the mismatch between the band gap of photocatalysts and solar radiation spectrum are the key factors that limit the efficiency of artificial photosynthesis.3, 4 Many effective and lost-cost photocatalysts such as TiO2 are only sensitive to UV light, which only comprises a small fraction of solar energy that reaches the Earth’s surface. The development of visible-light-driven semiconductors for artificial photosynthesis is a topic of great interest with practical importance.5
Cuprous oxide, a direct-band-gap (2.0 eV) semiconductor, is an attractive p-type oxide for visible-light-driven artificial photosynthesis, such as photo-electrochemical water splitting.6, 7 In theory, the narrow band gap and appropriate positioning of the conduction and valence bands also make it an ideal photocatalyst for CO2 photoreduction.8, 9 In our preliminary research, Cu2O has been used for the photoconversion of CO2 into CO, which is a value-added chemical for various synthetic reactions (e.g., Fischer–Tropsch synthesis) and significant fuel for energy generation. The selectivity and activity of Cu2O crystals was improved by controlling the facets that were exposed and loading RuOx as a co-catalyst.10 Furthermore, we found that the spherical aggregates suppressed unexpected H2 production to improve CO2 reduction. However, the stability of Cu2O is a serious issue as the redox potentials for the reduction and oxidation of monovalent copper oxide lie within the band gap.11 In addition, the activity of the photocatalyst for CO2 reduction is quite moderate. Thimsen et al. reported recently that Cu2O with Al-doped zinc oxide and titanium oxide as protective layers improved the photostability of Cu2O for photo-electrochemical water splitting.11 Therefore, we attempt to improve both the stability and activity of the Cu2O for CO2 photoreduction by making an efficient junction composite, which is highly desirable for artificial photosynthesis in a sustainable manner.
As a result of the promising electronic and catalytic properties, carbonaceous nanomaterials have been utilized extensively to improve the performance of photocatalysts.12 For example, the presence of a thin protective carbon layer could remarkably improve the photostability as well as photocurrent density of cuprous oxide nanowire arrays.13 Graphene, a 2 D monolayer of sp2-hybridized carbon atoms, has attracted intense attention in recent years because of its excellent physical and chemical properties. There is an increasing interest in the rational design of graphene-based photocatalysts for solar fuel production, and these are usually prepared by the reduction of graphene oxide (commonly referred to as RGO). However, few graphene-based materials, for example, those bonded with the wide-band gap materials TiO2, WO3, and Ta2O5, have been developed for the photoreduction of CO2, although there are several reports on photocatalytic water splitting because of the extreme thermodynamic inertness of CO2.14–17 A graphene-containing narrow-band-gap photocatalyst is thus highly desirable for CO2 photoreduction, which has been less reported. With a combination of the potential advantages of Cu2O and RGO, Cu2O/RGO composites were targeted in our study, which could be attractive as visible-light-driven CO2 reduction catalysts in which RGO can not only act as an ideal electron trapper to hinder fast charge recombination but also as a stabilizer to improve the stability of Cu2O.18
Herein, for the first time we demonstrated a microwave-assisted method for the fabrication of Cu2O/RGO composites, which were used for CO2 photoconversion. As a result of the efficient interfacial charge separation and transfer, Cu2O/0.5 % RGO composites exhibit a high efficiency for photocatalytic CO2 conversion without the need for a noble-metal co-catalyst. The stability of the photocatalysts is also improved remarkably by coupling with RGO and shows a linear relationship between the reaction activity and reaction time. The reason behind the enhancement was also investigated and is discussed.
Results and Discussion
As proved in our previous study, spherical Cu2O aggregates (cuboid microstructure) characterized by exposed {1 0 0} facets are better for CO2 conversion than octahedral Cu2O particles characterized by exposed {1 1 1} facets.8 The spherical Cu2O aggregates are referred to herein as the photocatalysts. The XRD patterns of spherical Cu2O and Cu2O/RGO composites both prepared by an identical one-step microwave-assisted chemical route are shown in Figure 1. All the diffraction peaks in the XRD patterns of both samples match well with those of cubic-phase Cu2O (JCPDS No.78-2076). For Cu2O/RGO composites, no peaks that correspond to RGO, Cu, CuO, or Cu(OH)2 were detected. The absence of diffraction peaks of carbon species is attributed to the low amount and the relatively low diffraction intensity of RGO.19
Figure 1.
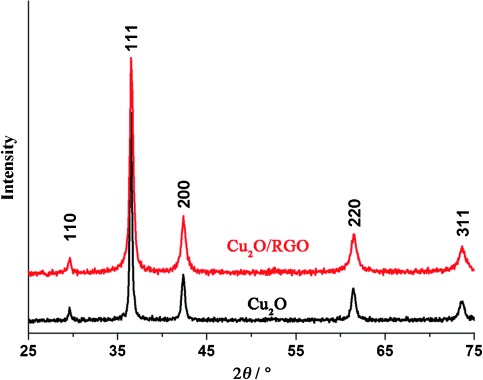
XRD patterns of Cu2O and Cu2O/RGO composites.
The morphology of Cu2O and Cu2O/RGO composites was investigated by SEM and TEM. Blank Cu2O presents a typical morphology of spherical aggregates with an average diameter of approximately 5 μm (Figure 2 a). The morphology of exfoliated GO sheets, which are used as precursor to fabricate Cu2O/RGO composites, is shown in Figure 2 b. The thin sheet shows a typical 2 D structure with many wrinkles and folds. In most cases, the introduction of RGO has a negligible influence on the morphology of the product. The flexible RGO sheets can be observed clearly on the surface of the spherical aggregates, which indicates the formation of Cu2O/RGO composites (Figures 2 c and S1 a). As reported, the formation of Cu2O/RGO aggregates is a result of the strong affinity between the metal oxide and the abundant functional groups of graphene oxide.18, 20 The intimate contact between the RGO sheet and Cu2O microspheres was further confirmed by TEM (Figure 2 d).
Figure 2.
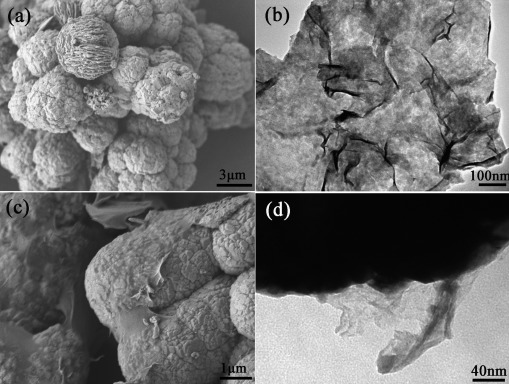
(a) SEM image of Cu2O microspheres. (b) TEM image of graphene oxide. (c) SEM image of Cu2O/RGO composites. (d) TEM image of Cu2O/RGO composites.
The structures of the as-prepared photocatalysts were characterized by X-ray photoelectron spectroscopy (XPS; Figure S1 b). To investigate the degree of reduction of GO in the reduction process, high-resolution C 1s XPS spectra were collected from Cu2O/RGO composites (Figure 3 a). The C 1s spectrum can be deconvoluted into three peaks at 284.6, 285.8, and 288.7 eV, which are associated with graphitic sp2 carbon (C=C/C–C), carbonyl (C–O), and carboxyl (O–C=O) functional groups, respectively.21 The relative content of graphitic carbon in the sample is estimated to be 69.6 %, which is much higher than 41.9 % of GO.22 The much stronger peaks related to graphitic sp2 carbon suggests considerable deoxygenation in the one-step hydrothermal reaction, which leads to the formation of RGO in the composites. The fitted Cu 2p spectra of Cu2O and Cu2O/RGO composites are shown in Figure 3 b and c, respectively, which assists the determination of the oxidation sates of Cu elements. In the asymmetric core-level spectrum, the peaks at 932.4 and 952.2 eV correspond to the binding energy of Cu 2p3/2 and Cu 2p1/2 of Cu2O or Cu, and those at 934.3 and 953.8 eV are attributed to CuO.23 The appearance of weak and broad satellite peaks around 943.0 eV also confirms the coexistence of a trace amount of CuO, although it is not detected in the XRD measurements.24 This can be ascribed to the relatively small amount and the amorphous nature of CuO that might be because of surface oxidization of Cu2O.
Figure 3.
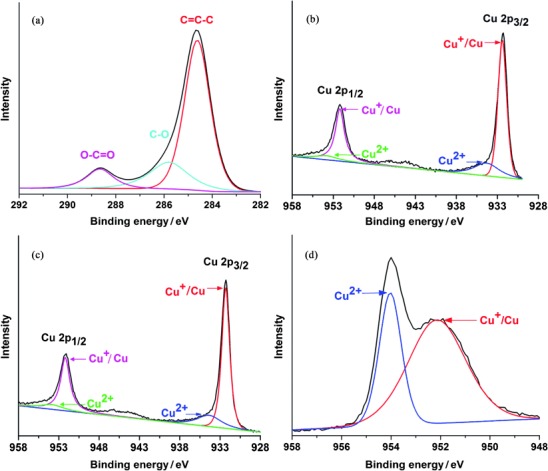
(a) C 1s spectrum of Cu2O/RGO composites. (b) Cu 2p spectrum of Cu2O. (c) Cu 2p spectrum of Cu2O/RGO composites. d() Cu 2p spectrum of Cu2O treated under air atmosphere.
The activity of samples for the photoreduction of CO2 was then evaluated at ambient temperature under 150 W Xe lamp irradiation. To exclude the possible influence of contaminants on the solid composite photocatalyst, a thermal pretreatment was performed before each photocatalytic test. Based on the control photocatalytic experiment under identical conditions but in the absence of CO2 (Cu2O/0.5 % RGO composites under Ar atmosphere), the negligible amount of CO (Figure S2 a) indicates that the surface of the photocatalysts is clean and RGO cannot be converted to CO under these experimental conditions. Furthermore, no obvious CO is detected either in the absence of light or photocatalyst (Figure S2 a). The activity of Cu2O and Cu2O/RuOx samples was tested firstly, with a thermal pretreatment in air similar to that reported before.10 The evolution of CO is detected as the major product if spherical Cu2O aggregates are used as the photocatalyst without a noble-metal co-catalyst (Figure 4 a), in agreement with the previous report.10 Cu2O treated in air, Cu2O/RuOx treated in air, and Cu2O treated in Ar show different activities. The amount of CO produced by Cu2O treated in Ar is at least three times greater in 2 h compared with the sample treated in air. The difference is because of the amount of CuO, which is much higher in the latter than the former as proved later. As we recently also found that the active component for H2 production in a CuxO/TiO2 junction is Cu2O rather than CuO,25 it is informative to evaluate the ability of CuO for CO2 photoreduction. A similar microwave-assisted hydrothermal reaction was used to fabricate a CuO photocatalyst. Less than 10 ppm CO is detected after 6 h (Figure S2 b), which is much poorer than any Cu2O-based photocatalyst. It is clear that RGO exhibits a significant influence on the yield of CO as even a small amount of RGO leads to a twofold enhancement in the reaction activity. The Cu2O/0.5 % RGO composites produce CO at an average of 50 ppm g−1 h−1 nearly linearly for 20 h.26, 27 This average value is approximately one order of magnitude higher than that of Cu2O treated under air and even four times higher than the Cu2O/RuOx junction reported previously. We also measured possible products, for example, methanol, in solution but did not find other product except CO (Figure S3). To clarify the origin of the CO generated during the reaction, the photoreduction of 13C-labeled CO2 was conducted by using the Cu2O/RGO photocatalyst. Negligible 12CO (m/z=28) is observed in the mass spectrum (Figure 4 c). The dominant peak of 13CO (m/z=29) clearly indicates that the evolved CO originates entirely from the photoreduction of 13C-labeled CO2 rather than organic contaminants that might be adsorbed on the photocatalyst surface or in the reactor if Cu2O/RGO is used as the photocatalyst.28, 29 Furthermore, we compared Cu2O/RGO with P25 TiO2 for CO2 conversion under the full arc irradiation of a 150 W Xe lamp. Cu2O/RGO exhibits at least 20 times higher activity than P25 TiO2 under identical experimental conditions (Figure 4 d).15
Figure 4.
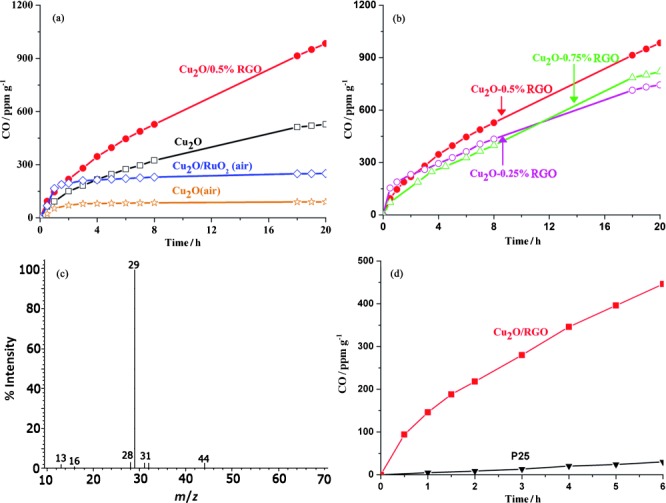
(a) Time-dependent photocatalytic conversion of CO2 into CO over Cu2O and Cu2O/RGO composites. (b) Photocatalytic conversion of CO2 over Cu2O/RGO composites with different amounts of RGO (0.5 g photocatalysts, sodium sulfite as a hole scavenger, full arc irradiation of a 150 W Xe lamp). (c) MS spectrum of the gas-phase products of 13CO2 photoreduction by the Cu2O/RGO photocatalyst. (d) Time-dependent photocatalytic conversion of CO2 over Cu2O/RGO and P25.
The composite was also optimized as shown in Figure 4 b. An appropriate loading amount of RGO is crucial to achieve the best photocatalytic activity, which is 0.5 % RGO. Less RGO cannot separate electrons from holes efficiently, and more RGO would block light absorption.30 The optical absorption of the photocatalysts was investigated accordingly. Interestingly, the absorption ability of Cu2O is relatively enhanced in both the UV and visible regions if coupled with 0.5 % RGO (Figure 5 a). As a result of the very thin layer of RGO synthesized, we cannot attribute the enchanted absorption to RGO absorption only. This might be because of the scattering of the RGO layer to Cu2O. Compared to blank Cu2O, a slight redshift of the light absorption edge is also observed, which could be attributed to the hybridization of the carbon material.30, 31 As a result, the band gap of the Cu2O/RGO composites is estimated to be 1.94 eV, which is somewhat smaller than that of Cu2O (1.98 eV).
Figure 5.
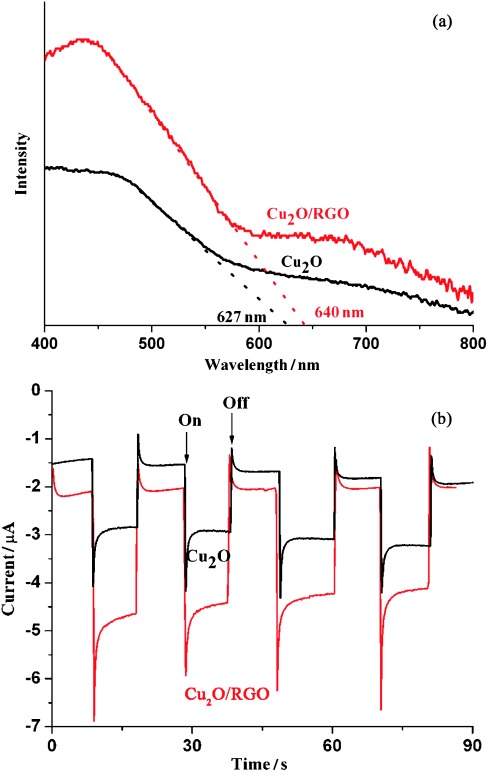
(a) UV/Vis spectra of Cu2O and Cu2O/0.5 % RGO composites. (b) Photocurrent response of Cu2O and Cu2O/RGO electrodes (full spectrum, 150 W Xe lamp, 0.5 m NaSO4 solution, pH=6.8).
To prove the impact of RGO on the separation and transport of photogenerated charge carriers, photocurrent measurements were performed by depositing these materials on fluorine-doped tin oxide (FTO) electrodes. The fast and reproducible photocurrent response for each switch-on and switch-off light cycle in both p-type Cu2O (treated in Ar) and Cu2O/RGO electrodes is shown in Figure 5 b. Under irradiation, the photocurrent of the Cu2O/RGO electrode is approximately 1.6 times higher than the blank Cu2O electrode prepared in Ar, which is consistent with the results of CO2 photoconversion. As the photocurrent is dominated by electron transfer in the p-type photoelectrodes, the enhanced photocurrent can be regarded as straightforward evidence for the improved separation of electrons from holes in Cu2O. The trapped electrons in RGO can be transferred readily to the FTO conductive glass because of the Ohmic contact between them, which minimizes charge recombination losses.32
The effect of RGO on the stability of Cu2O during the photocatalytic reaction is clear. Photocatalysts treated under an air atmosphere suffer a dramatic decrease of CO production within the first hour. Differently, the profile of the composite activity is a nearly linear increase that can be maintained for more than 20 h. To further indicate the stability issue, the yields of CO in the 20th hour over different photocatalysts are shown in Figure 6 a. As can be seen, 46 ppm g−1 CO is produced over Cu2O/0.5 % RGO, which is 5.7 times higher than that of blank Cu2O (8 ppm g−1). Compared to Cu2O treated in air and Cu2O/RuOx (both less than 1 ppm g−1), more than 50 times enhancement has been achieved. The poor stability of Cu2O and Cu2O/RuOx treated under an air atmosphere is attributed to the partial oxidation of CuO upon heating. The XPS peak that corresponds to Cu2+ is much higher than that in the Cu2O sample treated under an Ar atmosphere (Figure 3 d). As a result of the more positive conduction band of CuO, the relatively high amount of CuO inevitably results in deteriorated photocatalytic activity for CO production, which agrees well with previous results.25, 33
Figure 6.
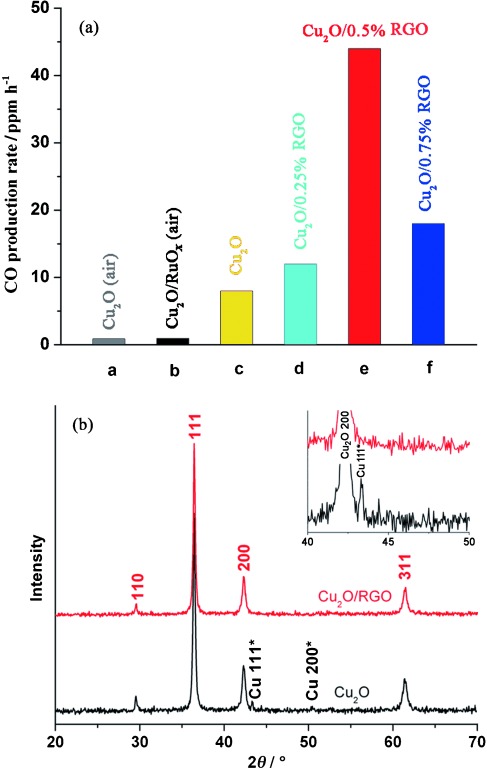
(a) CO yield in the 20th hour over different photocatalysts. (b) XRD patterns of Cu2O and Cu2O/RGO after the photocatalytic reaction.
To investigate the structural changes of Cu2O under irradiation, Cu2O treated under Ar and Cu2O/0.5 % RGO were collected after the photoreduction reaction and characterized by XPS and XRD measurements. The XPS spectra of Cu2O and Cu2O/0.5 % RGO composites after the photocatalytic reaction are shown in Figure S4. Compared with the data shown in Figure 3 b and c, the partial transformation of Cu2O into CuO is confirmed by the increased peak intensities that correspond to CuO. These results indicate that the activity and stability of Cu2O-based photocatalysts during CO2 photoreduction show a strong dependence on the oxidation state of Cu. RGO can protect the Cu2O surface from oxidation as indicated by XPS measurements, which is similar to a Cu2O nanowire coated with a carbon layer for efficient water reduction.13 Furthermore, the reduction of Cu+ into Cu metal is the other issue that influences the photocatalyst activity and stability, which cannot be identified easily by XPS. In the XRD pattern of Cu2O after the photocatalytic reaction (Figure 6 b), two additional peaks at around 43.3 and 50.4° are observed, which can be indexed to Cu metal (JCPDS No. 04-0836). The appearance of Cu metal indicates concomitant light-induced reduction reaction under irradiation. However, no peak that corresponds to Cu is detected in the Cu2O/RGO composites after the reaction. It is reasonable that the efficient electron transfer from Cu2O to RGO results in the inhibited reduction of Cu+, which also improves the stability of the photocatalyst.
Leaching experiments are usually used to evaluate photocorrosion during a photocatalytic reaction. The leaching of Cu from the photocatalysts was studied by analyzing the change of concentration of Cu ions in the solution by using inductively coupled plasma optical emission spectrometry (ICP-OES). The leaching of Cu caused by photocorrosion is only 96 ppm for Cu2O/RGO (Figure 7 a). However, Cu2O suffers much more serious photocorrosion with a value of 2670 ppm after 3 h. These results agree well with the inconspicuous morphological change of Cu2O/RGO photocatalysts (Figure S5). Furthermore, Cu2O/RGO composites exhibit reproducible activity during four consecutive runs (Figure S6).
Figure 7.
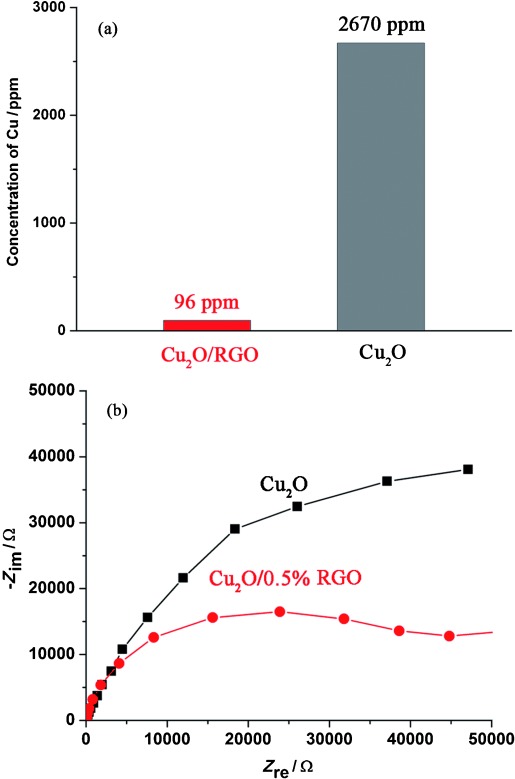
(a) Leaching of Cu caused by photocorrosion after 3 h reaction time. (b) EIS of Cu2O and Cu2O/RGO composite electrodes.
Electrochemical impedance spectroscopy (EIS) was used to study the influence of RGO on the conductivity and charge transfer of the materials. The Nyquist plot of Cu2O/0.5 % RGO has a much smaller radius than that of blank Cu2O (Figure 7 b). As reported, the semicircle in a Nyquist plot at high frequencies is characteristic of the charge transfer process and the diameter of the semicircle is an indicator of the charge transfer resistance.34 The smaller resistance of Cu2O/RGO composites further confirms that the thin layer of RGO with good conductivity does not block electron transfer but facilitates electron migration to the reaction sites on the surface of the composite.
Mott–Schottky analysis was used to determine both the donor density and flat-band potential (EFB) at the semiconductor–liquid interface. Both Cu2O and Cu2O/RGO show a negative slope (Figure 8 a), which indicates p-type semiconductor properties.35 The sample with 0.5 % RGO exhibits a smaller slope in the Mott–Schottky plot than blank Cu2O, which suggests an increase of donor density. The flat-band potentials of Cu2O and Cu2O/0.5 % RGO, calculated from the x intercepts of the linear region, are −0.11 and −0.08 V vs. Ag/AgCl, respectively. Generally, the potential measured against an Ag/AgCl reference can be converted into normal hydrogen electrode (NHE) potentials by using Equation (1):36
Figure 8.
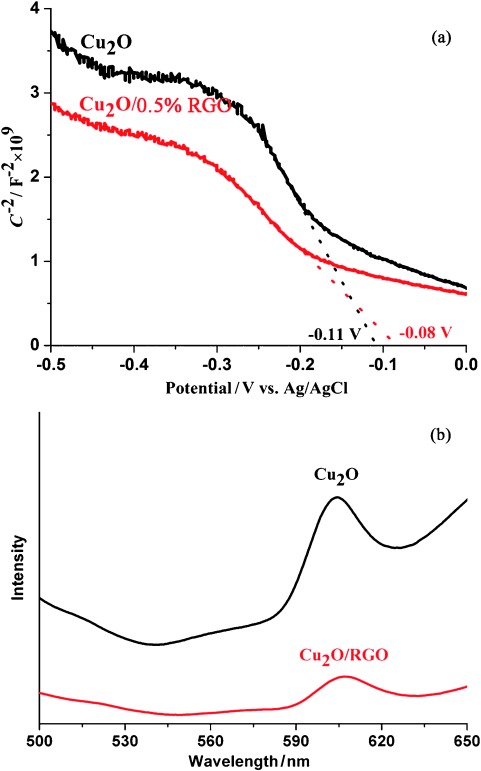
(a) Mott–Schottky plots of Cu2O and Cu2O/RGO. (b) PL spectra of Cu2O and Cu2O/RGO.
| (1) |
The measured pH value of the electrolyte is approximately 6.8, and EAgCl=0.197 V. Therefore, the calculated flat-band positions of Cu2O and Cu2O/RGO are 0.47 and 0.5 V vs. NHE (pH 0), thus the wrapping of Cu2O by RGO has little influence on the potential of the photogenerated holes.37 The influence of RGO on the recombination of electron–hole pairs was further confirmed by photoluminescence (PL) measurements, which are widely used to study the efficiency of charge-carrier trapping, migration, and transfer in photocatalysts. The PL spectra of Cu2O and Cu2O/RGO composites under an excitation wavelength of 400 nm are presented in Figure 8 b. Cu2O shows a broad PL emission peak at around 605 nm. As expected, Cu2O/RGO shows an extremely reduced PL intensity, which indicates the mitigated charge recombination in comparison to Cu2O.38 Generally, this is attributed to the efficient charge transfer from Cu2O to RGO, which leads to an improvement in the separation efficiency of the light-stimulated carriers.39 Following the significantly improved photocatalytic activity and stability, the apparent quantum yield of Cu2O/RGO was measured in the visible region to be approximately 0.34 % at 400 nm.
Based on these results, the reasons for the superior photocatalytic activity and stability of Cu2O/RGO during noble-metal-free CO2 reduction are illustrated in Scheme 1. The electronic structures of Cu2O and RGO are discussed first. With a band gap of 1.94 eV and a valance band at around 0.5 eV, the conduction band of Cu2O in the composites is estimated to be −1.44 eV vs. NHE (pH 0). RGO, with superior conductivity, can enhance the charge separation significantly, which is crucial for the electron-dominated reduction reaction.39, 40 Secondly, with a lower activation potential and more active sites for the photoreduction reaction, RGO is considered as a promising 2 D substrate for solar fuel production compared to others reported for water splitting.41 Furthermore, it has been reported that the restrained accumulation of electrons and decreased local electron density in graphene-based composites can facilitate the two-electron interaction for CO production selectively.42 Finally, the role of RGO as an electron acceptor that can extract electrons from Cu2O retards the possible reduction of Cu2O efficiently and improves photostability of the photocatalyst significantly.43 Furthermore, the presence of the RGO layer also prevents the direct contact of Cu2O with water, which slows the oxidation of Cu2O into CuO.44
Scheme 1.
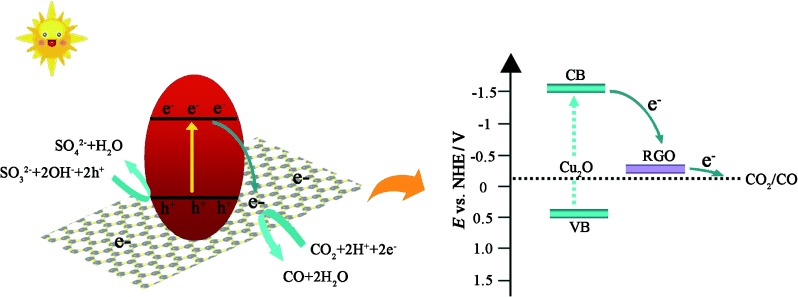
Schematic illustration of the charge transfer in Cu2O/RGO composites.
Conclusions
A microwave-assisted in situ reduction chemical method has been used to fabricate Cu2O/reduced graphene oxide (RGO) junction composites for the photocatalytic reduction of CO2. By coupling with RGO, the photoreduction activity of Cu2O was enhanced by two times, with CO as the only reduction product. Furthermore, an almost linear reactivity for CO2 conversion has been achieved, which represents an approximately six times increase of the CO production rate in the 20th hour compared with blank Cu2O to result in an apparent quantum yield of approximately 0.344 % in the visible region (at 400 nm). Stability is an issue for a Cu2O photocatalyst. The incorporation of RGO into Cu2O improves the photocatalyst stability remarkably, which shows a great potential for CO2 conversion in a sustainable manner. Based on the optical and electrochemical measurements, the superior photocatalytic activity and stability of Cu2O/RGO composites are ascribed to the retarded electron–hole recombination, efficient charge transfer, and protective function of RGO. This work opens a promising prospect for the utilization of Cu2O/RGO as a visible-light-driven photocatalyst for CO2 photoconversion without the need for a noble-metal co-catalyst.
Experimental Section
Synthesis of Cu2O/RGO junction composites
Graphene oxide (GO) solution was synthesized from natural graphite powder by a modification of Hummers’ method.45 Cu2O/RGO composites were fabricated by a microwave-assisted hydrothermal reaction. Firstly, Cu(NO3)2 was added to a mixture of ethanol and water in the ratio of 64:36. Then, a calculated amount of GO solution and formic acid (3 mL) were added. For optimization, Cu2O/RGO composites with different amounts of RGO were also synthesized, which include Cu2O/0.25 % RGO, Cu2O/0.5 % RGO, and Cu2O/1 % RGO, in which x % represents the calculated weight ratio of the GO added to Cu2O. After stirring for 2 h, the homogeneous solution was heated with stirring in the microwave system at 150 °C for 3 h. After the product was cooled to RT, the final product was collected by centrifugation, washed with water five times, and dried at 70 °C. Blank Cu2O was synthesized through the same procedure, except for the addition of GO solution.
Characterization
XRD was performed by using a Rigaku RINT 2100 diffractometer at a voltage of 40 kV. The morphologies of the products were characterized by field-emission scanning electron microscopy (FESEM, JEOL-6701F) and TEM (JEOL-2010F). UV/Vis spectra were recorded by using a Shimadu UV/Vis 2550 spectrophotometer. XPS measurements were performed by using a Thermo Scientific XPS spectrometer. PL emission spectra were measured at RT by using a fluorescence spectrophotometer (F-4500, Hitachi).
Fabrication of film electrodes and electrochemical measurements
Photocatalyst (5 mg) and Nafion solution (10 μL, 5 wt %) were dispersed in a water/isopropanol mixture (1 mL, 3:1 v/v) by at least 30 min sonication to form a homogeneous catalyst colloid. For the measurements, the catalyst colloid (100 μL) was deposited onto an area of approximately 1 cm2 of the FTO conductive glass to form the working electrode. A Pt wire was used as a counter electrode, and an Ag/AgCl electrode was the reference electrode in the three-electrode photo-electrochemical system. The electrolyte was 0.5 m NaSO4 aqueous solution degassed with Ar. Electrochemical measurements were performed by using an iviumstat potentiostat equipped with Ivium software. EIS were recorded under an alternating current perturbation signal of 10 mV over the frequency range of 1 MHz to 100 mHz. Mott–Schottky plots were obtained under direct current potential polarization. The potential ranged from −1.0 to 0 V with a potential step of 10 mV at a frequency of 1 kHz.
Photocatalytic activity measurements
The CO2 reduction reaction was performed in batches by using a septum-sealed glass chamber with a volume of 120 mL, which was heated at 160° for 1 h prior to measurement. To remove possible trace organic contaminants, photocatalysts were treated at 200 °C for 3 h in a tubular furnace under the protection of Ar or in air (denoted Cu2O treated in Ar or air). A typical photocatalytic experiment was conducted by using 0.5 g of photocatalysts and 3 mL of deionized water in a CO2-purged 120 mL reactor. Excess (0.7 m) sodium sulfite was added to each batch as a hole scavenger.15, 46 A 150 W Xe lamp (Newport) was used as a light source. The light output was measured by using a Newport 1918-R high-performance optical power meter fitted with a Newport 918-D calibrated photodetector equipped with an integrated attenuator. The reaction product was monitored by periodical sampling of the gas phase from the glass chamber by using a gas-tight syringe and analyzed by GC (Varian GC-450) with a thermal conductivity detector (TCD, connected to a molecular sieve column) to detect H2, O2, and N2 and a flame ionization detector (FID, connected to a CP-SIL 5CB capillary column) to detect hydrocarbons. Ar was used as the GC carrier gas. A methanizer was installed to enable the FID to detect CO with 1000× higher sensitivity. For the isotope-tracer experiment, the same photocatalytic procedure was used. After the addition of Cu2O/RGO (0.5 g) into CO2-saturated water (10 mL), the septum-sealed reactor was purged by Ar gas for 10 min. Then, 13CO2 (13C 99 %, Sigma–Aldrich) was introduced. The sample was irradiated with a 150 W Xe lamp for 30 min, and then 0.5 mL of the reaction product taken from the vessel headspace was analyzed by GC–MS (Shimadzu QP-2010SE) with a molecular sieve 5 Å capillary column. He gas was used as carrier gas during the measurement.
Acknowledgments
X.A and J.T. acknowledge financial support from the European Commission under the 7th Framework Energy Program (Project reference: 309636). K.L. and J.T. are also thankful for a grant from the Qatar National Research Fund under its National Priorities Research Program award number NPRP 09-328-2-122. The contents of this paper are solely the responsibility of the authors and do not necessarily represent the official views of the Qatar National Research Fund.
Supporting Information
As a service to our authors and readers, this journal provides supporting information supplied by the authors. Such materials are peer reviewed and may be re-organized for online delivery, but are not copy-edited or typeset. Technical support issues arising from supporting information (other than missing files) should be addressed to the authors.
miscellaneous_information
References
- 1.Habisreutinger S, Schmidt-Mende L, Stolarczyk J. Angew. Chem. Int. Ed. 2013;52:7372–7408. doi: 10.1002/anie.201207199. [DOI] [PubMed] [Google Scholar]
- Angew. Chem. 2013;125 [Google Scholar]
- 2.Inoue T, Fujishima A, Konishi S, Honda K. Nature. 1979;277:637. [Google Scholar]
- 3.Tang J, Durrant J, Klug D. J. Am. Chem. Soc. 2008;130:13885–13891. doi: 10.1021/ja8034637. [DOI] [PubMed] [Google Scholar]
- 4.Tang J, Cowan A, Durrant J, Klug D. J. Phys. Chem. C. 2011;115:3143–3150. [Google Scholar]
- 5.Navalón S, Dhakshinamoorthy A, Alvaro M, Garcia H. ChemSusChem. 2013;6:562–577. doi: 10.1002/cssc.201200670. [DOI] [PubMed] [Google Scholar]
- 6.Wang M, Sun L, Lin Z, Cai J, Xie K, Lin C. Energy Environ. Sci. 2013;6:1211–1220. [Google Scholar]
- 7.Paracchino A, Mathews N, Hisatomi T, Stefik M, Tilley S, Grätzel M. Energy Environ. Sci. 2012;5:8673–8681. [Google Scholar]
- 8.Tran P, Wong L, Barberbcd J, Loo J. Energy Environ. Sci. 2012;5:5902–5918. [Google Scholar]
- 9.Ghadimkhani G, Tacconi N, Chanmanee W, Janakyab C, Rajeshwar K. Chem. Commun. 2013;49:1297–1299. doi: 10.1039/c2cc38068d. [DOI] [PubMed] [Google Scholar]
- 10.Handoko A, Tang J. Int. J. Hydrogen Energy. 2013;38:13017–13022. [Google Scholar]
- 11.Paracchino A, Laporte V, Sivula K, Grätzel M, Thimsen E. Nat. Mater. 2011;10:456–461. doi: 10.1038/nmat3017. [DOI] [PubMed] [Google Scholar]
- 12.Li B, Liu T, Hu L, Wang Y. J. Phys. Chem. Solids. 2013;74:635–640. [Google Scholar]
- 13.Zhang Z, Dua R, Zhang L, Zhu H, Zhang H, Wang P. ACS Nano. 2013;7:1709–1717. doi: 10.1021/nn3057092. [DOI] [PubMed] [Google Scholar]
- 14.Tu W, Zhou Y, Liu Q, Yan S, Bao S, Wang X, Xiao M, Zou Z. Adv. Funct. Mater. 2013;23:1743–1749. [Google Scholar]
- 15.Wang P, Bai Y, Luo P, Liu J. Catal. Commun. 2013;38:82–85. [Google Scholar]
- 16.Lv X, Fu W, Hu C, Chen Y, Zhou W. RSC Adv. 2013;3:1753–1757. [Google Scholar]
- 17.Liang Y, Vijayan B, Gray K, Hersam M. Nano Lett. 2011;11:2865–2870. doi: 10.1021/nl2012906. [DOI] [PubMed] [Google Scholar]
- 18.Tran P, Batabyal S, Pramana S, Barber J, Wong L, Loo S. Nanoscale. 2012;4:3875–3878. doi: 10.1039/c2nr30881a. [DOI] [PubMed] [Google Scholar]
- 19.Lee J, You K, Park C. Adv. Mater. 2012;24:1084–1088. doi: 10.1002/adma.201104110. [DOI] [PubMed] [Google Scholar]
- 20.Li N, Xiao Y, Hu C, Cao M. Chem. Asian J. 2013;8:1960–1965. doi: 10.1002/asia.201300334. [DOI] [PubMed] [Google Scholar]
- 21.An X, Yu J, Wang F, Li C, Li Y. Appl. Catal. B. 2013;129:80–88. [Google Scholar]
- 22.An X, Yu JC, Wang Y, Hu Y, Yu X, Zhang G. J. Mater. Chem. 2012;22:8525–8531. [Google Scholar]
- 23.Qiu X, Miyauchi M, Sunada K, Minoshima M, Liu M, Lu Y, Li D, Shimodaira Y, Hosogi Y, Kuroda Y, Hashimoto K. ACS Nano. 2012;6:1609–1618. doi: 10.1021/nn2045888. [DOI] [PubMed] [Google Scholar]
- 24.Liu H, Wang J, Fan XM, Zhang FZ, Liu HR, Dai J, Xiang FM. Mater. Sci. Eng. 2013;178:158–166. [Google Scholar]
- 25.Wang Z, Liu Y, Wang W, Huang W, Martin D, Tang J. Phys. Chem. Chem. Phys. 2013;15:14956–14960. doi: 10.1039/c3cp52496e. [DOI] [PubMed] [Google Scholar]
- 26.Bazzo A, Urakawa A. ChemSusChem. 2013;6:2095–2102. doi: 10.1002/cssc.201300307. [DOI] [PubMed] [Google Scholar]
- 27.Yan S, Ouyang S, Gao J, Yang M, Feng J, Fan X, Wan L, Li Z, Ye J, Zhou Y, Zou Z. Angew. Chem. 2010;122:6544–6548. doi: 10.1002/anie.201003270. [DOI] [PubMed] [Google Scholar]
- 28.Maeda K, Sekizawa K, Ishitani O. Chem. Commun. 2013;49:10127–10129. doi: 10.1039/c3cc45532g. [DOI] [PubMed] [Google Scholar]
- 29.Sato S, Morikawa T, Kajino T, Ishitani O. Angew. Chem. Int. Ed. 2013;52:988–992. doi: 10.1002/anie.201206137. [DOI] [PubMed] [Google Scholar]
- Angew. Chem. 2013;125 [Google Scholar]
- 30.Zhang Y, Tang Z, Fu X, Xu Y. ACS Nano. 2010;4:7303–7314. doi: 10.1021/nn1024219. [DOI] [PubMed] [Google Scholar]
- 31.Lv X, Fu W, Chang H, Zhang H, Cheng J, Zhang G, Song Y, Hu C, Li J. J. Mater. Chem. 2012;22:1539–1546. [Google Scholar]
- 32.Guo C, Yang H, Sheng Z, Lu Z, Song Q, Li C. Angew. Chem. Int. Ed. 2010;49:3014–3017. doi: 10.1002/anie.200906291. [DOI] [PubMed] [Google Scholar]
- Angew. Chem. 2010;122 [Google Scholar]
- 33.Wang W, Park J, Biswas P. Catal. Sci. Technol. 2011;1:593. [Google Scholar]
- 34.An X, Yu J, Tang J. J. Mater. Chem. A. 2014;2:1000–1005. [Google Scholar]
- 35.Hsu Y, Yu C, Chen Y, Lin Y. J. Power Sources. 2013;242:541–547. [Google Scholar]
- 36.Qiu Y, Yan K, Deng H, Yang S. Nano Lett. 2012;12:407–413. doi: 10.1021/nl2037326. [DOI] [PubMed] [Google Scholar]
- 37.Hsua Y, Yua C, Chen Y, Lin Y. Electrochim. Acta. 2013;105:62–68. [Google Scholar]
- 38.Katsukis G, Malig J, Schulz-Drost C, Leubner S, Jux N, Guldi D. ACS Nano. 2012;6:1915–1924. doi: 10.1021/nn204700z. [DOI] [PubMed] [Google Scholar]
- 39.Hou Y, Laursen A, Zhang J, Zhang G, Zhu Y, Wang X, Dahl S, Chorkendorff I. Angew. Chem. Int. Ed. 2013;52:3621–3625. doi: 10.1002/anie.201210294. [DOI] [PubMed] [Google Scholar]
- Angew. Chem. 2013;125 [Google Scholar]
- 40.Li B, Cao H, Yin G, Lu Y, Yin J. J. Mater. Chem. 2011;21:10645–10648. [Google Scholar]
- 41.Xiang Q, Yu J. J. Phys. Chem. Lett. 2013;4:753–759. doi: 10.1021/jz302048d. [DOI] [PubMed] [Google Scholar]
- 42.Tu W, Zhou Y, Liu Q, Tian Z, Gao J, Chen X, Zhang H, Liu J, Zou Z. Adv. Funct. Mater. 2012;22:1215–1221. [Google Scholar]
- 43.Jia L, Wang D, Huang Y, Xu A, Yu H. J. Phys. Chem. C. 2011;115:11466–11473. [Google Scholar]
- 44.Xiang C, Kimball G, Grimm R, Brunschwig B, Atwater H, Lewis N. Energy Environ. Sci. 2011;4:1311–1318. [Google Scholar]
- 45.Hummers W, Offeman R. J. Am. Chem. Soc. 1958;80:1339–1339. [Google Scholar]
- 46.Zhai Q, Xie S, Fan W, Zhang Q, Wang Y, Deng W, Wang Y. Angew. Chem. Int. Ed. 2013;52:5776–5779. doi: 10.1002/anie.201301473. [DOI] [PubMed] [Google Scholar]
- Angew. Chem. 2013;125 [Google Scholar]
Associated Data
This section collects any data citations, data availability statements, or supplementary materials included in this article.
Supplementary Materials
miscellaneous_information


