Abstract
Background: Previous research suggests that most people with multiple sclerosis (MS) in the United States have health insurance. However, little is known about their coverage or how it differs between public and private insurance. We examined whether the perceived change in health insurance coverage from the previous year differs between individuals with MS who are privately insured compared with those who are publicly insured.
Methods: We present descriptive statistics and odds ratios (ORs) from a multivariate logistic regression using data from the 2009 wave of the Sonya Slifka Longitudinal Multiple Sclerosis Study.
Results: We found that individuals with Medicare were significantly less likely to perceive worse coverage compared with those with private health insurance (OR = 0.53; P < .01). Individuals aged 55 to 64 years were more likely to perceive worse coverage than those aged 18 to 34 years (OR = 2.5; P < .05), while the odds of perceiving worse coverage were significantly lower for individuals who had been diagnosed more than 15 years previously relative to those diagnosed in the past 2 years (OR = 0.48; P < .05).
Conclusions: Individuals with MS and other chronic illnesses who can choose between public and private insurance should be aware that there are important differences in perceptions of health insurance coverage between publicly and privately insured individuals.
People with multiple sclerosis (MS) use health-care services significantly more than those without chronic illness. For example, newly diagnosed individuals see their physicians an average of eight times per year, nearly three times as often as those without MS.1 Furthermore, the frequency with which people with MS require medical care generally increases as the disease progresses, generating costs that grow continually over time.2–5
Health insurance helps to provide people with access to routine medical care and mitigates the costs of unexpected and catastrophic illness. Insurance may be available through an employer, but researchers have found that some employees do not enroll because of rising premium contributions, and even those who do have insurance face difficulty in paying for their care.6–8 Although most people with MS have health insurance, not all needed services are covered adequately.2,9,10
For a sample of individuals with MS in 2009, we examined whether their perceived change in health insurance coverage from the previous year differed between those with private versus public insurance.
Materials and Methods
Data Source
The Sonya Slifka Longitudinal Multiple Sclerosis Study (Slifka Study) is a longitudinal, prospective study that has collected epidemiological, clinical, and health services utilization and cost data by means of computer-assisted telephone interviews since 2000. Survey questions were based to the extent possible on commonly used standardized instruments and are described elsewhere.11
In Cohort 1 of the Slifka Study, a probability sample from the National Multiple Sclerosis Society's mailing list was drawn. This sample was augmented by recruiting participants who were recently diagnosed. This special population was obtained through outreach efforts across the United States; details of the sampling methodology for Cohort 1 are reported elsewhere.11 An additional cohort (Cohort 2) was recruited in 2007 (n = 2478), using the same sampling methods. This sample was augmented by recruiting participants who were recently diagnosed and were African-American, Hispanic, and/or 18 to 24 years old.
The data for this study come from the 2009 interview with both cohorts (n = 2361). Cohort 1 consisted of 834 individuals (612 mailing list subjects; 222 outreach subjects), and Cohort 2 consisted of 1527 individuals (1149 mailing list subjects; 378 outreach subjects).
Weighting
As discussed above, the Slifka Study is a random sample of people with MS with oversampling of recruited subgroups. The vast majority of the oversampled recruited participants were newly diagnosed, making up 20% of the subjects in the dataset, far more than what one would expect in the general US population with MS. Oversampling newly diagnosed patients is especially troublesome for our research purposes because insurance coverage varies with age, and age varies with time since diagnosis.
We applied post-stratification to the Slifka Study sample to represent the population of MS patients in the United States.12 Our post-stratification weighting methodology was a multistep process. We began by grouping respondents by time since diagnosis into 1-year intervals (ie, 2–50 years). We assumed a constant number of new MS diagnoses over the years (note that our weighting scheme does not assume that age and time since diagnosis are collinear). We then calculated the average age for each of the 49 groups and adjusted for the death rate for each year of diagnosis duration (because MS does not affect life expectancy,13 we used the Centers for Disease Control and Prevention's [CDC's] national age-adjusted death rates).14 This approach requires a rough correspondence between time since diagnosis and age. The R-squared of a regression of age on time since diagnosis and time since diagnosis squared is 0.306, justifying the post-stratification weighting scheme.
We trimmed the weights to account for a small number of outliers (ie, respondents who had been diagnosed more than 30 years previously) so that they do not have undue (and inappropriate) influence on results. Finally, to derive the population weights, we multiplied the individual relative weights by a factor such that the sum of the weights across the sample yielded the estimated number of people in the United States with MS. Although there is some debate as to the “true” size of the MS population, we used the National Multiple Sclerosis Society's estimate of 400,000.15 Sample characteristics, both weighted and unweighted, are shown in Supplementary Table 1 (139.6KB, pdf) , which is published in the online version of this article at ijmsc.org.
Table 1.
Descriptive statistics on insured patients with multiple sclerosis (continued)
Measures
Dependent Variable
The 2009 wave of the Slifka Study included a one-time module of questions that asked participants about health insurance, including participants' perceptions of change in their health insurance coverage over the past year: Thinking about your main health insurance plan's coverage for various services, compared with 12 months ago, do you think your health insurance coverage has gotten much better, somewhat better, somewhat worse, much worse, or has remained unchanged?
Because our interest was to better understand the characteristics and factors associated with worse coverage, we collapsed the five responses into two categories: insurance coverage got worse; and insurance coverage did not get worse (ie, stayed the same or got better).
Fifty-five participants (2.3% unweighted) were uninsured at the time of the interview and are not included in our analysis.
Independent Variables
Insurance Type. We hypothesized that individuals with private insurance would be more likely to perceive a decline in coverage compared with individuals with public insurance.
To measure insurance type, we grouped respondents' main insurance into one of four categories: any private insurance, Medicare, Medicaid, and other types of public insurance (eg, TRICARE). A small number of respondents (unweighted n = 26) reported that their main insurance was a Medicare Part D plan or a Medigap plan. In order to have either of these plans, beneficiaries must be enrolled in Medicare. Accordingly, we assigned these respondents' main plan as Medicare.
We included several patient characteristics that may potentially confound the relationship between type of health insurance and perceived coverage:
Health Status. A respondent's health status can affect the type of insurance (eg, people who qualify for Social Security Disability Insurance [SSDI] will also qualify for Medicare regardless of their age). Health status will also likely affect perceived coverage, as individuals with worse health will presumably use more health care. Current health status information is not available for both cohorts, so instead, we use time since diagnosis as a proxy, which is highly correlated with current health status (P < .001; results not shown).
Age. A respondent's age is highly correlated with insurance type, since virtually everyone over the age of 65 is on Medicare. Age is also likely to affect perceived coverage, as older individuals are likely to have worse health and presumably use more health care compared with younger individuals.
Number of Health Plans. Having multiple health plans is more common among those with Medicare, who often have supplemental plans (“Medigap”) and/or drug coverage through a Part D plan. Additionally, having multiple plans for some types of insurance may suggest better perceived coverage compared with those who have only one plan.
We also controlled for other characteristics that may help explain some of the variance in perceived coverage, including gender, race, ethnicity, education, marital status, MS disease course, disability status, current use of a disease-modifying agent (DMA), and whether the respondent experienced any relapses in the past year.
Statistical Methods
We employed a logistic regression to examine the characteristics associated with people's perceived changes in insurance coverage. We omitted missing responses (ie, “refuse,” “don't know,” or not answered), which constitute approximately 1% of all responses. We also excluded respondents who were currently uninsured or did not have health insurance in the past 12 months, or had missing information for main plan or perceived coverage. We used SAS version 9.3 and Stata version 12 for data analysis. We estimated robust standard errors using Huber-White estimators. We report weighted results unless otherwise noted. Our research was approved by Abt Associates' Internal Review Board (IRB).
Results
Sample Characteristics
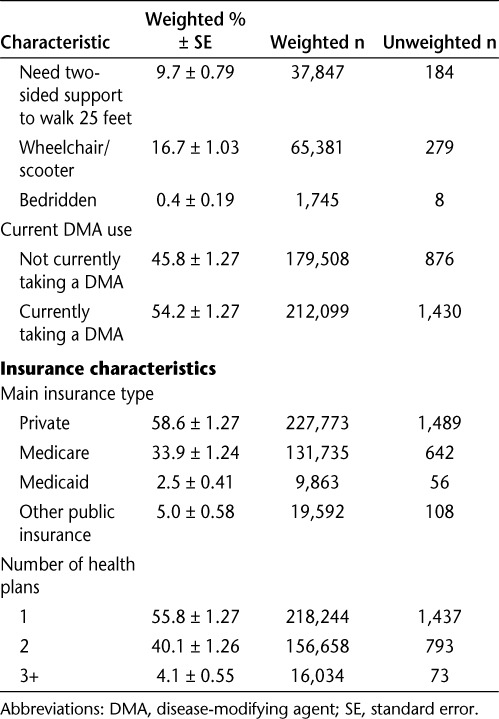
Nearly all of the 2361 participants (unweighted n = 2306; 97.7% and weighted n = 391,607; 97.9%) had health insurance; descriptive statistics on this sample of insured individuals are presented in Table 1. Over three-quarters were female, and most were between 35 and 64 years old. The majority of the sample was white (89.7%) and not of Hispanic ethnicity (95.5%). Most had some college education (81.2%), about one-third were currently working (35.8%), and over half (58.7%) reported an annual family income of at least $50,000. Most of the insured participants were married and lived with others. About 12% of the insured patients had their diagnoses for less than 6 years, and 62% for more than 15 years. Over half (57.9%) of participants reported relapsing-remitting MS (RRMS), 27.8% reported secondary progressive MS (SPMS), 10.3% reported primary progressive MS (PPMS), and 4.0% reported progressive relapsing MS (PRMS). One-third of participants had had at least one relapse in the past year, and a fifth had multiple relapses in the past year. While two-fifths reported little or no trouble walking, 13.7% used unilateral support, 9.7% used bilateral support, and 16.7% required a wheelchair or scooter, and 0.4% were confined to bed. Just over half (54.2%) of the insured participants were taking a DMA at the time of the interview.
Table 1.
Descriptive statistics on insured patients with multiple sclerosis
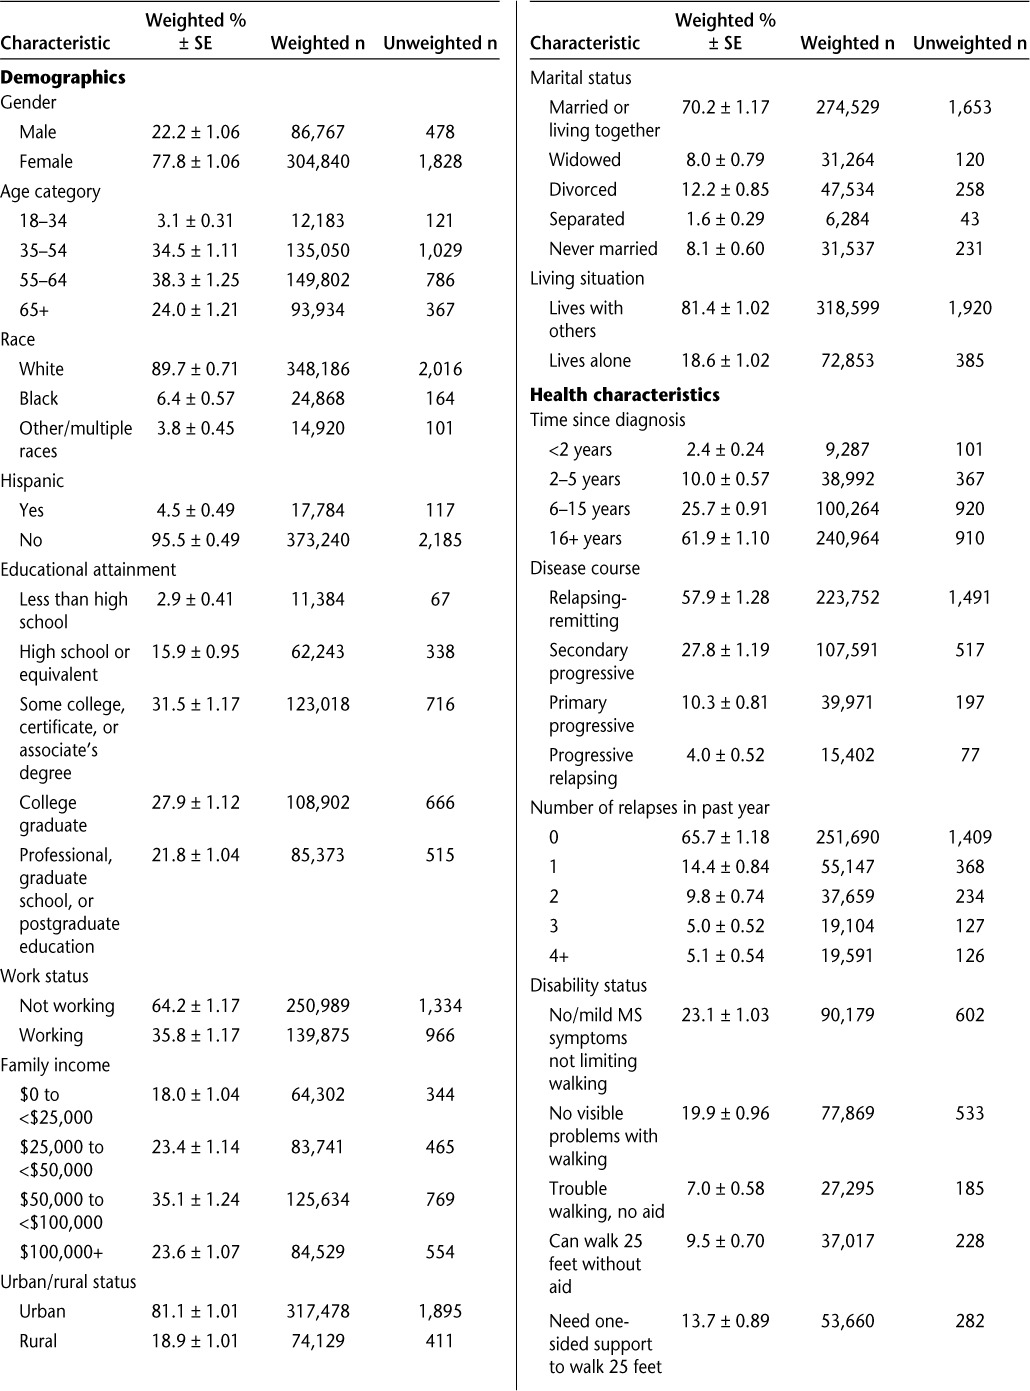
The bottom portion of Table 1 presents descriptive information on insurance characteristics. For their main plans, over half (58.6%) of the insured participants had private health insurance, one-third (33.9%) had Medicare, 2.5% had Medicaid, and 5.0% reported other types of public insurance. Just under half (44.9%) of those with Medicare are aged 65 years or older, meaning that over half of those with Medicare qualified owing to their disability (results not shown). Over half (55.8%) of the insured sample had only one plan, 40.1% had two plans, and 4.1% had three or more.
Perceived Change in Health Insurance Coverage
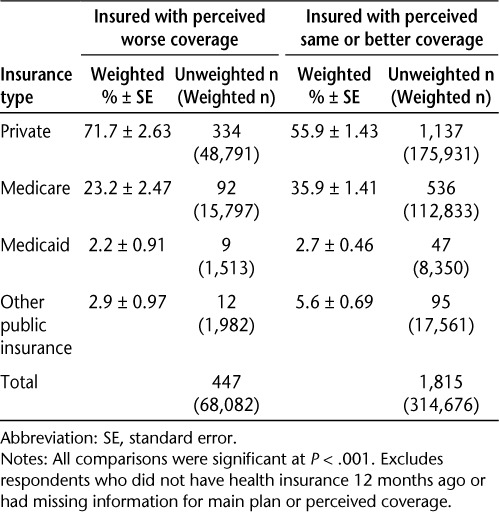
Nearly three-quarters of insured participants reported no change in coverage over the previous year (74.1%). Eight percent reported that coverage through their main plan was somewhat or much better, and 17.8% reported that it was somewhat or much worse. There were significant differences in change in perceived coverage by main insurance type (Table 2). A much higher percentage of people with private insurance perceived their coverage to be worse compared with people with nonprivate insurance (71.7% vs. 2.2–23.2%).
Table 2.
Perceived change in health insurance coverage over 12 months, by type of insurance
The results from the multivariate logistic regression are shown in Table 3. Participants with Medicare were significantly less likely to perceive worse coverage compared with those with private health insurance (odds ratio [OR] = 0.525; P < .01), holding other covariates constant. There were no significant differences in perceived insurance coverage between Medicaid beneficiaries and those privately insured; note also that the number of Medicaid beneficiaries in our sample is quite small (unweighted = 56; weighted = 9863). Similarly, there was no significant difference between those with “other” public insurance versus privately insured. There is no difference in perceived coverage between the three nonprivately insured groups; that is, those with Medicare do not differ significantly in their perception of coverage compared with those with Medicaid or other nonprivate insurance. The overall effect of insurance type is significant (P = .0117; results not shown).
Table 3.
Factors related to perceived worse health insurance coverage compared with previous year
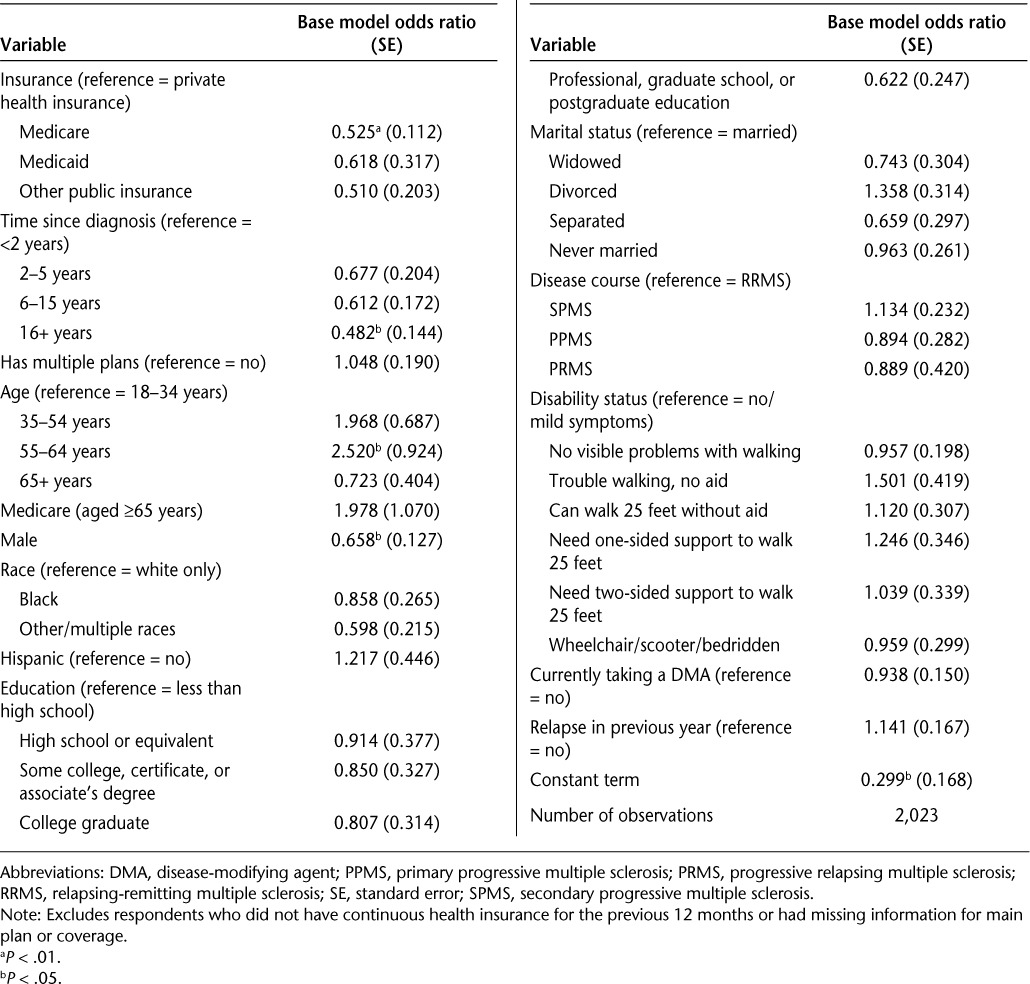
Older participants who were eligible for Medicare (ie, aged 65 or older) were not significantly different from participants 18 to 34 years old with regard to perceiving worse coverage. However, individuals aged 55 to 64 were two and a half times as likely to perceive worse coverage compared with participants 18 to 34 years old (P < .05). As time since diagnosis increases, the odds of perceiving worse coverage decline, significantly so for those diagnosed 16 years or more previously. For example, the odds of perceiving worse coverage are 0.482 for individuals who have been diagnosed more than 15 years previously relative to an individual diagnosed in the past 2 years. The overall effects of duration and age were each also significant (not shown).
The other hypothesized confounder—number of health plans—was not significantly related to perceiving worse coverage. The only other significant predictor was gender: males were significantly less likely to perceive worse coverage compared with females (OR = 0.658; P < .05).
As discussed above, we used time since diagnosis as a proxy for general health status. When we restricted the analysis to just Cohort 2 (which has current health status in 2009) and replaced health status with time since diagnosis, the results were largely the same (results not shown). This suggests that time since diagnosis is a reasonable proxy for general health status.
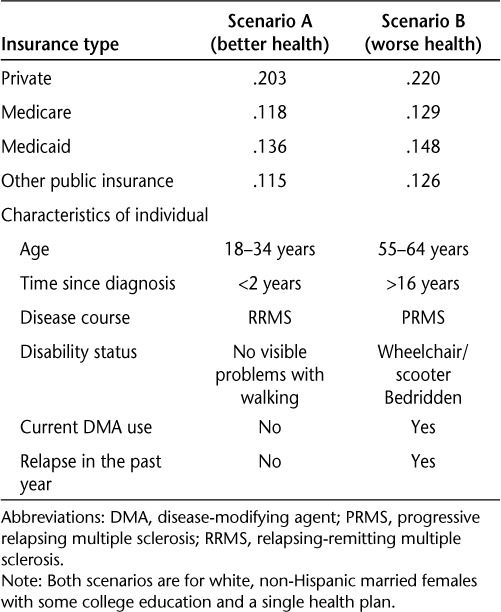
We also calculated the predicted probability of reporting perceived worse health coverage across the four types of insurance for two hypothetical scenarios (Table 4). Broadly, scenario A has better health characteristics (eg, more recent diagnosis, younger, no or only mild symptoms, RRMS, not on a DMA, and no recent relapse) than scenario B. The other covariates were set at the most common value for both scenarios: white, non-Hispanic married female with some college education and a single health plan. Looking at the scenario associated with better health (scenario A), the predicted probability of reporting perceived worse health coverage was considerably higher for privately insured individuals (20.3%) compared with those with public insurance (11.5–13.6%). This relationship held for the worse health scenario, too, although the values were smaller. Under scenario B, individuals with private insurance had a 22.0% chance of reporting perceived worse health coverage, compared with less than 15% among those with public insurance.
Table 4.
Predicted probability of perceiving worse coverage across four types of insurance under two scenarios
Discussion
Our study confirmed earlier work showing that most people with MS have health insurance.12,13 We also found private insurance to be a significant predictor of perceived worse health insurance coverage, whereas public insurance was not. This was not unexpected, given the changes in premiums and coverage in the private insurance market that are largely absent in public insurance programs. For example, the Survey of Employer Health Benefits found a 5% increase in premiums for family coverage between 2008 and 2009.16 Although a relatively moderate increase compared with the double-digit increases that were commonplace 10 years ago, this is still substantially higher than the usual premium increases among public insurance. Furthermore, the Centers for Medicare and Medicaid Services (CMS) did not increase the standard monthly premium ($96.40) or deductible amount ($135) for Medicare Part B in 2009, the first year since 2000 in which there was not an annual increase. This difference in premium increases may partly explain some of our findings.
Unlike public insurance, there is considerable variation in benefit design within the private health insurance market. For example, a private health insurer can impose different copayments based on provider type or drug class, or offer a high-deductible, low-monthly-premium plan. Furthermore, benefit design and associated costs also vary considerably depending on the “source” of the private health plan (ie, employer-sponsored vs. individual market). Ideally, we would know the benefit design of participants with private insurance, including variations in copayments across services and drugs, deductibles, and monthly premiums. These data are unavailable, but it is plausible that the nuances and complexities in private insurance benefit design may not be well understood by participants—especially those whose MS symptoms include cognitive difficulties—which could also contribute to perceived worse coverage. That is, coverage may not in fact change, but a worsening of health status causes the enrollee to realize that her coverage does not cover the new health needs. Recent findings using the Medical Expenditure Panel Survey suggest that benefit design rather than the plan itself was a major driver of differences in insurance generosity between households with and without a chronic illness,17 further highlighting the importance of enrollees' understanding the nuances of their private health plan.
Many individuals do not have a choice between public or private insurance: they are eligible for public insurance owing to age or disability (Medicare) or income (Medicaid) but do not have access to private insurance; or they are ineligible for public insurance. However, some individuals with MS and other chronic illnesses can choose between public and private insurance (eg, individuals who are eligible for Medicare but have the option of retaining their own [or their spouse's] employer-sponsored plan), and our research suggests that Medicare participants with MS are significantly less likely to perceive worse coverage. Similarly, Medicare beneficiaries are able to choose between traditional fee-for-service (Parts A and B [FFS]) and managed care (Medicare Advantage [MA]) insurance options. To the extent that MA's benefit design is similar to that of most private insurance plans, our findings on perceived worse coverage among privately insured may also be applicable to individuals with MA. Our data do not allow us to distinguish the respondent's specific Medicare plan, but research suggests that MA enrollees are disproportionately less costly compared with the overall Medicare populations, and those who disenroll from MA to FFS are disproportionately higher-cost beneficiaries.18–20
Limitations
Arguably the largest limitation of this study is that we are unable to adjust for selection bias—that is, where respondents differ from nonrespondents in ways that we cannot observe. We have attempted to minimize this by including characteristics that may explain some of the variance in perceived coverage. However, as with all nonrandomized studies, omitted variable bias may still exist.
We do not know if our sample is representative of the MS population in the United States. Because we lacked a probability-based sample, we used post-stratification to approximate selection probabilities. Although it is imperfect (eg, age and time since diagnosis are not perfectly correlated), we believe it is a reasonable approach to account for the known oversampling design and an improvement over not including weights. Also, our weighted and unweighted regression results lead to similar inferences (not shown).
The Slifka Study data are self-reported, and therefore vulnerable to misunderstanding on the part of both the subject and the interviewer. Additionally, we asked about perceived change in health insurance coverage, not actual change. Because we focused on participants' main health insurance plan instead of all their health insurance plans, we do not have a full picture of their health insurance coverage and costs. Nor do we have detailed information on the private health insurance plan (eg, employer-sponsored vs. purchased through the individual market).
Despite these caveats, our research suggests some important policy implications. Participants with private insurance should fully understand their plan's benefit design, especially for relevant care that they anticipate eventually needing. This will be especially salient to individuals with a progressive form of MS.
PracticePoints.
Most people with MS have health insurance, but their perception of their insurance coverage is affected by their insurance type.
Individuals with private health insurance perceive worse coverage than those with Medicare.
For individuals with MS who can choose between public and private insurance, variability in premiums and coverage in the private insurance market, which are largely absent in public insurance programs, should be considered.
Acknowledgments
We thank Nicholas G. LaRocca, PhD, Project Officer at the National Multiple Sclerosis Society, for his contributions throughout the project.
Footnotes
Note: Supplementary material for this article (a supplementary table) is available on IJMSC Online at ijmsc.org.
Financial Disclosures: The authors have no conflicts of interest to disclose.
Funding/Support: This study was supported by the National Multiple Sclerosis Society (NMSS) research contract No. HC 0090. One of the coauthors (SM) was paid by Abt Associates as a subcontractor for this project. The Slifka Study, from which these data were drawn, was also funded by the NMSS. Abt Associates, a for-profit organization, was contracted and paid by the NMSS for work on the Slifka Study. Two coauthors (LH and AP) received salary for previous work on the Slifka Study. One coauthor (SM) was paid by Abt Associates as a subcontractor for work on the Slifka Study and is currently paid salary by Brigham and Women's Hospital through its contract with the NMSS for work on the Slifka Study.
References
- 1.Asche CV, Singer ME, Jhaveri M, Chung H, Miller A. All-cause health care utilization and costs associated with newly diagnosed multiple sclerosis in the United States. J Manag Care Pharm. 2010;16:703–712. doi: 10.18553/jmcp.2010.16.9.703. [DOI] [PMC free article] [PubMed] [Google Scholar]
- 2.Whetten-Goldstein K, Sloan FA, Goldstein LB, Kulas ED. A comprehensive assessment of the cost of multiple sclerosis in the United States. Mult Scler. 1998;4:419–425. doi: 10.1177/135245859800400504. [DOI] [PubMed] [Google Scholar]
- 3.Grudzinski AN, Hakim Z, Cox ER, Bootman JL. The economics of multiple sclerosis: distribution of costs and relationship to disease severity. Pharmacoeconomics. 1999;15:229–240. doi: 10.2165/00019053-199915030-00003. [DOI] [PubMed] [Google Scholar]
- 4.Patwardhan MB, Matchar DB, Samsa GP, McCrory DC, Williams RG, Li TT. Cost of multiple sclerosis by level of disability: a review of literature. Mult Scler. 2005;11:232–239. doi: 10.1191/1352458505ms1137oa. [DOI] [PubMed] [Google Scholar]
- 5.Kobelt G. Economic evidence in multiple sclerosis: a review. Eur J Health Econ. 2004;5:54–62. doi: 10.1007/s10198-005-0289-y. [DOI] [PubMed] [Google Scholar]
- 6.Stanton MW. Employer-sponsored health insurance: trends in cost and access. Research in Action Issue 17. AHRQ Pub. No. 04-0085. Agency for Healthcare Research and Quality. http://www.ahrq.gov/research/findings/factsheets/costs/empspria/index.html. Published 2004. Accessed June 7, 2013.
- 7.Machlin SR, Nixon AJ, Sommers JP. Health care expenditures and percentage uninsured in 10 large metropolitan areas. Statistical Brief #38. Agency for Healthcare Research and Quality. http://meps.ahrq.gov/data_files/publications/st38/stat38.shtml. Published 2000. Accessed June 7, 2013.
- 8.Branscome JM, Crimmel BL. Changes in job-related health insurance, 1996–99. MEPS Chartbook No. 10. AHRQ Pub. No. 02-0030. Agency for Healthcare Research and Quality. http://meps.ahrq.gov/data_files/publications/cb10/cb10.pdf. Published 2002. Accessed June 7, 2013.
- 9.Minden SL, Frankel D, Hadden L, Hoaglin DC. Access to health care for people with multiple sclerosis. Mult Scler. 2007;13:547–558. doi: 10.1177/1352458506071306. [DOI] [PubMed] [Google Scholar]
- 10.Iezzoni LI, Ngo L. Health, disability, and life insurance experiences of working-age persons with multiple sclerosis. Mult Scler. 2007;13:534–546. doi: 10.1177/1352458506071356. [DOI] [PubMed] [Google Scholar]
- 11.Minden SL, Frankel D, Hadden L, Perloffp J, Srinath KP, Hoaglin DC. The Sonya Slifka Longitudinal Multiple Sclerosis Study: methods and sample characteristics. Mult Scler. 2006;12:24–38. doi: 10.1191/135248506ms1262oa. [DOI] [PubMed] [Google Scholar]
- 12.Little RJ. Post-stratification: a modeler's perspective. J Amer Stat Assoc. 1993;88:1001–1012. [Google Scholar]
- 13.National Multiple Sclerosis Society. Who gets MS? http://www.nationalmssociety.org/about-multiple-sclerosis/what-we-know-about-ms/who-gets-ms/index.aspx. Published 2012. Accessed November 14, 2012.
- 14.Kochanek KD, Xu J, Murphy SL, Minino AM, Kung HC. Deaths: Final Data for 2009. National vital statistics reports; vol. 60, no. 3. National Center for Health Statistics. http://www.cdc.gov/nchs/data/nvsr/nvsr60/nvsr60_03.pdf. Published 2012. Accessed May 1, 2013. [PubMed]
- 15.National Multiple Sclerosis Society. Fact Sheet: Multiple Sclerosis. http://www.nationalmssociety.org/chapters/mnm/mediacenter/factsheetmultiplesclerosis/index.aspx. Published 2013. Accessed May 10, 2013.
- 16.Claxton G, DiJulio B, Finder B Employer Health Benefits 2009 Annual Survey. Kaiser Family Foundation and HRET. http://kaiserfamilyfoundation.files.wordpress.com/2013/04/7936.pdf. Published 2009. Accessed June 6, 2013.
- 17.Abraham JM, Royalty AB, DeLeire T. Gauging the Generosity of Employer-Sponsored Insurance: Differences Between Households With and Without a Chronic Condition. National Bureau of Economic Research (NBER) Working Paper No. 17232, 2011. http://www.nber.org/papers/w17232.pdf. Published 2011. Accessed June 6, 2013.
- 18.Morrisey MA, Kilgore ML, Becker DJ, Smith W, Delzell E. Favorable selection, risk adjustment, and the Medicare Advantage program. Health Serv Res. 2013;48:1039–1056. doi: 10.1111/1475-6773.12006. [DOI] [PMC free article] [PubMed] [Google Scholar]
- 19.Riley GF. Impact of continued biased disenrollment from the Medicare Advantage program to fee-for-service. Medicare & Medicaid Res Rev. 2012;2:E1–E16. doi: 10.5600/mmrr.002.04.a08. [DOI] [PMC free article] [PubMed] [Google Scholar]
- 20.Newhouse JP, Price M, Huang J, McWilliams JM, Hsu J. Steps to reduce favorable risk selection in Medicare Advantage largely succeeded, boding well for health insurance exchanges. Health Affairs. 2012;31:2618–2628. doi: 10.1377/hlthaff.2012.0345. [DOI] [PMC free article] [PubMed] [Google Scholar]


