

Abstract
Objective
To assess the diagnostic performance of the PTSD Checklist (PCL) for three age groups (<50, 50–64, and ≥65 years).
Methods
The PCL was compared with the Clinician Administered PTSD Scale, a gold standard for the diagnosis of post-traumatic stress disorder. Receiver operating characteristic curves and the corresponding area under the receiver operating characteristic curve (AUC) and measures of sensitivity and specificity were used to assess the performance of and to determine optimal cutscores for the PCL across the three groups. Analyses were based on 858 randomly selected primary care patients who participated in a study conducted at four Veterans Administration medical centers.
Results
AUCs were high for all three age groups (87.55%–88.26%), and there were no significant differences in AUCs across age groups χ2. Optimal cutscores, however, varied considerably: 24 for the oldest group, 34 for the middle group, and 43 for the youngest group.
Conclusion
Recommend use of lower PCL cutscore for older Veterans Administration primary care patients.
Introduction
Post-traumatic stress disorder (PTSD) is not typically considered to be a disorder of the elderly, yet more attention should be given to this disorder in aging people and to question whether screening instruments would perform the same in this age group, for a number of reasons. Studies among Veterans Affairs (VA) patients suggest that a considerable number of combat veterans still have symptoms resulting from military service in Vietnam and World War II,1 thus exemplifying the chronicity of this disorder, even into older age. Also, it is not uncommon for PTSD symptoms to emerge, or reemerge, years or even decades after exposure to a traumatic event.2,3 A survey of over 800 primary care patients drawn from four VA hospitals found that the prevalence of PTSD (as assessed by the Clinician Administered PTSD Scale [CAPS]) among those aged 65–74 years was 3.3% and for those aged 75–79 years, 10.1%.4
Although older adults may experience new symptoms of PTSD resulting from recent traumas, new-onset PTSD occurs less frequently in older adults.5 Even so, trauma types are different for older age groups versus younger. For example, traumas such as sexual abuse and combat are more likely to occur at younger ages, whereas abuse and neglect occur more commonly in older ages. To complicate matters, it is also common for memories of previously experienced traumas to resurface, causing remitted symptoms to re-emerge or generating new symptoms to develop latently.3 Additionally, older patients are vulnerable to circumstances such as retirement, loss, isolation, changes in social or financial support, and medical or psychiatric conditions that can lead to a relapse of PTSD or interfere with the ability to cope with new stressful situations.3,6
To further complicate matters, a comprehensive review by Averill and Beck 6 provides evidence that older adults typically report a different constellation of symptoms than younger adults and may present with symptoms that are less obvious or less specific to PTSD. This has direct implications for screening, particularly given that older patients tend to report symptoms that are easily confused with depression.
A number of screening instruments have been developed and validated along with data recommending cutoff scores for PTSD “caseness.” One of the most popular PTSD screeners, the PTSD Checklist (PCL), originally published a recommended cutscore of 50. 7 Reports have recommended the use of lower cutscores as well as setting- and gender-specific cutscores, 8 but the subject of age-specific cutscores has yet to be thoroughly explored. Thus, along with increased provider vigilance, including screening, in aging populations, it is important that we understand how screening instruments perform across the age span.
Methods
The current analysis is based on data gathered from patients at four VA Medical Centers in the southeast region of the United States; also, female veterans were oversampled.4 Eligible patients were randomly selected from a roster of 229,780 veterans who had made a healthcare visit during fiscal year 1999. Patients with known dementia, octogenarians (during fiscal year 1999), and nonagenarians were excluded because of concern over ability to recall information critical to the study. Patients were randomly selected from those who had an outpatient visit in fiscal year 1999 at one of the four hospitals. Additionally, female patients were over-sampled from the same primary care clinics. Study procedures were otherwise identical for the two groups of patients. (See Magruder et al. 4 for a more detailed explanation of the sampling strategy).
At the time of the clinic visit, we provided further explanation of the study, including that this was a study of stress-related disorders in primary care, and written informed consent was obtained before study participation. At the clinic visit, sociodemographic information was collected and the PCL was administered. Patients were informed that they would be contacted by telephone for a follow-up interview.
The telephone interview was conducted within 2 months of the clinic interviews. Clinicians trained at the master's level and above administered the Trauma Assessment for Adults (to assess for PTSD criterion A) and the CAPS. CAPS interviewers were blind to PCL screening results. Telephone interviewers were the same for patients in the random sample and the over-sample, and interviewers were not informed as to which subjects had been identified by the over-sampling procedure. Analyses were based on patients with complete CAPS and PCL data (N = 858).
Measures
Gold standard
The CAPS was developed at the National Center for PTSD in 1990 to serve as a structured clinical interview to assess adults for the 17 symptoms of PTSD outlined in Diagnostic and Statistical Manual of Mental Disorders, Fourth Edition (DSM-IV) along with five associated features (guilt, dissociation, derealization, depersonalization, and reduction in awareness of surroundings). 9 The current version of the CAPS provides a means to evaluate current and/or lifetime DSM-IV diagnosis of PTSD, frequency and intensity of symptoms, impact of the 17 PTSD symptoms on social and occupational functioning, and overall severity of PTSD. Inter-rater reliability was assessed by speaker phone in a random sample of interviews (8%). Results showed that raters were 100% concordant for PTSD diagnosis on the CAPS. 4
Screening assessment
The PCL is a brief self-report inventory that assesses the 17 symptoms of PTSD. This screening instrument was developed in 1993 by a research team from the National Center for PTSD. 7 The PCL includes a series of questions about symptoms or signs of PTSD resulting from experiences taking place within the past month. Patients are asked to rate how bothersome symptoms have been in the last month on a 1 (“not at all”) to 5 (“extremely”) Likert scale. Total scores can range from 17 to 85. A score of 50, the current recommended cutscore, does not confirm a positive diagnosis but rather indicates the present symptoms are suggestive of PTSD. 7
Statistical Analyses
Three age strata were defined: ages 21–49 (N = 204), 50–64 (N = 319), and 65 and older (N = 332). For these three strata, sensitivity, specificity, predictive values, and likelihood ratios were derived for all PCL cutscores using STATA statistical software's roctab command (STATA Corp., College Station, TX), which performs nonparametric receiver operating characteristic analysis. Receiver operator characteristic curves were constructed to determine an optimal cutscore for the PCL relative to CAPS status using STATA statistical software's rocplot command (STATA Corp.). Finally, corresponding nonparametric estimates of areas under the curve (AUC) were derived to compare the overall performance of the PCL by age group using STATA statistical software's roccomp commands (STATA Corp.). Age group–specific cutscores were obtained by optimizing specificity while getting as close to 80% sensitivity as possible. Additionally, for each of the selected cutscores, we calculated the Mantel-Haenszel χ2 for trend across age groups for both sensitivity and specificity. In doing so, we were able to determine for a given cutscore whether the sensitivity and specificity measures varied significantly across age groups.
Results
The analytic sample was 79.1% men and 61.7% white, and the average age was 59.6 years; 43% reported having served in a war zone. AUCs were high for all three age groups (87.55%–88.26%), and there were no significant differences in AUCs across age groups χ 2 (p >0.986; Fig. 1). Optimal cutscores, however, varied considerably, ranging from 24 to 43. The optimal PCL cutscore for group 1 (ages 21–49) was 43, for group 2 (ages 50–64) 34, and for group 3 (ages ≥ 65) 24 (see Table 1 for detailed results). In our sample, using a cutscore of 24 yielded sensitivity values of 96%, 89%, and 76% (M-H χ (1df) 2 = 3.47; p = 0.06) and specificity values of 51%, 62%, and 80% (M-H χ (1df) 2 = 23.96; p <0.0001) across the youngest, middle, and oldest age groups, respectively. Using a cutscore of 34 yielded sensitivity values of 92%, 81%, and 53% (M-H χ (1df) 2 = 8.21; p = 0.004) and specificity values of 68%, 82%, and 95% (M-H χ (1df) 2 = 23.31; p <0.0001) across the youngest, middle, and oldest age groups, respectively. Finally, using a cutscore of 43 yielded sensitivity values of 88%, 69%, and 35% (M-H χ (1df) 2 = 11.76; p <0.001) and specificity values of 78%, 90%, and 98% (M-H χ (1df) 2 = 22.48; p <0.0001) across the youngest, middle, and oldest age groups, respectively. These analyses indicate that when a single cutscore is selected for all age groups, both sensitivity and specificity varied in a trend fashion across these groups.
Figure 1.
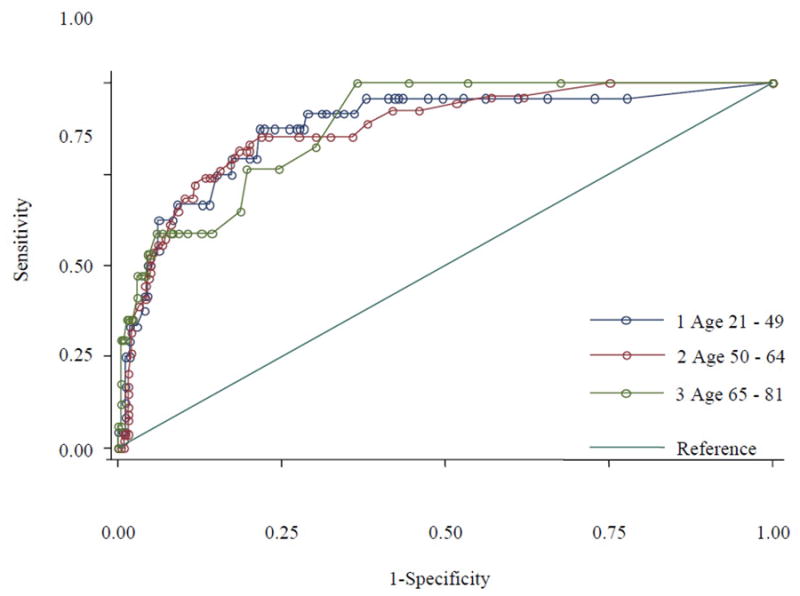
Receiver operating characteristic curves for the PCL by age (based on Magruder et al. data).
Table 1. Diagnostic Characteristics of the PCL by Cutscore for Three Age Groups.
| Cut Score | Ages 21–49 | Ages 50–64 | Ages 65–81 | ||||||
|---|---|---|---|---|---|---|---|---|---|
| Sensitivity | Specificity | Correctly Classified | Sensitivity | Specificity | Correctly Classified | Sensitivity | Specificity | Correctly Classified | |
| 17 | 100.00% | 0.00% | 11.76% | 100.00% | 0.00% | 16.93% | 100.00% | 0.00% | 5.12% |
| 18 | 95.83% | 22.22% | 30.88% | 100.00% | 24.91% | 37.62% | 100.00% | 32.38% | 35.84% |
| 19 | 95.83% | 27.22% | 35.29% | 96.30% | 38.11% | 47.96% | 100.00% | 46.67% | 49.40% |
| 20 | 95.83% | 34.44% | 41.67% | 96.30% | 43.02% | 52.04% | 100.00% | 55.56% | 57.83% |
| 21 | 95.83% | 38.89% | 45.59% | 94.44% | 48.30% | 56.11% | 100.00% | 63.49% | 65.36% |
| 22 | 95.83% | 43.89% | 50.00% | 92.59% | 53.96% | 60.50% | 82.35% | 69.84% | 70.48% |
| 23 | 95.83% | 47.22% | 52.94% | 92.59% | 58.11% | 63.95% | 76.47% | 75.56% | 75.60% |
| 24 | 95.83% | 50.56% | 55.88% | 88.89% | 61.89% | 66.46% | 76.47% | 80.32% | 80.12% |
| 25 | 95.83% | 52.78% | 57.84% | 85.19% | 64.15% | 67.71% | 64.71% | 81.27% | 80.42% |
| 26 | 95.83% | 56.67% | 61.27% | 85.19% | 67.55% | 70.53% | 58.82% | 85.71% | 84.34% |
| 27 | 95.83% | 57.22% | 61.76% | 85.19% | 69.81% | 72.41% | 58.82% | 87.30% | 85.84% |
| 28 | 95.83% | 57.78% | 62.25% | 85.19% | 72.45% | 74.61% | 58.82% | 89.52% | 87.95% |
| 29 | 95.83% | 58.89% | 63.24% | 85.19% | 76.98% | 78.37% | 58.82% | 90.79% | 89.16% |
| 30 | 95.83% | 62.22% | 66.18% | 85.19% | 78.11% | 79.31% | 58.82% | 91.75% | 90.06% |
| 31 | 91.67% | 63.89% | 67.16% | 83.33% | 80.00% | 80.56% | 58.82% | 92.06% | 90.36% |
| 32 | 91.67% | 65.56% | 68.63% | 81.48% | 80.00% | 80.25% | 58.82% | 93.33% | 91.57% |
| 33 | 91.67% | 66.67% | 69.61% | 81.48% | 80.38% | 80.56% | 58.82% | 94.29% | 92.47% |
| 34 | 91.67% | 68.33% | 71.08% | 81.48% | 81.51% | 81.50% | 52.94% | 95.24% | 93.07% |
| 35 | 91.67% | 68.89% | 71.57% | 79.63% | 82.26% | 81.82% | 52.94% | 95.56% | 93.37% |
| 36 | 91.67% | 71.11% | 73.53% | 77.78% | 83.02% | 82.13% | 47.06% | 95.87% | 93.37% |
| 37 | 87.50% | 71.67% | 73.53% | 75.93% | 84.53% | 83.07% | 47.06% | 96.51% | 93.98% |
| 38 | 87.50% | 72.22% | 74.02% | 74.07% | 85.28% | 83.39% | — | — | — |
| 39 | 87.50% | 72.78% | 74.51% | 74.07% | 86.04% | 84.01% | 47.06% | 97.14% | 94.58% |
| 40 | 87.50% | 73.89% | 75.49% | 74.07% | 86.79% | 84.64% | — | — | — |
| 41 | 87.50% | 76.11% | 77.45% | 72.22% | 88.30% | 85.58% | 41.18% | 97.14% | 94.28% |
| 42 | 87.50% | 77.78% | 78.92% | 68.52% | 88.68% | 85.27% | — | — | — |
| 43 | 87.50% | 78.33% | 79.41% | 68.52% | 89.81% | 86.21% | 35.29% | 97.78% | 94.58% |
| 44 | 79.17% | 78.89% | 78.92% | 64.81% | 90.94% | 86.52% | 35.29% | 98.10% | 94.88% |
| 45 | 79.17% | 80.00% | 79.90% | 61.11% | 92.08% | 86.83% | 35.29% | 98.41% | 95.18% |
| 46 | 79.17% | 82.78% | 82.35% | 57.41% | 92.83% | 86.83% | 35.29% | 98.73% | 95.48% |
| 47 | 75.00% | 82.78% | 81.86% | 55.56% | 93.21% | 86.83% | 29.41% | 99.05% | 95.48% |
| 48 | 75.00% | 85.00% | 83.82% | 55.56% | 93.96% | 87.46% | — | — | — |
| 49 | 66.67% | 86.11% | 83.82% | — | — | — | — | — | — |
| 50 | 66.67% | 87.22% | 84.80% | 53.70% | 94.72% | 87.77% | — | — | — |
| 51 | 66.67% | 91.11% | 88.24% | 51.85% | 95.09% | 87.77% | — | — | — |
| 52 | 62.50% | 91.67% | 88.24% | 50.00% | 95.09% | 87.46% | 29.41% | 99.37% | 95.78% |
| 53 | 62.50% | 93.89% | 90.20% | — | — | — | — | — | — |
| 54 | 54.17% | 93.89% | 89.22% | 48.15% | 95.09% | 87.15% | — | — | — |
| 55 | 50.00% | 95.00% | 89.71% | — | — | — | — | — | — |
| 56 | 50.00% | 95.56% | 90.20% | 46.30% | 95.47% | 87.15% | 29.41% | 99.68% | 96.08% |
| 57 | 41.67% | 95.56% | 89.22% | 44.44% | 95.85% | 87.15% | — | — | — |
| 58 | 41.67% | 96.11% | 89.71% | 40.74% | 95.85% | 86.52% | — | — | — |
| 59 | 37.50% | 96.11% | 89.22% | 38.89% | 96.98% | 87.15% | 17.65% | 99.68% | 95.48% |
| 62 | — | — | — | — | — | — | 11.76% | 99.68% | 95.18% |
| 63 | 33.33% | 97.22% | 89.71% | 35.19% | 97.74% | 87.15% | — | — | — |
| 64 | 33.33% | 98.33% | 90.69% | — | — | — | — | — | — |
| 65 | 29.17% | 98.33% | 90.20% | — | — | — | 5.88% | 99.68% | 94.88% |
| 66 | 25.00% | 98.33% | 89.71% | 31.48% | 98.11% | 86.83% | — | — | — |
| 67 | 25.00% | 98.89% | 90.20% | — | — | — | — | — | — |
| 68 | — | — | — | 25.93% | 98.11% | 85.89% | — | — | — |
| 69 | — | — | — | 20.37% | 98.49% | 85.27% | — | — | — |
| 70 | 16.67% | 98.89% | 89.22% | 16.67% | 98.49% | 84.64% | — | — | — |
| 72 | 12.50% | 98.89% | 88.73% | 14.81% | 98.49% | 84.33% | 5.88% | 100.00% | 95.18% |
| 73 | 8.33% | 98.89% | 88.24% | 11.11% | 98.49% | 83.70% | 0.00% | 100.00% | 94.88% |
| 74 | 4.17% | 98.89% | 87.75% | 9.26% | 98.49% | 83.39% | 0.00% | 100.00% | 94.88% |
| 76 | — | — | — | 7.41% | 98.49% | 83.07% | 0.00% | 100.00% | 94.88% |
| 77 | — | — | — | 3.70% | 98.49% | 82.45% | 0.00% | 100.00% | 94.88% |
| 78 | 4.17% | 99.44% | 88.24% | 3.70% | 98.87% | 82.76% | 0.00% | 100.00% | 94.88% |
| 79 | — | — | — | 3.70% | 99.25% | 83.07% | 0.00% | 100.00% | 94.88% |
| 81 | 4.17% | 100.00% | 88.73% | 1.85% | 99.25% | 82.76% | 0.00% | 100.00% | 94.88% |
| 83 | 0.00% | 100.00% | 88.24% | 0.00% | 99.25% | 82.45% | 0.00% | 100.00% | 94.88% |
| 85 | 0.00% | 100.00% | 88.24% | 0.00% | 99.62% | 82.76% | 0.00% | 100.00% | 94.88% |
| >85 | 0.00% | 100.00% | 88.24% | 0.00% | 100.00% | 83.07% | 0.00% | 100.00% | 94.88% |
Discussion
Previous analyses with this dataset found that the optimal cutscore (without regard for age) for the PCL in VA primary care settings is 31 (sensitivity: 81.25%; specificity: 81.23%) and that, based on AUC, the PCL performed consistently across race and gender groups. 10 Also using AUC, the present analyses found that the overall performance of the PCL does not vary by age but demonstrates very good to excellent discriminative power across all age groups. 11,12 In contrast, however, the optimal cutscores for the PCL (based on a balance of sensitivity and specificity) varied greatly. Nevertheless, the cutscore of 24 for the oldest group is extremely low and, perhaps in other samples, may lead to a high false-positive rate, especially in the absence of a verified trauma.
The reason for these cutscore differences is less clear. Selective survival may be one possibility, because PTSD is a mortality risk, and older surviving patients may display different symptomatology that is influenced by comorbid medical problems. 13 It is possible that reporting styles in older patients may be different, which could potentially cause the self-reported PCL symptoms to be minimized, whereas the clinical skills of the CAPS assessors may have mitigated this effect in the CAPS. It may also be that the PCL response format (five-point Likert-type scale) was confusing for older veterans. Finally, older patients may be more likely to provide socially desirable responses, as suggested by the reduced symptom severity we observed across all PCL items for the oldest CAPS-positive group compared with the younger groups.
Although we excluded those with known dementia, it is possible that in our older age group, mild cognitive impairment may have impacted all self-reported measures, including the PCL. Faced with mild cognitive impairment, older patients may simply not understand the questions fully or may even be more susceptible to priming effects (the PCL was administered first).
The results of this analysis were based on a VA-only sample and may not be generalizable to other non-VA populations. Also, patient age was capped at 79 years, potentially limiting applicability to older populations. It should be noted too that the PCL is currently based on DSM-IV criteria, which will be updated in the DSM-V. Although only minor changes to the diagnostic criteria of PTSD are expected, this could potentially impact the performance of PTSD screening tools, such as the PCL relative to the new criteria.
Several strengths should also be noted. First, a large sample size was used with nearly equal group sizes by age. Second, 332 patients (39% of the analytic sample) were in the age group 65 year and older. Finally, patients were recruited in a regional sample from four different hospitals in the southeastern United States.
In summary, although no significant difference in overall diagnostic capacity was revealed through the AUC comparison, the wide range and trend nature of the sensitivity and specificity for the optimal cutscores by age group should not be ignored, suggesting a lower threshold as age increases. Further research in this area should emphasize not only the accuracy of cutscores but also the reasons for age-related differences; this could lead to more accurate PTSD screening for all ages.
References
- 1.Gold PB, Engdahl BE, Eberly RE, et al. Trauma exposure, resilience, social support, and PTSD construct validity among former prisoners of war. Soc Psychiatry Psychiatr Epidemiol. 2000;35:36–42. doi: 10.1007/s001270050006. [DOI] [PubMed] [Google Scholar]
- 2.Andrews B, Brewin CR, Philpott R, et al. Delayed-onset posttraumatic stress disorder: a systematic review of the evidence. Am J Psychiatry. 2007;164:1319–1326. doi: 10.1176/appi.ajp.2007.06091491. [DOI] [PubMed] [Google Scholar]
- 3.Weintraub D, Ruskin PE. Posttraumatic stress disorder in the elderly: a review. Harv Rev Psychiatry. 1999;7:144–152. [PubMed] [Google Scholar]
- 4.Magruder KM, Frueh BC, Knapp RG, et al. Prevalence of posttraumatic stress disorder in Veterans Affairs primary care clinics. Gen Hosp Psychiatry. 2005;27:169–179. doi: 10.1016/j.genhosppsych.2004.11.001. [DOI] [PubMed] [Google Scholar]
- 5.Kessler RC, Berglund P, Demler O, et al. Lifetime prevalence and age-of-onset distributions of DSM-IV disorders in the National Comorbidity Survey Replication. Arch Gen Psychiatry. 2005;62:593–602. doi: 10.1001/archpsyc.62.6.593. [DOI] [PubMed] [Google Scholar]
- 6.Averill PM, Beck JG. Posttraumatic stress disorder in older adults: a conceptual review. J Anxiety Dis. 2000;14:133–156. doi: 10.1016/s0887-6185(99)00045-6. [DOI] [PubMed] [Google Scholar]
- 7.Weathers FW, Litz BT, Herman JA, et al. The PTSD Checklist (PCL): reliability, validity and diagnostic utility. Paper presented at the 9th Annual Conference of the International Society of Traumatic Stress Studies; San Antonio, Texas. 1993. [Google Scholar]
- 8.McDonald SD, Calhoun PS. The diagnostic accuracy of the PTSD checklist: A critical review. Clinical Psychology Review. 2010;30:976–987. doi: 10.1016/j.cpr.2010.06.012. [DOI] [PubMed] [Google Scholar]
- 9.Blake DD, Weathers FW, Nagy LM, et al. A clinician rating scale for assessing current and lifetime PTSD: the CAPS-1. Behav Ther. 1990;18:187–188. [Google Scholar]
- 10.Yeager DE, Magruder KM, Knapp RG, et al. Performance characteristics of the posttraumatic stress disorder checklist and SPAN in Veterans Affairs primary care settings. Gen Hosp Psychiatry. 2007;29:294–301. doi: 10.1016/j.genhosppsych.2007.03.004. [DOI] [PubMed] [Google Scholar]
- 11.Hanley JA, McNeil BJ. The meaning and use of the area under a receiver operating characteristic (ROC) curve. Radiology. 1982;143:29–36. doi: 10.1148/radiology.143.1.7063747. [DOI] [PubMed] [Google Scholar]
- 12.DeLong ER, DeLong DM, Clarke-Pearson DL. Comparing the areas under two or more correlated receiver operating curves: a nonparametric approach. Biometrics. 1988;44:837–845. [PubMed] [Google Scholar]
- 13.Davidson JR, Stein DJ, Shalev AY, et al. Posttraumatic stress disorder: acquisition, recognition, course, and treatment. J Neuropsychiatry Clin Neurosci. 2004;16:135–147. doi: 10.1176/jnp.16.2.135. [DOI] [PubMed] [Google Scholar]