

Abstract
Caenorhabditis elegans is an attractive model system for determining the targets of neuroactive compounds. Genetic screens in C. elegans provide a relatively unbiased approach to the identification of genes that are essential for behavioral effects of drugs and neuroactive compounds such as alcohol. Much work in vertebrate systems has identified multiple potential targets of ethanol but which, if any, of those candidates are responsible for the behavioral effects of alcohol is uncertain. Here we provide detailed methodology for a genetic screen for mutants of C. elegans that are resistant to the depressive effects of ethanol on locomotion and for the subsequent behavioral analysis of those mutants. The methods we describe should also be applicable for use in screening for mutants that are resistant or hypersensitive to many neuroactive compounds and for identifying the molecular targets or biochemical pathways mediating drug responses.
Keywords: Alcohol, Behavior, Genetics, Invertebrate
Introduction
Alcohol abuse is a significant social and economic problem. Many proteins have been proposed to be targets of ethanol as a result of in vitro experiments although which of those proteins are responsible for the behavioral effects of alcohol is not clear. C. elegans is an attractive organism for identifying genes that mediate responses to neuroactive drugs. A wide variety of drugs has previously been found to mediate their behavioral effects through homologous target proteins in C. elegans and mammalian systems (1, 2). The neurotransmitter systems and signaling pathways that are known to be affected by ethanol in vitro are well represented in the C. elegans nervous system (3, 4). Mutants of C. elegans with widespread nervous system defects are often viable, which means that mutations in a large number of neuronal genes can be tested for altered behaviors in genetic screens.
Large-scale genetic screens for drug resistance in invertebrates have been useful for defining the direct targets of several drugs with behavioral effects. For example, mutations in the Rdl GABA receptor confer resistance to the paralytic insecticide dieldrin both in pest insects in the field and in Drosophila in the lab; this GABA receptor is the direct target of the drug (5). Similarly, direct screens for resistance to the paralytic nematocide ivermectin led to the identification of the ivermectin receptor, a glutamate-gated chloride channel (6). We reasoned that a similar direct search for central modulators of ethanol effects might be conducted.
In previous work we described a genetic screen for mutants with altered sensitivity to the effects of ethanol on locomotion (7). Ethanol causes a dose-dependent decrease in the rate of locomotion of C. elegans. The genetic screen yielded multiple mutations in the gene slo-1, which was previously shown to encode a calcium-dependent large-conductance potassium channel with close mammalian homologues (8). The SLO-1 protein is activated by ethanol in vivo (7), an effect that would inhibit neuronal activity. Therefore, a simple explanation for the ethanol resistance displayed by the slo-1 mutant animals is that the target of ethanol that mediates much of the effect of ethanol on locomotion is absent, therefore ethanol has minimal effect. Here, we provide additional experimental detail that describes the genetic screen and the quantitative behavioral characterization of the effects of ethanol on locomotion in wild-type and mutant animals to enable a broader application of this strategy to the identification of targets of other neuroactive compounds using C. elegans.
Materials and Methods
Screening for ethanol-resistant mutants
Two methods for screening for ethanol-resistant animals were used that relied on attractive signals that encourage the animals to move. The two methods were (1) a ring of bacteria (food) on NGM agar medium (9) (Fig. 1A) and (2) a point source of a chemical odorant (butanone) on chemotaxis medium (10) (Fig. 1B).
Fig. 1. Alternative strategies for screening for resistance to the depressive effects of ethanol on locomotion that use either (A) a food source or (B) an attractive odorant to encourage movement.
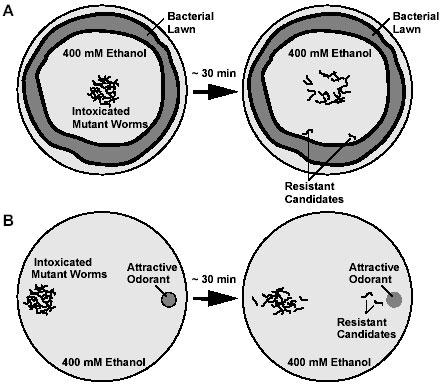
For the first method, 10 cm NGM agar test plates were poured 2-3 days before the assay and seeded with OP50 E. coli the day before the assay such that the bacteria grew in a ring around the periphery of the plate. The NGM plates were dried for 2 hours at 37°C on the day of the assay. For the second method, the chemotaxis media plates (10 cm) were poured the day before the assay and were dried for 1 hour at 37°C on the day of the assay. 100% ethanol at 4°C was pipetted on to the surface of the plates to achieve a concentration of 400 mM. The volume of ethanol that was added to the plates was determined by the volume of a test plate that had been poured at the same time and had undergone the same drying incubation. To determine the volume of the test plate, the agar was cut into pieces and transferred to a 15 ml tube where it was melted in a microwave oven to determine the volume. The plates were sealed with Parafilm and the ethanol was allowed to equilibrate in the media for 2 hours at room temperature. Immediately prior to the worms being placed on the chemotaxis media plates, a 1 μl drop of butanone (diluted 1 in 1000 in ethanol) was placed on one side of the plate.
Random mutagenesis of wild-type animals of the N2 strain was carried out according to Sulston and Hodgkin (9). L4 stage N2 animals were mutagenized by exposure to EMS (50 mM) for 4 hours. These animals were allowed to self-fertilize for two generations and young adult animals (n = 200-300) from the F2 progeny of the mutagenized P0 animals were washed from their plates with Assay buffer (10) to 1.5 ml tubes. The liquid in the tubes was replaced twice with Assay buffer to remove bacteria and was then replaced with 400 mM ethanol in Assay buffer. The worms were incubated at room temperature for 20 minutes prior to their transfer to the test plates. The worms were placed on the plates at defined positions, either in the center of the plate for the bacterial ring assay, or on the opposite side of the plate from the butanone spot for the attractive odorant assay. In both cases, the worms were allowed to move for approximately 30 minutes before animals that had reached the food or were closest to the odorant source were picked individually to new seeded plates and allowed to recover and reproduce. 20-30 of the progeny of these animals were then tested as young adults for their ethanol sensitivity to determine if the apparent ethanol resistance of the parent had bred true. The assay used to test for ethanol sensitivity of the progeny and subsequent generations is described in the next section. Briefly, candidate resistant worms are compared visually (video recording is not necessary) with the non-mutant parental strain by exposing those animals to ethanol on the same plates, using copper rings to corral the animals. Ethanol-resistant strains isolated from the screen were outcrossed 4-6 times with the N2 strain, selecting for ethanol resistance with each outcross.
Quantification of behavioral effects of ethanol
Petri plates (6 cm diameter) containing NGM agar were dried for 2 hours at 37°C before three or four copper rings (1.6 cm inner diameter; STK#35583, PlumbMaster, Concordville, PA) were melted into the surface of the agar. The rings serve as corrals for animals, allowing multiple strains to be examined under identical conditions. As described above, the volume of ethanol added to a plate to achieve a particular exogenous concentration (usually 400 mM) was determined by the volume of the agar in an identically-treated plate. Ethanol at 4°C was pipetted outside the copper rings, the plates were sealed with Parafilm and the ethanol was allowed to equilibrate in the agar for 2 hours at room temperature. Young adult animals were used for all locomotion assays. Before each assay, the animals were first transferred to plates without food for 30 minutes to acclimate the animals to an absence of food. Ten young-adult animals were then placed into each ring on the assay plate as quickly as possible, usually over a period of no more than 1-2 minutes and the zero time point was designated as the time when the last of the animals were placed on the plate. The behavior of the worms was recorded on a Leica MZ6 microscope at a magnification of 0.63x (the microscope was fitted with a 0.5x objective and a 0.5x C-mount), which allowed 3-4 of the copper rings to fit in the view frame. The images were recorded at a resolution of 624 x 480 pixels, which meant that the scale of the resulting image was 58.82 μm/pixel. For computer analyses, two-minute movies (1 frame/sec) were recorded from the 20-minute time point using the LEI-750 camera system (Leica Microsystems, Bannockburn, IL), a Snapper 24 frame-grabber card and Openlab software (Improvision, Lexington, MA) on an Apple Macintosh computer. An automation created within Openlab allowed for accurate control of the timing of the CCD camera. The movie generated within Openlab was saved in a Quicktime movie format, which is compatible with DIAS (Solltech, Inc., Oakdale, IA), the software used to track locomotion. DIAS recognizes and creates outlines of objects (worms) based on pixel intensity and can track the center of those objects from frame to frame; this enabled an average speed per worm to be calculated. The following parameters were used in the object recognition step (Auto Trace by Threshold). Threshold, 90-150; Minimum, 10 pixels; Maximum, 36 pixels; Dilate, Erode, Smooth Image, Smooth Outline, default). Animals with a path that could be traced for greater than 20 frames were included in an analysis (a collision with another animal or with the copper ring ends the path). Animals within separate copper rings were analyzed by DIAS independently by selecting specific regions to analyze. The average speed of animals from a particular strain was determined in the presence and absence of ethanol. The latter measurement allows a relative effect of ethanol to be determined (speed on ethanol/speed off ethanol x 100). This may be important if strains show significantly different untreated speeds, for instance if an animal is mildly uncoordinated it may be slower than N2, or there are certain mutants that can display faster speed than N2 such as animals carrying mutations in npr-1. A mean relative speed was calculated from at least three independent relative speed calculations. Statistical comparisons could then be done using two-tailed t-tests or ANOVA.
Internal Ethanol Concentration
The cuticle of C. elegans provides a barrier to many chemicals such that the difference in concentration between the external and internal concentrations of a chemical can be an order of magnitude or more (1, 7). For this reason, the internal concentration of ethanol in treated worms was determined so that a comparison with the effects of similar concentrations of ethanol in other organisms could be carried out. The internal concentration of ethanol in worms exposed to 400 mM ethanol was determined as follows: 300 to 600 worms were rinsed in M9 buffer (9) and transferred to plates containing NGM agar media either with or without ethanol. After 22 minutes, worms were quickly washed from plates in ice-cold dH2O and pelleted by centrifugation at 4°C. The supernatant was removed carefully such that as little liquid remained as possible, leaving only the packed worm pellet. The volume of the worm pellet was determined by eye using direct comparisons with known liquid volumes in identical tubes. The worm pellet was resuspended in ice-cold dH2O to a final volume of 30 μl. The samples were frozen at -85°C for at least 20 minutes and then homogenized on ice. The worm homogenate was centrifuged at 4°C and the supernatant was removed for analysis. Supernatant (5 μl) was added to Alcohol Reagent (Sigma, 1.5 ml) and the concentration of ethanol was determined by absorbance at 340 nm (as per the manufacturer’s instructions). The concentration of ethanol in the original pellet of worms was calculated according to the dilution factor used when the pellet was resuspended in a total volume of 30 μl.
Results and Discussion
We have described methods for the isolation and behavioral analysis of mutants of C. elegans that are resistant to the depressive effects of ethanol on locomotion. These methods could be applied to any drug that affects the rate of locomotion and could also be used in the identification of mutations that render animals hypersensitive to the drug by lowering the dose of the drug and looking for animals that fail to reach the attractive stimulus (J. Bettinger, unpublished).
We also described a method for the determination of the internal concentration of ethanol, which can be used to test the possibility that an animal is resistant to the effects of ethanol through increased metabolism or clearance of ethanol. Determining the internal concentration of ethanol has also allowed us to make more relevant comparisons to human physiology given that the internal concentration of ethanol of a worm exposed to 400 mM ethanol is 22 ± 0.8 mM, a concentration that is comparable to a blood-alcohol concentration that is required to produce intoxication in humans. The 20-fold difference in internal and external concentrations is indicative of the lack of permeability of the C. elegans cuticle. Given that these animals are soil dwellers, an impermeable cuticle would be an advantageous trait. The fact that the external concentration of a drug may be an order of magnitude or more greater than the internal concentration should be taken into account in drug studies in C. elegans.
The method for screening we describe for the isolation of ethanol-resistant mutants has the benefit that many animals can be tested simultaneously and worms that are capable of coordinated movement will distinguish themselves from the remaining worms that are too intoxicated to be able to move across a plate to an attractive stimulus. As with most genetic screens there is some bias in the potential mutants that can be isolated. For instance, mutations that lead to ethanol resistance must not affect locomotion to such an extent that the worms cannot move across a plate in a period of 30 minutes. This excludes strongly uncoordinated mutants but weakly to moderately uncoordinated mutants should be able to move such a distance. Another class of mutant animals that might fail to be identified by this screen are mutants that cannot sense food or a chemical odorant. A screen for resistance to the depression of the egg-laying behavior caused by ethanol was also described in our analysis of the slo-1 ethanol-resistant mutants (7). Performing both screens simultaneously helped to eliminate some of the bias described above with the assumption that if an ethanol resistance mutation affects locomotion or chemotaxis too strongly it may not necessarily affect egg laying to the same extent and therefore might be isolated in the egg laying screen.
During the course of the genetic screen for ethanol resistant mutants we settled on the use of chemotaxis to an attractive odorant as the preferred method of screening. Initially we used food as the attractive stimulus to complete two rounds of F2 screening (about 3000 haploid genomes of the approximately 10,500 haploid genomes screened). Two of the eight mutants that are resistant to the effects of ethanol on locomotion were isolated in this manner, including one slo-1 mutant. The remaining six mutants (five of which were slo-1 mutants) were isolated from the remaining 7,500 haploid genomes that were screened using butanone as an attractive odorant. These recovery rates suggest that resistant mutants were identified at about the same rate using the two methods. We found that the advantage of using a chemical odorant is that the plates can be prepared more quickly than a plate with a bacterial lawn, the plates are poured the day before and dried for only 1 hour before the screen. Another issue is the effect that ethanol has on a bacterial lawn. Direct exposure to 100% ethanol will kill much of the bacteria on the plate, perhaps diminishing its attractiveness to the animals. In contrast, butanone remains an attractive odorant in the presence of ethanol.
In order to quantify the effect of ethanol on locomotion, we used computer-aided analysis of locomotion of animals in the presence and absence of ethanol. One major factor that is important to consider in measuring the behavior of an animal is its environment. When comparing two or more different strains it was important to minimize the effects that slight differences in the test environment might have on those strains. Factors such as the age or dryness of particular plates or small differences in ethanol concentration may have had significant effects on the behavior we were measuring. While we controlled those factors carefully, we were able to minimize differences beyond our control by testing multiple strains on the same plate. The use of the copper rings as corrals meant that we could test animals on the same plates, exposed to the same ethanol concentrations, all at the same time.
Typically, we tested the locomotion of animals in the absence of food (E. coli) because some mutant strains have food-dependent locomotion behaviors that differ from wild-type animals (11, 12); such differences should be minimized in the absence of food. One issue with locomotion in the absence of food is that the animals are almost constantly in motion, which means that it might be difficult to observe an increase in speed generated by a drug, i.e. a possible ceiling-effect. Measurement of stimulating activities of drugs might be better done in the presence of food where the animals tend to move less often. If the presence of food is necessary for a particular behavior, as it is for egg-laying assays for example, then the use of the copper rings aids in the testing of animals on food because the ethanol can be added to the plates outside the rings so the bacteria inside the rings is protected from direct and lethal exposure to 100% ethanol. Instead, the bacteria are only exposed to the equilibrated concentration of ethanol present in the plate.
The use of Openlab software to record time-lapse movies of locomotion is quite straightforward. The software can control the timing of the camera accurately and can create an output file that is compatible with the DIAS software. Behavioral analysis with the DIAS software requires more attention. DIAS offers both an automated approach and a manual approach to object recognition, we favor using the automated approach but follow that with perusal of the output, making manual corrections if required. DIAS identifies the outline of an object based on the contrast between the pixel intensity (based on a greyscale of 0 to 255) of the edge of an animal and its surroundings. The threshold setting delineates which pixels can be considered in forming an object and which pixels are its surroundings. It creates black objects among a white background if enough dark pixels are adjacent, where that number is set by the user (see below). Increasing the threshold eliminates lighter shaded pixels from being included as an object or part of an object. Therefore, depending on the lighting conditions, the perfect threshold setting recognizes all the worms as objects without recognizing any of the surroundings as belonging to an object. If the lighting is uneven, as can be the case at such low magnification, then it may be difficult to achieve the perfect threshold setting. As incorrectly identified objects can be removed at a later step in the DIAS analysis, erring on the side of too many objects is better than too few.
Selective use of the minimum and maximum object size values allows the elimination of small objects (such as a defect in the agar) and large objects (such as the edge of one of the copper ring corrals) that have been recognized by DIAS. The upper limit of the object size setting is also important for when two worms collide. Our settings will track a worm when it is moving alone but will end the tracked path when the worm collides with another worm or with the copper ring corral because the number of pixels in the combined object are now larger than the maximum set value. In this way, only worms that are moving freely will be analyzed. We have also eliminated any locomotion paths that are less than 20 seconds in length. If an animal is colliding repeatedly with another worm or with the copper ring then the series of short paths that consist of a reversal followed by forward locomotion may skew the average for the population of animals under examination.
To determine the speed of an object, DIAS measures the distance traveled by the calculated centroid for the object in consecutive frames of the movie. It does this for every pair of frames for the length of the path, eventually creating an average speed over the time interval. Subtle changes in the posture of the animal may alter the position of the centroid without the animal actually making forward or backward progress; however, when an animal is moving in the absence of ethanol, the shift in centroid position due to the posture of the animal is small compared with the distance traveled through actual locomotion because the frames are separated by 1 second of motion. In the presence of ethanol, where wild-type worms are covering little ground, posture-induced shifts in the centroid position may have slight, measurable effects on speed. We did not take this into account in our measurements. The likely result of this would be to slightly reduce the actual difference between resistant and susceptible animals by creating apparent movement for the sedated animals.
We chose to collect 2-minute movies of the worms for several reasons, the first being that the longer the movie, the larger the file size and a two-minute movie generated a file of a manageable size. Second, DIAS analysis is labor-intensive if manual correction of the selected objects is carried out. Such a process requires the examination of each of the 120 frames and corrections being made by hand. When many strains are being examined over a series of replicated experiments, this can amount to a significant investment in time. Third, the response of animals, including worms, to drugs is not static. Prolonged exposure to a drug can lead to within-session tolerance meaning that the animals may respond differently to the drug at a later time point than they did at an early time point. Therefore, it was important to capture the behavior of the animals in a particular window of time. Finally, we found that the average speeds of animals of the same strain were not significantly different from movie to movie, which suggests that we are capturing a representative measure of the animals’ behavior. If there were differences in the speed of animals of the same strain between movies then perhaps increasing the minimum path length to a value greater than 20 seconds would allow for a more even response. We have not taken into account the potential behavioral state of the worms (13) although in the absence of food the worms appear to be consistently in motion so such behavioral states may not apply to non-food environments.
C. elegans is an excellent genetic system for studies in development and neurobiology. The use of worms to determine the mode of action of drugs and chemicals of interest is gaining favor. We have provided some detailed methods for the use of C. elegans in the identification of mutants that are resistant to the effects of ethanol on locomotion and subsequent quantification of the behavior of those mutants. These methods are generally applicable to any drug that affects the movement of C. elegans.
Acknowledgments
We wish to thank Mario de Bono for suggesting the use of DIAS for behavioral analysis and Jill Bettinger, Lucinda Carnell, Jonathan Pierce-Shimomura, Catharine Eastman and Tod Thiele for helpful discussion and assistance in the evolution of these methods. Support was provided by the State of California for medical research on alcohol and substance abuse through UCSF, by the Department of the Army (DAMD17-01-1-0738) and by the NIAAA, NIH. The authors have no conflicts of interest to declare related to this publication.
Appendix
Protocols
Screen for ethanol-resistant mutants using an attractive odorant to induce locomotion
Day 0 – Pour 30-40 10 cm Chemotaxis media (2% agar, 5 mM KPO4 (pH 6), 1 mM Ca Cl2, 1 mM MgSO4) (10 ml per plate) plates on the day before the F2 progeny of the mutagenized animals will be at the young adult stage.
Day 1 – Dry the Chemotaxis media plates at 37°C without their lids for 1 hour.
Determine the volume of one of the plates by melting the agar in a 15 ml tube, this could also be done by weight.
Pipette ethanol, to achieve a concentration of 400 mM, on to the surface of each plate, the volume of ethanol is determined by the volume of the plate in the previous step.
Replace the lids and seal the plates with Parafilm, leave the plates at room temperature for 2 hours.
On the outside of each plate, make a mark close to an edge and a mark on the opposite side of the plate; these marks pinpoint the positions of the origin of the worms and the location of the attractive odorant.
Wash the young adult F2 progeny from their plates into a 1.5 ml tube with Assay Buffer (5 mM KPO4 (pH6), 1 mM CaCl2, 1 mM MgSO4), rinse twice more with Assay Buffer to remove bacteria and finally resuspend the worms in Assay Buffer containing 400 mM ethanol. Allow the worms to become intoxicated in this solution for 20 minutes.
Remove most of the liquid in the tube leaving worms in 50-100 μl.
Pipette 1 μl of butanone (diluted 1 in 1000 in 95% ethanol) at the same marked position on each plate.
Pipette the worms on to another marked position on the opposite side of the plate from the butanone. Use the corner of a Kimwipe to wick up excess liquid without damaging the worms or the surface of the plates.
Replace the lids and seal with Parafilm. Wait for approximately 30 minutes, the worms should try to move toward the spot of butanone.
Pick worms that are closest to the spot of butanone to individual seeded plates and allow them to reproduce. These are ethanol resistant candidates.
Day 4 – Visually compare the ethanol sensitivity of 20-30 progeny from each of the resistant candidates with animals from the wild-type parental strain. This can be done on the same plates by using the copper ring plates described below.
Maintain and outcross with the parental wild-type strain any of the candidates that show measurable resistance to ethanol.
Quantification of locomotion speed
Day 0 – Pour four 6 cm NGM agar media (10 ml) plates for every two strains that need to be tested. Typically we test two strains and a wild-type strain on the same plate. One plate is required for the ethanol assay, one plate for the untreated assay and two plates are required to acclimate the animals to an absence of food. Pour at least one additional plate to be used to measure plate volume.
NGM Agar Media – Mix and autoclave, 3 g NaCl, 17 g agar, 2.5 g peptone, 1 ml cholesterol (5 mg/ml in ethanol), 975 ml H2O then add the following sterile solutions: 1 ml 1 M CaCl2, 1 ml 1 M MgSO4, 25 ml 1 M potassium phosphate (pH 6).
Day 2 – Dry the plates at 37°C without their lids for 2 hours.
Measure the volume of one of the plates to determine the volume of ethanol that should be added to achieve a concentration of 400 mM.
Melt three copper rings into the surface of each plate. This is done by holding a ring in a flame for about 2 seconds with forceps then carefully placing the ring in position on the plate. Apply gentle pressure to the top of the ring to sink it slightly into the surface of the plate. As the ring cools, the melted agar will solidify which creates a barrier that prevents the worms from escaping.
Add ethanol to one quarter of the plates. Seal the plates with Parafilm, leave at room temperature for two hours to allow the ethanol to equilibrate in the media.
For each strain to be tested, pick 10 worms into a ring on one of the non-ethanol plates.
Try to remove any bacteria that was transferred with the animals. Wait for 30 minutes.
Using a pick without bacteria, move the animals to the assay plate (either 0 mM or 400 mM ethanol). At this point, try to move the animals as quickly as possible so that there is minimal time difference in when the three strains were first placed on the plate.
After 20 minutes of exposure, begin recording 1 frame per second for 2 minutes using an automation in Openlab. Save the resulting movie in Quicktime format.
Open the movie file in DIAS. Choose: Autotrace by Threshold. Select a threshold that correctly identifies the worms as objects but minimizes background (90-150 is the range that worked best for our system), and a minimum and maximum number of pixels that will identify one worm but eliminate two worms as a potential object (e.g. Min: 10, Max: 36).
Choose Trace on Movie, view each frame and correct any errors in the automatic object recognition process.
Choose: Make Paths From Traces. Choose the same minimum number of pixels per object as for Auto Trace by Threshold and a Minimum Path Length of 21, which will ensure that no paths shorter than 20 seconds will be included.
Choose: Compute Data. Select Summary, All Data and Speed, deselect Plot, then choose to save the summary in the tab delimited format. The resulting file can be opened in Microsoft Excel or other spreadsheet programs for subsequent graphical and statistical analysis.
References
- Rand JB, Johnson CD. In: Epstein HF, Shakes DC, Caenorhabditis elegans: Modern biological analysis of an organism. San Diego: Academic Press; 1995. p. 187-204.
- Matthews DJ, Kopczynski J. Using model-system genetics for drug-based target discovery. Drug Discov Today. 2001;6:141–149. doi: 10.1016/s1359-6446(00)01612-3. [DOI] [PubMed] [Google Scholar]
- Brownlee DJ, Fairweather I. Exploring the neurotransmitter labyrinth in nematodes. Trends Neurosci. 1999;22:16–24. doi: 10.1016/S0166-2236(98)01281-8. [DOI] [PubMed] [Google Scholar]
- Bargmann CI. Neurobiology of the Caenorhabditis elegans genome. Science. 1998;282:2028–2033. doi: 10.1126/science.282.5396.2028. [DOI] [PubMed] [Google Scholar]
- ffrench-Constant RH, Anthony N, Aronstein K, Rocheleau T, Stilwell G. Cyclodiene insecticide resistance: from molecular to population genetics. Annu Rev Entomol. 2000;45:449–466. doi: 10.1146/annurev.ento.45.1.449. [DOI] [PubMed] [Google Scholar]
- Dent JA, Davis MW, Avery L. avr-15 encodes a chloride channel subunit that mediates inhibitory glutamatergic neurotransmission and ivermectin sensitivity in Caenorhabditis elegans. EMBO J. 1997;16:5867–5879. doi: 10.1093/emboj/16.19.5867. [DOI] [PMC free article] [PubMed] [Google Scholar]
- Davies AG, Pierce-Shimomura JT, Kim H, VanHoven MK, Thiele TR, Bonci A, Bargmann CI, McIntire SL. A central role of the BK potassium channel in behavioral responses to ethanol in C. elegans. Cell. 2003;115:655–666. doi: 10.1016/s0092-8674(03)00979-6. [DOI] [PubMed] [Google Scholar]
- Wang ZW, Saifee O, Nonet ML, Salkoff L. SLO-1 potassium channels control quantal content of neurotransmitter release at the C. elegans neuromuscular junction. Neuron. 2001;32:867–881. doi: 10.1016/s0896-6273(01)00522-0. [DOI] [PubMed] [Google Scholar]
- Sulston J, Hodgkin J. In: Wood WB, The Nematode Caenorhabditis elegans. Plainview, NY: Cold Spring Harbor Laboratory Press; 1988. p. 587-606.
- Colbert HA, Bargmann CI. Odorant-specific adaptation pathways generate olfactory plasticity in C. elegans. Neuron. 1995;14:803–812. doi: 10.1016/0896-6273(95)90224-4. [DOI] [PubMed] [Google Scholar]
- Sawin ER, Ranganathan R, Horvitz HR. C. elegans locomotory rate is modulated by the environment through a dopaminergic pathway and by experience through a serotonergic pathway. Neuron. 2000;26:619–631. doi: 10.1016/s0896-6273(00)81199-x. [DOI] [PubMed] [Google Scholar]
- de Bono M, Bargmann CI. Natural variation in a neuropeptide Y receptor homolog modifies social behavior and food response in C. elegans. Cell. 1998;94:679–689. doi: 10.1016/S0092-8674(00)81609-8. [DOI] [PubMed] [Google Scholar]
- Fujiwara M, Sengupta P, McIntire SL. Regulation of body size and behavioral state of C. elegans by sensory perception and the EGL-4 cGMP-dependent protein kinase. Neuron. 2002;36:1091–1102. doi: 10.1016/s0896-6273(02)01093-0. [DOI] [PubMed] [Google Scholar]