Abstract
Importance
The macula is essential for visual functioning and is known to be affected even in early glaucoma. However, little is currently understood about the prevalence and nature of central vision loss in early glaucoma.
Objective
To determine the prevalence and characteristics of visual field (VF) defects in the central 10° in glaucoma suspects and patients with mild glaucoma using a prospective design.
Design
Prospective observational cohort study.
Setting
Outpatient glaucoma specialty clinic.
Participants
One hundred eyes from 74 patients with glaucomatous optic neuropathy and a 24-2 VF with mean deviation (MD) better than −6dB were prospectively studied and tested with a 10-2 test.
Main Outcome Measures
Reliable VF hemifields were classified as abnormal based on a cluster criterion and abnormal 10-2 VFs were categorized based upon the pattern of abnormal points: arcuate-like, widespread, or other. In addition, at each point of the 10-2 VF, the total deviation (TD) values were averaged across eyes and the number of abnormal points (Ncrit) with TD values below a specific criterion level calculated.
Results
There appeared to be as many abnormal 10-2 hemifields (53%) as abnormal 24-2 hemifields (59%). Of the eyes with normal 24-2 hemifields, 16% were classified as abnormal when the 10-2 test was used. Of the abnormal 10-2 hemifields, 68%, 8%, and 25% were arcuate-like, widespread and other, respectively. The average TD values and Ncrit plots revealed superior VF defects that were deeper and closer to fixation than those in the inferior visual field.
Conclusions and Relevance
The 10-2 VF was abnormal in nearly as many hemifields as was the 24-2 VF, including some with normal 24-2 VF, suggesting that the 24-2 test is not optimal for detecting early damage of the macula. The pattern of the defects was in agreement with a recent model of macular damage.
The visual functions most vital for some everyday activities such as reading and object identification depend upon the integrity of the fovea and the central macular region immediately around it. However, the test pattern most widely used in static automated perimetry (SAP) does not adequately sample the macular region. In particular, the points of the 24-2 visual field (VF) test pattern are spaced every 6°. Thus, only 4 points fall within the central 8°, the region in which over 30% of the retinal ganglion cells (RGC) reside.1 Furthermore, these 4 points fall outside the region of highest RGC density as seen with frequency domain optical coherence tomography (fdOCT), when the displacement of the RGCs in the fovea is taken into consideration.2,3
This relatively poor sampling of the central 8° would be of little concern if glaucoma did not affect the macular region or, for that matter, if initial glaucomatous damage always occurred outside the central macula region. However, it has been clear for at least 40 years that early, and even initial, macular defects occur in some patients.4–9 (See ref 3 for a review.) In a study explicitly designed to assess initial defects, Heijl and Lundqvist9 followed 45 eyes that progressed from a normal to an abnormal VF. Although the largest number of initially abnormal VF points occurred at 15° from fixation, there were a number of abnormal points at 5°, especially nasally and in the upper VF. More recently, Schiefer et al10 reported that over 50% of eyes with mild to moderate glaucoma had defects within the central ±3°. In addition, we reported 11 eyes with normal 24-2 VFs outside the central ±10°, but with clear arcuate defects appearing initially within the central 10° as seen with a finer 2° test (10-2) grid.11 Further, on fdOCT scans, the RGC region within the central 4 points of the 24-2 test was thinner than normal, even in glaucoma suspects with VFs judged to be normal.2,3,11
Practically speaking, the fact that early glaucomatous damage can occur close to fixation would not matter if the 24-2 (6° grid) test did as well as the 10-2 (2° grid) test in detecting early macular damage. However, there is surprisingly little information on this important point. In a largely overlooked study, Langerhorst et al13 prospectively obtained VF data with both a 30-2 (6° grid) and a 10-2 (2° grid) test pattern. For their patients, who were either glaucoma suspects or showed signs of early glaucoma, 9% of the hemifields classified as normal with the 30-2 were classified as abnormal with the 10-2. Further, the 30-2 test underestimated the severity of glaucomatous damage in 13% of the hemifields.13
Because of the clinical importance of central vision, more information is needed regarding possible macular damage missed with a 6° (30-2 and 24-2) test grid. One purpose of the present study was to compare prospectively the results of 10-2 and 24-2 VF tests in a group of patients with abnormal appearing optic discs and with 24-2 tests ranging from normal (suspects) to mild glaucomatous defects (MD ≤−6 dB). In addition, to better understand the nature of early macular damage due to glaucoma, we classified the defects seen on 10-2 VFs and examined the general pattern of damage seen on the VFs.
METHODS
As our focus was on early glaucomatous changes, only patients with glaucomatous optic neuropathy on fundus exam, and a mean deviation (MD) better than −6 dB on 24-2 VF (Humphrey Visual Field Analyzer; Carl Zeiss Meditec, Inc, Dublin, CA) were included in this prospective study. Patients underwent 10-2 VF testing within 6 months of the 24-2 VF, or if 10-2 testing was performed after 6 months, an additional 24-2 VF was performed to serve as a comparison. Both 10-2 and 24-2 VFs employ the same test spot size (Goldmann size III) and background luminance (31.5 asb) and were obtained with the SITA-standard test strategy after appropriate refractive correction. Only eyes with reliable 24-2 and 10-2 VFs, defined as fixation losses ≤33%, false positives ≤15% and false negatives ≤20%, were included. One hundred eyes of 74 patients (average age of 61.7±11.8 years) were included in this study. All patients had open angle glaucoma (abnormal 24-2 VF) or were open angle glaucoma suspects (normal 24-2 VF). The average MDs on the 24-2 and 10-2 VFs were −2.24 and −2.60 dB, respectively.
Written informed consent was obtained from all participants. Procedures followed the tenets of the Declaration of Helsinki and the Committee of the Institutional Review Board of Research Associates of Columbia University approved the protocol.
Classifying 10-2 Visual Fields
The VFs of the 100 eyes were classified using a cluster rule. Specifically, hemifields were classified as abnormal if there was a cluster of 3 contiguous points (5%, 5%, 1% or 5%, 2%, 2%) within a hemifield on either total deviation or pattern deviation plots.
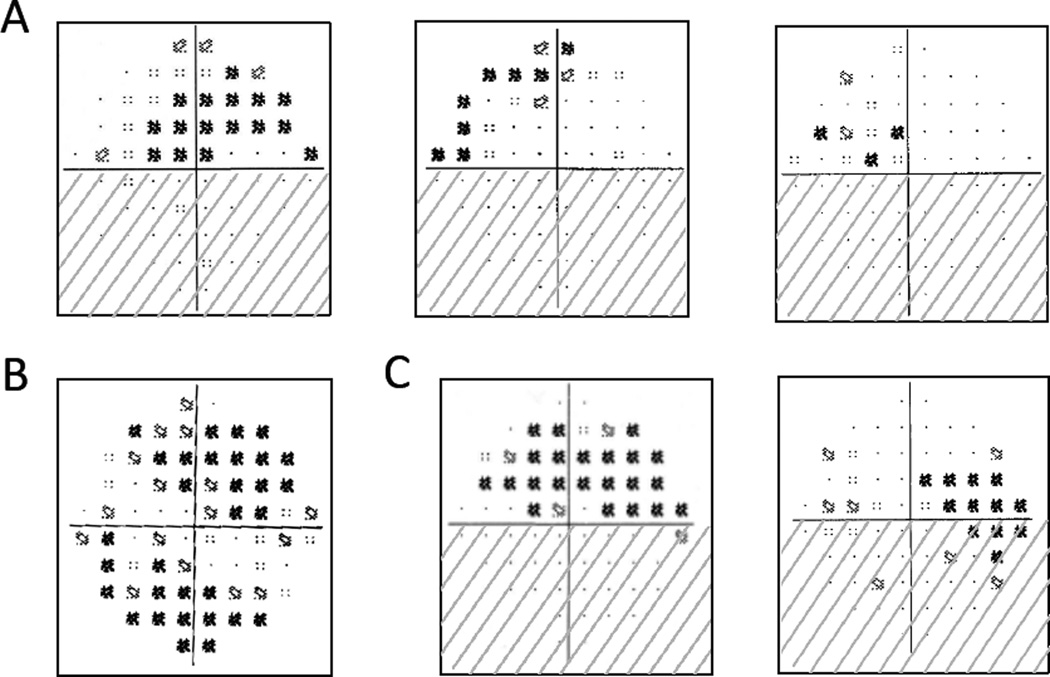
The VF hemifields that failed this cluster test were classified into the following 3 categories based on the pattern/shape of abnormal points: (1) arcuate-like, (2) widespread, and (3) other. The arcuate-like category included arcuate (a continuous, dense defect that involved both quadrants; Fig. 1A, left panel); partial arcuate (a continuous defect that involved both quadrants, but was less dense than an arcuate; Fig. 1A, middle panel); and nasal (a defect restricted largely to the nasal quadrant; Fig. 1A, right panel).14 Widespread (Fig. 1B) was defined as a loss in all 4 quadrants on both total and pattern deviation plots that did not appear arcuate-like. Abnormal hemifields that did not fall into either of these categories were classified as “other”. They were predominately scattered across the field or predominately located in the temporal quadrants (Fig. 1C).
Figure 1. Examples of 10-2 VF Categories.
All VFs are presented in right eye view. (A) VFs with loss consistent with an arcuate-like pattern ranging from arcuate (left) to nasal (right). (B) VF with widespread loss. (C) VFs with temporal loss classified as “other.”
Additional 10-2 analyses of the pattern of early glaucomatous VF damage
At each point of the 10-2 VF, the total deviation (TD) values were averaged across all 100 eyes. In addition, the number of abnormal points (Ncrit) with TD values below a criterion (crit) level of −3, −5, −15 or −20 dB was calculated.
RESULTS
Prevalence of central damage in early glaucoma
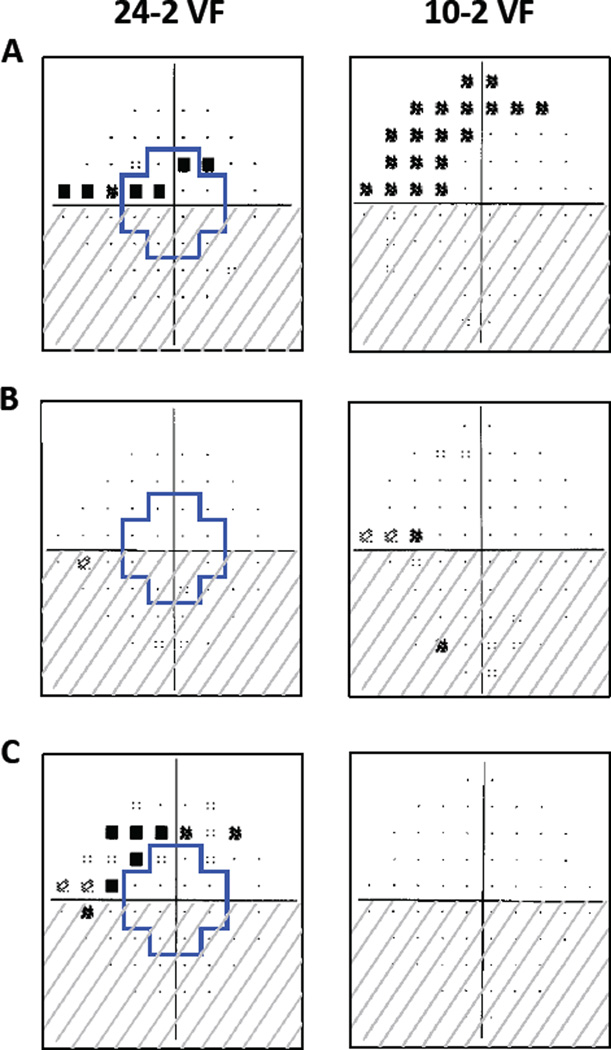
As seen in Table 1, the agreement among tests was good with 163 (81.5%) of the hemifields and 88 (88%) of the eyes showing agreement on the 24-2 and 10-2 tests. Figure 2A shows an example of a superior hemifield that was abnormal on both tests. More importantly, abnormal 10-2 VFs (106 hemifields, 76 eyes) were nearly as common as abnormal 24-2 VFs (117 hemifields, 78 eyes). Furthermore, some of the hemifields classified as normal on 24-2 VFs were classified as abnormal on 10-2 VFs. In particular, 13 (15.7%) of the 83 hemifields and 5 (22.7%) of the 22 eyes classified as normal on the 24-2 VF were abnormal on the 10-2 VF, e.g., see the superior hemifield in Figure 2B. As expected, 24 (20.5%) of the 117 24-2 VFs classified as abnormal were found to be normal on the 10-2 VF test, e.g. see the superior hemifield in Figure 2C.
Table 1.
Number of abnormal and normal hemifields (eyes) on 24-2 and 10-2 VFs
| 10-2 | ||||
|---|---|---|---|---|
| Abnormal | Normal | |||
| 24-2 | Abnormal | 93 (71) | 24 (7) | 117 (78) |
| Normal | 13 (5) | 70 (17) | 83 (22) | |
| 106 (76) | 94 (24) | 200 (100) | ||
Figure 2. 24-2 and 10-2 VF Examples.
The region within the blue cross on the 24-2 VFs corresponds to the region in the central 10° tested by the 10-2 VF test points. All fields are presented in right eye view. (A) Both superior hemifields are abnormal. (B) The superior hemifield is normal on the 24-2, but abnormal on the 10-2 VF. (C) The superior hemifield is abnormal on the 24-2, but normal on the 10-2 VF.
On the 24-2 VF, the prevalence of abnormal superior hemifields (58%) was about the same as abnormal inferior hemifields (59%). However, there were slightly more abnormal superior hemifields (59%) than abnormal inferior hemifields (47%) on 10-2 VFs.
Classification of the 10-2 visual fields
The 200 10-2 hemifelds were classified as described in the Methods and the results are shown in Table 2. A similar distribution of defect type was found for superior and inferior hemifields. Of the 106 abnormal 10-2 hemifields, more than two-thirds (72 hemifields) were arcuate-like. The remaining 34 abnormal hemifields were either widespread (8 hemifields) or other (26 hemifields).
Table 2.
Classification of 10-2 hemifields
| Abnormal | Normal | |||||
|---|---|---|---|---|---|---|
| Arucate-like | Widespread | Other | ||||
| 10-2 | Superior Hemifield | 42 | 4 | 12 | 42 | 100 |
| Inferior Hemifield | 30 | 4 | 14 | 52 | 100 | |
| 72 | 8 | 26 | 94 | 200 | ||
The pattern of early glaucomatous VF damage
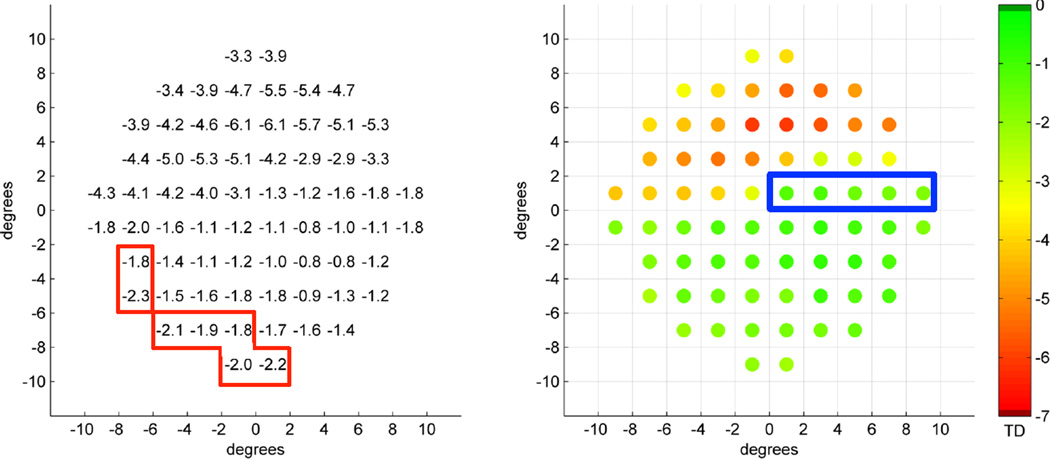
To better understand the pattern of early glaucomatous VF damage in the macula and to see if it conforms to a recent model,2,3 the 10-2 data was aggregated in two ways. First, the TD values were averaged by location. Figure 3 shows the averaged TD values (left) and the same data in pseudo-color (right). First, all locations show TD values less than zero (mean normal). Second, the deepest defects (yellow and red in right panel) are in the superior VF and close to fixation. Third, the superior maculo-papillary region (blue rectangle) and inferior macular regions are less affected. Finally, the deepest inferior defects are at the nasal edge of the inferior field (within red borders in left panel).
Figure 3. Average TD Values for All Patients.
Average TD values at each 10-2 location in dB units (left panel) and as pseudo-color (right panel). The blue rectangle corresponds to the maculo-papillary region, which is preserved in the superior hemifield. Both maps are in right eye view.
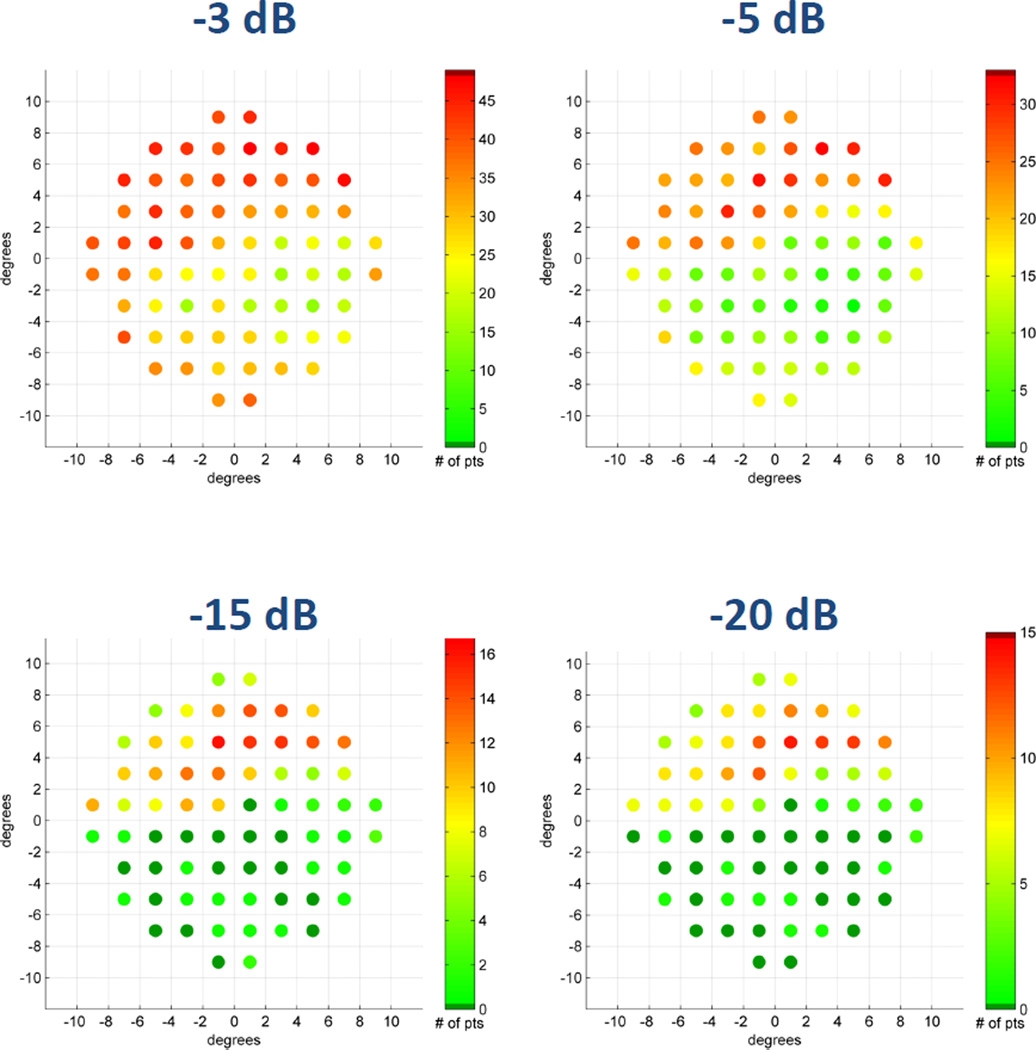
The number of eyes with TD values below different criterion levels was also analyzed. Figure 4 shows these results for 4 criterion levels. (Notice that the pseudo-color scale is different in each panel in that the darkest red is associated with the most severe TD for each specific criterion level.) Consistent with Fig. 3, the defects are deeper in the superior field. Further, the pattern of abnormal points is different in the superior versus inferior hemifields; see in particular the data for mild defects (−3 and −5 dB).
Figure 4. Average TD Values for Specific Criterion Level.
The number of eyes with TD values below specific criterion levels. Pseudo-color legends are to the right of each map and all maps are in right eye view.
DISCUSSION
The purpose of this prospective study was to examine the prevalence and characteristics of early glaucomatous damage to the macula. In patients classified as suspects or mild glaucoma based upon abnormal discs and VF with MD better than −6 dB, abnormal 10-2 VFs were nearly as common as abnormal 24-2 VFs (Table 1). Similarly, Langerhorst et al,12 found 36% and 48% of the hemifields were abnormal on 10-2 and 30-2 VFs, respectively. Together these prospective studies support the hypothesis that glaucomatous damage can occur in the macula at a very early stage of the disease. In fact, 81.5% (91.5%) of the hemifields (eyes) we classified as abnormal on either the 10-2 or 24-2 VFs had macular defects as documented by an abnormal 10-2 VF (Table 1).
It is clear that testing with the 24-2 VF alone can miss defects detected on the 10-2 VF. Of the 24-2 hemifields (eyes) classified as normal, 15.7% (22.7%) had defects when tested with the 10-2 VF. Recent fdOCT results supply an explanation. In particular, the areas of RGC+ thinning observed with fdOCT in patients with early damage correspond largely to the central 4 test points of the 24-2 VF test.2,3
To better understand the nature of the macular damage, we categorized the 106 abnormal 10-2 hemifields and found that two-thirds of them had arcuate-like patterns, which included what could be called partial arcuate, paracentral and nasal defects, and that the remaining VFs had either widespread loss or other defects (Table 2). When referring to glaucomatous damage, it is important to distinguish between VF defects and anatomical thinning of the RNFL. While a patient with an anatomical “arcuate” RNFL defect, as seen on fundus photographs or OCT, may have a clear arcuate defect on the VF, it also can be associated with other VF patterns, including the patterns we classified as widespread and other. It can even appear as a cecocentral VF defect (see Fig. 3 in ref 11). Thus, our estimate of two-thirds arcuate-like VF defects underestimates the proportion of RNFL defects that are arcuate-like in terms of RNFL loss. We expect that many of the “other” and “widespread” cases would show local RNFL thinning at the disc and an arcuate-like RNFL defects in the macula. On the other hand, we do not mean to deny the presence of diffuse damage, which clearly exists to some mild degree in many patients.15,16 In any case, we cannot reject the hypothesis that early macular damage is due primarily to arcuate-like RNFL damage. This hypothesis needs testing with a prospective study, which includes OCT scans.
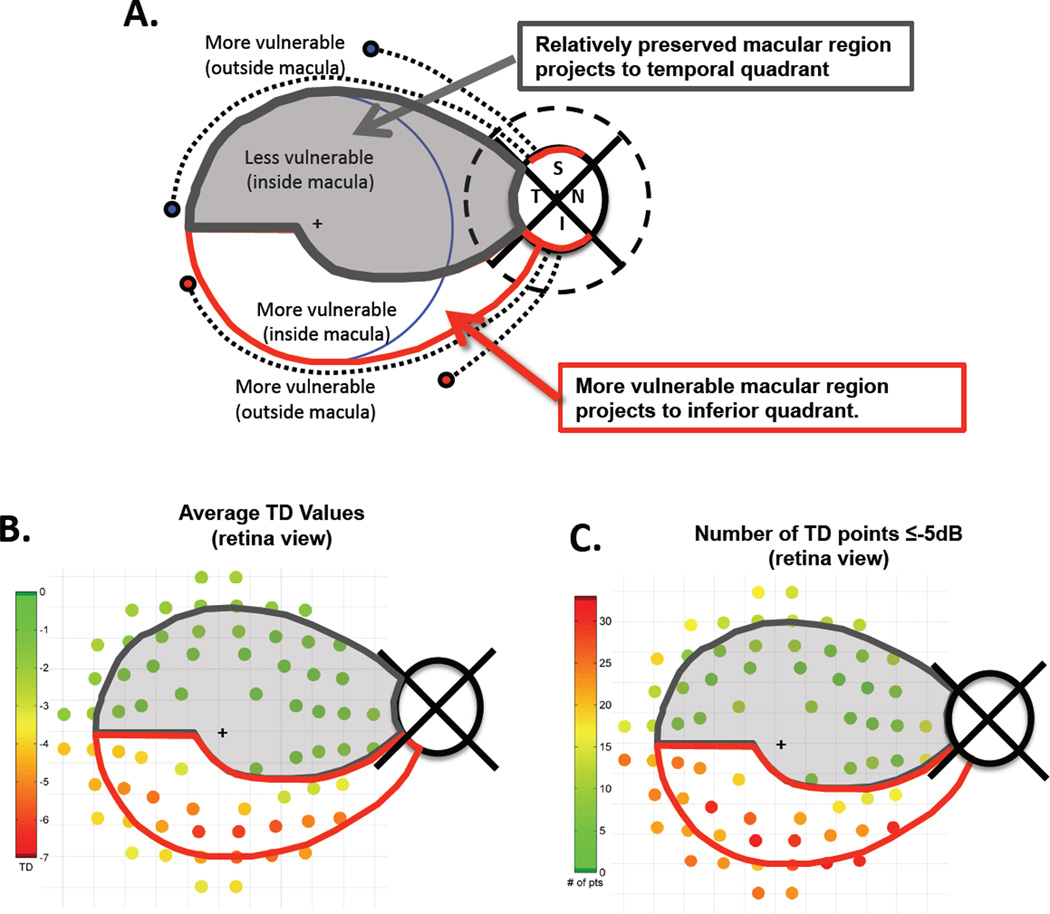
To understand the pattern of glaucomatous damage to the macula, we have proposed the schematic model3 illustrated in Figure 5A. We called it a “schematic” as the details of the boundaries are only approximate, are not as sharp as shown, and will vary to some extent across individuals. This model assumes that the RGCs in the inferior retinal region of the macula largely project to the most vulnerable (inferior) region of the disc, while those in the superior region of the macula project to the temporal region of the disc, which is less vulnerable to glaucomatous damage. Outside the central 8° (blue circle), both inferior and superior RGCs project to the vulnerable regions of the disc usually associated with the thick arcuate bundles (red arcs on disc in Fig. 5A). In Fig. 5B,C the average TD values (B) and the total number of abnormal points ≤−5 dB (C) from Figs. 3 and 4 are shown in retinal view and superimposed on the model. The test points are adjusted for the displacement of the retinal ganglion cells as previously described.11,17 Notice that although there were only slightly more abnormal 10-2 VFs in the superior (59%) as compared to the inferior (47%) hemifields, the pattern and depth of the defects were different and consistent with the model.
Figure 5. The Schematic Model.
The schematic model describes RGCs projections from the macula to the disc.2,3 (A) The RNFL bundles (dashed black curves) associated with RGCs outside the macula (blue circle) project to the regions (red arcs) of the superior (S) and inferior (I) quadrants of the disc, which are associated with the most RNFL damage. The RGCs within the grey area with dark grey border project to the relatively less vulnerable temporal quadrant of the disc, while the RGCs within the white area with red borders project to the more vulnerable inferior quadrant of the disc. (B) The schematic model is superimposed upon a retinal view of the 12 map of average TD values from Fig 3. The 10-2 points have been adjusted for RGC displacement.11.17 (C) The schematic model is superimposed upon a retinal view of the map of the number of eyes with TD values less than or equal to −5 dB from Fig 4. Pseudo-color legends are to the right of each map.
Conclusion
Macular damage as seen on 10-2 VFs appears to occur almost as frequently as peripheral defects in patients with glaucomatous optic neuropathy and/or early glaucoma. Further, approximately 16% of these patients may have undetected central defects when testing functional loss with 24-2 VF alone. This reinforces the conclusion that modification to the 6° grid used in VF tests such as the 24-2 should be considered.2,3,10 Taken together, the results from the analyses of the frequency and nature of 10-2 VF defects suggest that localized RNFL thinning early in glaucoma can result in both peripheral and central arcuate-like field defects. A recent model2,3 provides a structural basis for the pattern of macular damage observed. In any case, by using a 24-2 VF alone, clinicians can miss foveal and macular changes occurring before peripheral defects are present. Thus, it is important to use a VF test that better samples the central 10° than does the 24-2 test.
ACKNOWLEDGMENTS
The authors thank Vivian Greenstein, Ph.D.a, Jeffrey G. Odel, M.D.b, and Matthew Nguyen, M.D.c for their helpful discussions and/or comments on this manuscript and Diane Wangc and Stasy Slobodnickc for their help with data analysis. a. Dept of Ophthalmology, NYU Langone Medical Center, NY, NY; b. Dept of Ophthalmology, c. Dept of Psychology, Columbia University, NY, NY
This work was supported by National Eye Institute grant R01-EY-02115 and the Harry and Linda Steinberg Research Fund of the New York Glaucoma Research Institute, New York, NY.
Footnotes
AUTHORS’ CONTRIBUTIONS: All authors met the 3 criteria for authorship
CONFLICT OF INTEREST DISCLOSURES
I. Traynis: None, C.G. De Moraes: None, A.S. Raza: None, J.M. Liebmann: None, R. Ritch: None, D.C. Hood: None.
Ilana Traynis and Donald Hood had full access to all of the data in the study and take responsibility for the integrity of the data and the accuracy of the data analysis.
Contributor Information
Ilana Traynis, Email: ilana.traynis@gmail.com.
Carlos G. De Moraes, Email: gustavonyee@gmail.com.
Ali S. Raza, Email: asr2120@columbia.edu.
Jeffrey M. Liebmann, Email: jml18@earthlink.net.
Robert Ritch, Email: ritchmd@earthlink.net.
Donald C. Hood, Email: dch3@columbia.edu.
REFERENCES
- 1.Curcio CA, Allen KA. Topography of ganglion cells in human retina. J Comp Neurol. 1990;300(1):5–25. doi: 10.1002/cne.903000103. [DOI] [PubMed] [Google Scholar]
- 2.Hood DC, Raza AS, de Moraes CG, Johnson CA, Liebmann JM, Ritch R. The nature of macular damage in glaucoma as revealed by averaging optical coherence tomography data. Trans Vis Sci Tech. 2012;1(1):3. doi: 10.1167/tvst.1.1.3. [DOI] [PMC free article] [PubMed] [Google Scholar]
- 3.Hood DC, Raza AS, de Moraes CG, Liebmann JM, Ritch R. Glaucomatous damage of the macula. Prog Ret Eye Res. 2013;32:1–21. doi: 10.1016/j.preteyeres.2012.08.003. [DOI] [PMC free article] [PubMed] [Google Scholar]
- 4.Aulhorn E, Harms M. In: Early visual field defects in glaucoma. Leydhecker W, editor. Basel:Karger: Glaucoma, Tutzing Symposium; 1967. pp. 151–186. [Google Scholar]
- 5.Drance SM. The early field defects in glaucoma. Invest Ophthalmol. 1969;8(1):84–91. [PubMed] [Google Scholar]
- 6.Aulhorn E, Karmeyer H. Frequency distribution in early glaucomatous visual field defects. Doc Ophthalmol Proc Series. 1977;14:17–83. [Google Scholar]
- 7.Nicholas SP, Werner EB. Location of early glaucomatous visual field defects. Can J Ophthalmol. 1980;15(3):131–133. [PubMed] [Google Scholar]
- 8.Anctil JL, Anderson DR. Early foveal involvement and generalized depression of the visual field in glaucoma. Arch Ophthalmol. 1984;102(3):363–370. doi: 10.1001/archopht.1984.01040030281019. [DOI] [PubMed] [Google Scholar]
- 9.Heijl A, Lundqvist L. The frequency distribution of earliest glaucomatous visual field defects documented by automatic perimetry. Acta Ophthalmol (Copenh) 1984;62(4):658–664. doi: 10.1111/j.1755-3768.1984.tb03979.x. [DOI] [PubMed] [Google Scholar]
- 10.Schiefer U, Papageorgiou E, Sample PA, et al. Spatial pattern of glaucomatous visual field loss obtained with regionally condensed stimulus arrangements. Invest Ophthalmol Vis Sci. 2010;51(11):5685–5689. doi: 10.1167/iovs.09-5067. [DOI] [PMC free article] [PubMed] [Google Scholar]
- 11.Hood DC, Raza AS, de Moraes CG, et al. Initial arcuate defects within the central degrees in glaucoma. Invest Ophthalmol Vis Sci. 2011;52(2):940–946. doi: 10.1167/iovs.10-5803. [DOI] [PMC free article] [PubMed] [Google Scholar]
- 12.Park SC, De Moraes CG, Teng CC, Tello C, Liebmann JM, Ritch R. Initial parafoveal versus peripheral scotomas in glaucoma: risk factors and visual field characteristics. Ophthalmology. 2011;118(9):1782–1789. doi: 10.1016/j.ophtha.2011.02.013. [DOI] [PubMed] [Google Scholar]
- 13.Langerhorst CT, Carenini LL, Bakker D, De Bie-Raakman MAC. Measurements for description of very early glaucomatous field defects. In: Wall M, Heiji A, editors. Perimetry Update 1996/1997. New York: Kugler Publications; 1997. pp. 67–73. [Google Scholar]
- 14.Keltner JL, Johnson CA, Cello KE, et al. Ocular Hypertension Treatment Study Group. Classification of visual field abnormalities in the ocular hypertension treatment study. Arch Ophthalmol. 2003;121(5):643–650. doi: 10.1001/archopht.121.5.643. Erratum in: Arch Ophthalmol. 2008;126(4)561. [DOI] [PubMed] [Google Scholar]
- 15.Henson DB, Artes PH, Chauhan BC. Diffuse loss of sensitivity in early glaucoma. Invest Ophthalmol Vis Sci. 1999;40(13):3147–3151. [PubMed] [Google Scholar]
- 16.Artes PH, Chauhan BC, Keltner JL, Cello KE, et al. Ocular Hypertension Treatment Study Group. Longitudinal and cross-sectional analyses of visual field progression in participants of the Ocular Hypertension Treatment Study. Arch Ophthalmol. 2010;128(12):1528–1532. doi: 10.1001/archophthalmol.2010.292. [DOI] [PMC free article] [PubMed] [Google Scholar]
- 17.Raza AS, Cho JS, de Moraes CGV, et al. Retinal ganglion cell layer thickness and local visual field sensitivity in glaucoma. Arch Ophthalmol. 2011;129(12):1529–1536. doi: 10.1001/archophthalmol.2011.352. [DOI] [PMC free article] [PubMed] [Google Scholar]


