

Abstract
Neural stem/progenitor cells (NSPCs) are multipotent cells within the embryonic and adult brain that give rise to both neuronal and glial cell lineages. Maintenance of NSPC multi-potency is promoted by low oxygen tension, although the metabolic underpinnings of this trait have not been described. In this study, we investigated the metabolic state of undifferentiated NSPCs in culture, and tested their relative reliance on oxidative versus glycolytic metabolism for survival, as well as their dependence on hypoxia inducible factor-1alpha (HIF-1α) expression for maintenance of metabolic phenotype. Unlike primary neurons, NSPCs from embryonic and adult mice survived prolonged hypoxia in culture. In addition, NSPCs displayed greater susceptibility to glycolytic inhibition compared with primary neurons, even in the presence of alternative mitochondrial TCA substrates. NSPCs were also more resistant than neurons to mitochondrial cyanide toxicity, less capable of utilizing galactose as an alternative substrate to glucose, and more susceptible to pharmacological inhibition of the pentose phosphate pathway by 6-aminonicotinamide. Inducible deletion of exon 1 of the Hif1a gene improved the ability of NSPCs to utilize pyruvate during glycolytic inhibition, but did not alter other parameters of metabolism, including their ability to withstand prolonged hypoxia. Taken together, these data indicate that NSPCs have a relatively low requirement for oxidative metabolism for their survival and that hypoxic resistance is not dependent upon HIF-1α signaling.
Keywords: glycolysis, HIF, hypoxia, metabolism, neural progenitor cell, neural stem cell
Neural stem/progenitor cells (NSPCs) are multipotent cells with self-renewing capabilities. During embryonic development, radial glial cells within the ventricular zone serve as primitive neural stem cells that give rise to both neuronal and glial lineages [for review, see (Kriegstein and Alvarez-Buylla 2009)]. Neural stem/progenitor cells derived from embryonic radial glia persist throughout adulthood within restricted regions that include the forebrain subventricular zone (SVZ) and hippocampal dentate subgranular zone (SGZ), where they continue to give rise to new neurons of the adult olfactory bulb and dentate gyrus, respectively (Gage 2000; Doetsch 2003a,b). Although the role of post-natal neurogenesis in brain function remains controversial, the potential therapeutic use of NSPCs to replace damaged neurons and glia within the central nervous system is an area of intense research interest and clinical significance. Therapeutic approaches include transplantation of neural stem cells that have been expanded in an undifferentiated state ex vivo, and manipulation of endogenous NSPCs that are resident within the post-natal brain. The therapeutic significance of understanding neural stem cell biology is also underscored by a potential link with CNS cancer stem cells, which share many properties with normal adult neural stem cells (Germano et al. 2010; Mohyeldin et al. 2010). Finally, endogenous NSPCs display a remarkable capacity to withstand many types of metabolic and traumatic brain injuries and to initiate an endogenous regenerative response (Lichtenwalner and Parent 2006), making them attractive targets for promoting structural and functional brain repair.
Metabolic state is likely to influence the maintenance of the stem cell pool and NSPC survival following traumatic and metabolic insults. Oxygen tension has been shown to influence neural stem cell properties during normal development and disease (Morrison et al. 2000; Studer et al. 2000; Panchision 2009; Mohyeldin et al. 2010). In culture, low oxygen tension promotes NSPC self-renewal, stimulates proliferation and alters phenotypic outcome following differentiation. In vivo, disruption of oxygen availability to the brain during early post-natal development (Yang et al. 2008) or in adulthood (Arvidsson et al. 2002; Thored et al. 2006; Li et al. 2010) promotes cellular proliferation within the SVZ and stimulates migration of cells derived from the SVZ into the hypoxic brain region. Although several studies have demonstrated that NSPCs thrive under low oxygen conditions (Morrison et al. 2000; Studer et al. 2000; Santilli et al. 2010), the metabolic underpinnings of this property have not been delineated.
Hypoxia Inducible Factor-1alpha (HIF-1α) is part of the HIF-1 transcriptional complex involved in regulation of target genes associated with hypoxic adaptation (Semenza 2012). In most cell types, HIF-1α protein is constitutively produced but rapidly degraded in the presence of oxygen. Under hypoxic conditions, HIF-1α protein is stabilized and translocates to the nucleus to dimerize with HIF-1β (which is not susceptible to oxygen-dependent degradation) to form the HIF-1 transcriptional complex. This complex binds to response elements in genes encoding metabolic enzymes and transporters that promote glycolytic, over oxidative, metabolism. NSPCs express a basal level of stabilized HIF-1α under normoxic conditions in culture and within the subventricular and subgranular zones of post-natal mouse brain in vivo (Mazumdar et al. 2010; Roitbak et al. 2011). Constitutive stabilization of HIF-1α under normoxic conditions in NSPCs suggests that HIF-1α might play a role in regulating metabolism under both normoxic and hypoxic conditions. To test this hypothesis, we evaluated the metabolic phenotype of embryonic and adult NSPCs by assessing their relative dependence on glycolysis versus mitochondrial oxidative phosphorylation for survival. We then investigated the role of Hif1a gene expression on the maintenance of NSPC metabolic state, using a conditional, tamoxifen-inducible Cre-loxP approach to generate NSPCs that harbor bi-allelic deletion of exon 1 of the Hif1a gene. We demonstrate that NSPCs display a relatively low requirement for oxidative metabolism for their survival in culture, and show that this metabolic trait is independent of endogenous HIF-1α expression.
Materials and methods
Primary cell culture
This study was approved by the University of New Mexico Animal Care and Use Committee and conformed to the NIH Guidelines for use of animals in research. Timed pregnant female mice were euthanized by isoflurane overdose and the embryos removed by cesarean section.
Neural stem/progenitor cell cultures
Wild-type NSPCs were isolated from embryonic day 14.5 (E14.5) or post-natal day 51 (PD51) C57BL/6J mice (The Jackson Laboratory, Bar Harbor, ME, USA). Briefly, embryonic NSPCs (eNSPC) were established from whole telencephalon as previously described (Harms et al. 2010). Adult NSPCs (aNSPC) were established from microdissected SVZ of PD51 male C57BL/6J mice using described protocols in conjunction with the MACS Neural Tissue Dissociation Kit (Miltenyi Biotec, Auburn, CA, USA) (Roitbak et al. 2008). Following dissociation, NSPCs were plated in six-well tissue culture plates pre-coated with poly-L-lysine (BD Biosciences, San Diego, CA, USA). The cultures were maintained under serum-free conditions in Neurobasal medium (Invitrogen, Carlsbad, CA, USA) supplemented with B-27 supplement (2%; Invitrogen), glutamine (2.0 mM; Sigma, St Louis, MO, USA), penicillin (100 U/mL; Invitrogen), streptomycin (100 μg/mL; Invitrogen), epidermal growth factor (EGF; 10 ng/mL; Invitrogen), and basic fibroblast growth factor (bFGF; 20 ng/mL; Invitrogen). Growth factors (EGF and bFGF) were added every other day and cells were passaged two to eight times prior to use.
For experiments, NSPCs were subcultured on poly-L-lysine-coated glass coverslips within 24-well culture plates at a density of 3.125 × 10⁴ cells/cm2. We have previously shown that these cultures are uniformly nestin-positive and undergo spontaneous differentiation into neurons and glia after growth factor withdrawal (Roitbak et al. 2008; Harms et al. 2010).
Hif1a gene deletion using nestin-CreERT2/R26R-YFP/Hif1afl/fl mice
Nestin-CreERT2/R26R-YFP/Hif1afl/fl mice were generated by crossing the nestin-CreERT2/R26R-YFP transgenic line [generously provided by Dr. Amelia Eisch, UTSW Medical Center, Dallas, TX, USA; (Lagace et al. 2007)] with mice harboring floxed exon 1 of the Hif1a gene locus (Hif1afl/fl) [The Jackson Laboratory; (Ryan et al. 2000)], both on the C57BL/6J background. Offspring were bred to homozygosity at all three transgenes. To induce Cre-mediated recombination in nestin-positive embryonic NSPCs, tamoxifen was administered to nestin-CreERT2/R26R-YFP/Hif1awt/wt (control) or nestin-CreERT2/R26R-YFP/Hif1afl/fl timed-pregnant females at gestational day 10.5 (E10.5; 75 mg/kg tamox-ifen dissolved in 10% ethanol/90% sunflower oil; Sigma; 2 injections i.p. spaced 6 hours apart), as previously described (Battiste et al. 2007). Embryos were collected on E14.5 and NSPCs were isolated from embryonic telencephalon as described above. To induce Cre-mediated recombination in nestin-positive post-natal NSPCs, tamoxifen was administered to young adult nestin-CreERT2/R26R-YFP/Hif1awt/wt (control) or nestin-CreERT2/R26R-YFP/Hif1afl/fl male mice (post-natal day 41; 180 mg/kg tamoxifen per day, i.p., for 5 consecutive days). Five days following the final tamoxifen injection, the mice were killed by isoflurane overdose and NSPCs were isolated from the SVZ as described above. Following the second passage, YFP-positive NSPCs from both genotypes were isolated using flow cytometry (ex/em 488 nm/530 nm; Beckman Coulter Legacy MoFlo, Brea, CA, USA), plated and expanded for 1–2 more passages prior to use in experiments. Excision of Hif1a exon 1 was confirmed by PCR using DNA isolated from NSPCs (forward primer 5′-TGT TAA ATA AAA GCT TGG AC -3′ and reverse primer 5′-GCA GTT AAG AGC ACT AGT TG -3′) (Ryan et al. 2000; Harms et al. 2010). Successful DNA recombination yields Hif1a gene-deleted NSPCs (nestin-CreERT2/R26R-YFP/Hif1aΔ/Δ), as indicated by the loss of the 1200 bp band amplification product and appearance of a 250 bp band (Fig. 5a).
Fig. 5.

Deletion of hypoxia inducible factor-1alpha (Hif1a) does not alter the metabolic phenotype of embryonic neural stem/progenitor cells (NSPCs). (a) PCR of genomic DNA showing successful recombination between the loxP sites in the Hif1a gene from YFP+ nestin-CreERT2: R26R-YFP:Hif1aΔ/Δ eNSPCs (Hif1aΔ/Δ). (b–f) 24 h treatment of nestin-CreERT2:R26R-YFP:Hif1awt/wt (Hif1awt/wt) versus nestin-CreERT2: R26R-YFP:Hif1aΔ/Δ (Hif1aΔ/Δ) eNSPCs isolated from mice exposed to (b) anoxia, (c) CN (1 mM), (d) 6-AN (500 μM), (e) galactose (25 mM), or (f) 2-DG (10 mM) plus glucose (10 mM) and pyruvate (0.1–10.0 mM). Two-way ANOVA shows a significant difference between genotype (*p < 0.05) and concentration of pyruvate (**p < 0.01) for (f). n = 3 per treatment group.
Primary cortical neuron cultures
Primary neuronal cultures were established from cerebral cortices of C57BL/6J embryos on gestational day 15.5 (E15.5), using enzymatic dissociation with trypsin as previously described (Wetzel et al. 2008; Harms et al. 2010). For cell viability assays, 3.9 × 10⁵ dissociated cortical cells were plated on poly-L-lysine-coated coverslips (0.1 mg/mL; Sigma) in 24-well plates (2.0 × 10⁵ cells/cm2). For biochemical procedures, 1.95 × 10⁶ cells were plated on pre-coated poly-L-lysine six-well plates (2.0 × 10⁵ cells/cm2; BD Biosciences). The cultures were maintained under serum-free conditions in Neurobasal medium (Invitrogen, Carlsbad, CA, USA), supplemented with B-27 supplement (2%; Invitrogen), glutamine (0.5 mM; Sigma), glutamate (25 μM; Sigma), penicillin (100 U/mL), and streptomycin (100 μg/mL; Invitrogen). At 4 days in vitro, half of the medium was removed and replaced with fresh medium without glutamate. At 7 days in vitro, neuronal cultures were used for experimentation. All cultures were maintained in a humidified incubator at 37°C with 5% CO2.
Oxygen deprivation
For oxygen deprivation, primary NSPCs or cortical neuronal cultures were placed in an anaerobic chamber (Coy Laboratories, Grass Lake, MI, USA) containing a gas mixture of 5% CO2, 5% H2, and 90% N2 (< 0.2% O2) for 24 h. Normal culture media was replaced with deoxygenated culture media. Media was supplemented as described above for the appropriate cell type. Sister cultures placed at 37°C under normoxic (21% O2) conditions served as non-hypoxic negative controls. Cell viability was normalized to non-hypoxic controls in all experiments.
Pharmacological treatments
Neural stem/progenitor or neuronal cultures were exposed for 24 h to the following compounds dissolved in culture media: sodium cyanide (CN; 1.0 mM; Sigma); 6-aminonicotinamide (6-AN; 500 μM; Sigma) or vehicle control (dimethylsulfoxide; vol/vol; Sigma). For addition of the following compounds, NSPC or neuronal cultures were incubated in glucose- and pyruvate-free Neurobasal media (Invitrogen) supplemented as described above for the appropriate cell type: glucose (10 mM; Sigma) and pyruvate (0.1–10 mM; Sigma) with or without 2-deoxy-D-glucose (2-DG; 10 mM; Sigma); galactose (25 mM; Sigma) or glucose (25 mM).
Cell viability assay
Cell viability was assessed using the Calcein AM component of the Live/Dead Viability Cytotoxicity Kit for mammalian cells (Invitrogen). Cultured cells were washed twice with sterile Dulbecco’s Phosphate Buffered Saline (Invitrogen) before incubation in 3 μM Calcein AM for 45 min at 37°C in the presence or absence of oxygen (21%). Fluorescence was read at ex/em 494 nm/517 nm using background subtraction of fluorescence from cell-free wells containing Calcein AM. Viability was verified using meth-ylthiazolyldiphenyl-tetrazolium bromide dissolved in sterile Dulbecco’s Phosphate Buffered Saline (0.5 mg/mL; Sigma) as previously described (Harms et al. 2010) (data not shown).
Immunocytochemistry
Cultured cells were fixed on coverslips with 4% paraformaldehyde in 0.1 M sodium phosphate buffer and incubated in monoclonal mouse anti-NeuN (1: 200; Chemicon, Temecula, CA, USA), monoclonal mouse anti-Nestin (1: 500; Chemicon), and/or poly-clonal rabbit anti-Ki67 (1: 500; Leica, Buffalo Grove, IL, USA). Immunofluorescence was visualized using FITC- or Cy3-conjugated secondary antibodies (1: 250; Jackson ImmunoResearch Laboratories, West Grove, PA, USA). 4′,6-diamidino-2-pheylindole (DAPI) nuclear stain was used to identify cell bodies of cultured cells (300 nM; Invitrogen; not shown). To detect mitochondria, cells were incubated with Mito Tracker® Red CMXRos (200 nM; Invitrogen) before fixation. Fluorescence was visualized using high-resolution confocal microscopy (Zeiss LSM510, Thornwood, NY, USA) or conventional fluorescence microscopy.
Lactate dehydrogenase, lactate, and glucose colorimetric assays
For all colorimetric assays, NSPC or neuronal cultures were incubated in phenol red-free culture media for 24 h prior to assay measurements. Intracellular lactate dehydrogenase (LDH) activity was measured using the CytoTox96® Non-Radioactive Cytotoxicity Assay (Promega Corporation, Madison, WI, USA), according to the manufacturer’s protocol, and absorbance measured at 490 nm. Lactate concentration was measured in culture media using a colorimetric assay (BioVision, Mountain View, CA, USA), measuring absorbance at 570 nm. Lactate and LDH measurements were normalized to protein levels using the MicroBCA kit (Pierce, Rockford, IL, USA). Glucose was measured in fresh culture media and then again after incubation with cells in culture for 24 h (GAGO-20 kit; Sigma), according to the manufacturer’s protocol.
Transmission electron microscopy
Transmission electron microscopy was performed as described (Roitbak et al. 2011). Briefly, cells were post-fixed with 2% glutaraldehyde in 0.1 M phosphate buffer, osmicated in 0.5% OsO4 phosphate buffer, dehydrated and infiltrated with EmBed 812 (Electron Microscopy Sciences, Hatfield, PA, USA), polymerized at 60°C for 24 h, and stained with uranyl acetate. Digital images of 70 nm thin sections were acquired on a Hitachi H-7500 transmission electron microscope (Hitachi High-Technologies Science America, Inc., Northridge, CA, USA).
Statistical analyses
Data are expressed as means ± SEM. Significant differences between means were determined by student’s t-test or two-way ANOVA with Bonferroni multiple comparisons post hoc analysis using Prism software (Graphpad Software, San Diego, CA, USA). P-values < 0.05 are considered statistically significant.
Results
Embryonic NSPCs are resistant to anoxia and mitochondrial inhibition
To investigate the relative dependence of embryonic NSPCs (eNSPCs) on oxidative metabolism for survival, we first compared the viability of eNSPCs to that of embryonic cortical neurons following 24 h exposure to oxygen deprivation (< 0.2% O2). As shown in Fig. 1a, approximately 70% of eNSPCs survived 24 h anoxia, whereas only 27% of neurons survived. The morphology of neurons and eNSPCs under normoxic and anoxic conditions was visualized using immunofluorescence (Fig. 1b–e). To assess dependence on mitochondrial ATP synthesis for survival, we compared survival of neurons and eNSPCs following 24 h exposure to the mitochondrial toxin sodium cyanide (1.0 mM; CN), an inhibitor of cytochrome c oxidase (complex IV) activity. As shown in Fig. 2a, eNSPCs also displayed increased resistance to CN toxicity when compared with primary cortical neurons (82% vs. 55% survival, respectively, p < 0.001), further indicating a relatively low reliance on oxidative metabolism for NSPC survival. Adult NSPCs responded similarly to oxygen-deprivation and cyanide treatment (Figure S1).
Fig. 1.
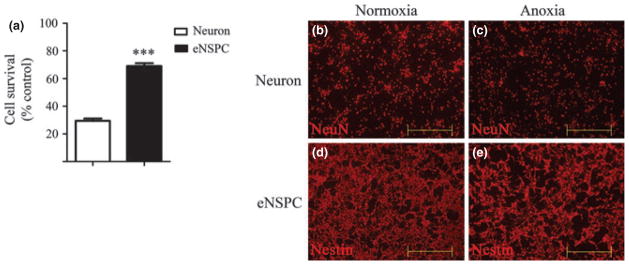
Embryonic neural stem/progenitor cells (NSPCs) are more resistant than neurons to 24 h anoxia. (a) Viability of oxygen-deprived (< 0.2% O2; 24 h) neurons and eNSPCs was measured using calcein AM fluorescence and compared as a percent of normoxic (21% O2) controls. (b–e) Micrographs imaged at 10 × of neurons (b, c) and eNSPCs (d, e) exposed to normoxic (b, d) or anoxic (c, e) conditions for 24 h. Neurons are labeled with NeuN (b, c); eNSPCs are labeled with nestin (d, e). Scale bar = 500 μm. n = 3 per treatment group. ***p < 0.001.
Fig. 2.

Embryonic neural stem/progenitor cells (NSPCs) are more resistant to cytochrome c oxidase inhibition but more susceptible to glycolytic and pentose phosphate pathway inhibition than neurons. (a) Viability of cyanide-exposed (1 mM; 24 h) neurons and eNSPCs as measured using calcein AM fluorescence and compared as a percent of untreated controls. (b) Neurons and eNSPCs were treated with 10 mM 2-deoxy-D-glucose (2-DG) and 10 mM glucose, in the presence of increasing concentrations of pyruvate (0.1–10 mM) for 24 h. Viability of neurons (open circles) and eNSPCs (closed circles) as compared as a percent of controls that were not treated with 2-DG. Two-way ANOVA shows a significant difference between cell type (p < 0.0001) and concentration of pyruvate (p < 0.001). (c) Viability of neurons and eNSPCs treated with 25 mM galactose as measured using calcein AM fluorescence and compared as a percent of glucose-treated (25 mM) controls. (d) Viability of neurons and eNSPCs exposed to 500 μM 6-AN for 24 h as compared to vehicle (dimethylsulfoxide) controls. n = 3 per treatment group. *p < 0.05. ***p < 0.001. ****p < 0.0001.
Neural stem/progenitor cells have a high glycolytic requirement compared to primary neurons
To explore the extent to which eNSPCs are reliant on the anaerobic glycolytic arm of glucose metabolism for energy production and survival, eNSPCs were grown for 24 h under conditions of glycolytic inhibition in the presence of the tricarboxylic acid (TCA) cycle substrate, pyruvate. 2-deoxy-D-glucose (2-DG; 10 mM) was added to glucose-containing media (10 mM) in the presence of pyruvate (0.1–10 mM). 2-deoxy-D-glucose is a competitive inhibitor of glycolysis (Pelicano et al. 2006), and pyruvate serves as an oxidation substrate for ATP synthesis through oxidative phosphorylation. Normally, pyruvate can rescue cells from glycolytic inhibition, depending on the cell’s ability to utilize oxidative phosphorylation for ATP production. As shown in Fig. 2b, incubation with 0.1 mM pyruvate rescued approximately 80% of cortical neurons from glucose deprivation, but was not sufficient to support the survival of eNSPCs. When the concentration of pyruvate was increased to doses of 1 mM and 10 mM, neuronal survival increased in a dose-dependent manner, whereas eNSPC viability remained drastically low (Fig. 2b). Adult NSPC viability was also impaired with pyruvate replacement of glucose (1 mM; Figure S1).
To further probe for the requirement of glycolysis, we assessed NSPC and neuronal viability following 24 h incubation in media containing galactose instead of glucose. Galactose enters the glycolytic pathway at the same level as glucose, but results in no net ATP synthesis via glycolysis and thereby forces use of alternative substrates, such as glutamine, as an energy source for mitochondrial metabolism. This scenario also leaves the pentose phosphate pathway intact (Weinberg and Chandel 2009). As shown in Fig. 2c, viability of primary cortical neurons was unaffected by galactose substitution. Although eNSPC viability was more impaired compared with primary neurons, viability was only reduced by approximately 23% when galactose was substituted for glucose in the culture media. These data suggest that the high glycolytic requirement of eNSPCs is not due entirely to the need for anaerobic glycolytic ATP production.
Whereas our cultured neurons are post-mitotic and express the neuronal marker NeuN (Harms et al. 2010), neural progenitor cells proliferate in culture and undergo continual mitosis as visualized using the cell cycle marker Ki67 (Figure S2). Previous studies have shown that proliferating cells have a relatively high glucose requirement because of high pentose phosphate pathway (PPP) activity (Vander Heiden et al. 2009; Lunt and Vander Heiden 2011). To test the relative dependence of eNSPCs on the PPP, we incubated cells with 6-aminonicotinamide (6-AN; 500 μM; Fig. 2d) in the presence of glucose (25 mM). 6-AN blocks entry of glucose-6-phosphate into the PPP by inhibiting 6-phospho-gluconate dehydrogenase, but does not affect anaerobic glycolytic ATP synthesis. Following 24 h incubation with 500 μM 6-AN, eNSPC survival was considerably impaired (by approximately 60%), whereas the survival of cortical neurons was narrowly affected. Adult NSPC viability was also impaired in the presence of 6-AN (500 μM; Figure S1). The low dose 6-AN toxicity suggests that eNSPCs require the PPP for survival and/or continued proliferation.
Lactate production, LDH activity, and glucose consumption are up-regulated in eNSPC cultures
A high rate of anaerobic glycolytic flux is associated with increased conversion of pyruvate into lactate. Cells with high glycolytic flux generally display high enzymatic activity of LDH. As an additional assessment of eNSPC glycolytic state under normoxic conditions, we measured lactate concentration within media conditioned by eNSPCs versus neurons and also measured intracellular LDH activity. As shown in Fig. 3a and b, lactate production and LDH activity were increased by 1.5- and 2-fold in eNSPCs compared to those of primary cortical neurons, respectively, when cultured under normoxic conditions. To assess changes in glucose consumption in eNSPCs compared to neurons, we measured glucose levels in initially prepared media and that which was conditioned by both cell types. Glucose consumption from the initial media was elevated by approximately 4.4-fold in eNSPC cultures compared to neuronal cultures (7.51 ± 0.83% vs. 1.71 ± 0.86%, eNSPCs vs. neurons, respectively; Fig. 3c). These data are consistent with a higher rate of glycolytic flux in eNSPCs under normoxic conditions.
Fig. 3.

Embryonic neural stem/progenitor cell (NSPC) cultures display elevated lactate production, lactate dehydrogenase (LDH) activity, and glucose consumption compared with neuronal cultures. Cells were cultured in phenol-free growth medium for 24 h. (a) Lactate concentration as measured in incubated media of neurons versus eNSPCs. (b) Intracellular lactate dehydrogenase (LDH) activity as measured in neurons versus eNSPCs. (c) Glucose consumption by cultured neurons versus eNSPCs. The amount of glucose was measured in initial culture media (control) and compared to the amount of glucose in conditioned media following 24 h incubation with neurons versus eNSPCs. n = 4 per treatment group. *p < 0.05. **p < 0.01. ****p < 0.0001.
Structural integrity of mitochondria
Mitochondria within some types of somatic stem cells display immature structural features (e.g., spherical mitochondria with underdeveloped cristae), which has been linked to low mitochondrial oxidative phosphorylation (Chung et al. 2007). Many studies have found that low oxygen consumption in various stem cell populations is associated with additional aspects of low mitochondrial function, including decreased mitochondrial number, decreased mitochondrial maturation, and/or reduced synthesis of electron transport proteins (Takubo et al. 2010; Takubo and Suda 2012; Zhou et al. 2012). It has recently been described that NSPCs isolated from the SVZ of aged mice display decreased mitochondrial content and lower oxidative metabolism than that of young mice (Stoll et al. 2011).
To determine whether eNSPCs in our studies harbor functional mitochondria, cells were stained using MitoTracker® Red (Invitrogen) which accumulates in active mitochondria. As shown in Fig. 4a, eNSPCs are fluorescently labeled with MitoTracker Red®. Furthermore, transmission electron microscopy revealed elongated mitochondria within eNSPCs with typical cristae structure (Fig. 4b). NSPC mitochondrial ultrastructure can be compared to that of cortical neurons published in a recent report (Robert et al. 2012). These data do not reveal apparent morphological evidence to indicate impaired mitochondrial function.
Fig. 4.

Embryonic neural stem/progenitor cells (NSPCs) display mature mitochondria. (a) Micrograph of eNSPCs stained with MitoTracker® Red reveals the presence of mitochondria (60 ×). Scale bar = 20 μm. (b) Mitochondrial morphology as viewed by transmission electron microscopy. Scale bar = 250 nm.
Deletion of Hif1a improves the ability of eNSPCs to utilize pyruvate during glycolytic inhibition, but does not render eNSPCs susceptible to prolonged hypoxia
HIF-1α is known to promote a glycolytic metabolic state through HIF-1-mediated up-regulation of glycolytic enzymes and down-regulation of enzymes that drive use of mitochon-drial metabolism (Semenza 2011). To explore whether the metabolic phenotype we observed for NSPCs is regulated by HIF-1α, we isolated NSPCs from nestin-CreERT2:R26R-YFP: Hif1awt/wt and nestin-CreERT2:R26R-YFP:Hif1aΔ/Δ embryonic mice (see Methods section). No significant difference was observed between eNSPCs isolated from nestin-CreERT2: R26R-YFP:Hif1awt/wt versus nestin-CreERT2:R26R-YFP: Hif1aΔ/Δ when cells were treated for 24 h with: anoxia (< 0.2% O2; Fig. 5b), cyanide (1 mM; Fig. 5c), 6-AN (500 μM; Fig. 5d), or galactose (25 mM; Fig. 5e). However, wheneNSPCs were treated with 2-DG (10 mM; in the presence of 10 mM glucose), nestin-CreERT2:R26R-YFP:Hif1aΔ/Δ eNSPCs displayed a 2-fold higher survival in the presence of 0.1 mM pyruvate than nestin-CreERT2:R26R-YFP: Hif1awt/wt eNSPCs (Fig. 5f). These experiments were repeated in NSPCs isolated from adult brain (Figure S3). We found that Hif1a gene deletion does not alter adult NSPC viability, as seen for the embryonic cells, and adult NSPCs remain insensitive to pyruvate replacement of glucose. These data suggest that HIF-1α expression does not underlie the ability of NSPCs to withstand prolonged hypoxia, and only moderately improves pyruvate utilization under conditions of glycolytic inhibition.
To determine whether the loss of HIF-1α is compensated for by its paralog HIF-2α, we measured HIF-2α protein levels in nestin-CreERT2:R26R-YFP:Hif1awt/wt versus nestin-CreERT2:R26R-YFP:Hif1aΔ/Δ cultured eNSPCs. Because HIF-2α has been shown to play a functional role in malignant glioma (Li et al. 2009; Zhou et al. 2011), we compared HIF-2α protein expression to that of the U87 malignant glioma line. We found that HIF-2α protein levels in our eNSPCs are dramatically lower than that of glioma cells, and do not increase when Hif1a is deleted (Figure S4).
Discussion
This study demonstrates robust survival of NSPCs under conditions of anoxia and mitochondrial inhibition, with increased importance of glycolysis for survival compared to primary cortical neurons. Interestingly, the high requirement for glycolysis in NSPCs appears linked to reliance on the PPP for meeting metabolic needs, and not entirely for the production of aerobic glycolytic ATP. Using an inducible Cre/loxP approach, we also show that sustained deletion of exon 1 of the Hif1a gene within undifferentiated NSPCs moderately increases mitochondrial pyruvate utilization, but has no effect on other parameters of metabolism that were tested here, including the ability of NSPCs to withstand prolonged anoxia. Taken together, these data not only confirm that cultured NSPCs have a relatively low requirement for oxidative metabolism for their survival but also demonstrate that this phenotypic trait is not dependent upon HIF-1α signaling under our culture conditions.
Low oxidative metabolism in NSPCs might be linked to hypoxic niche environments in vivo. It has recently been reported that tissue O2 in adult mouse hippocampal dentate SGZ under non-pathological conditions is less than 1.3%, suggesting a low O2 NSPC niche environment (Mazumdar et al. 2010). Similarly, embryonic NSPCs exist in a low oxygen environment in utero, where the fetal cortex has an estimated tissue O2 of ~1.3% (Bishai et al. 2003). Although the adult SVZ is highly vascularized, cellular oxygen levels within the SVZ have been estimated to be only ~2.5–3.0% under non-pathological conditions (Santilli et al. 2010), and fall to < 1.3% following focal cerebral ischemia of middle cerebral artery in rat (Thored et al. 2007). Cultured NSPCs from both rodent and human have been shown to survive best when maintained under reduced oxygen tensions, with enhanced proliferation and decreased cell death under conditions of physiological oxygen tensions, that is, 3–5% O2 (Studer et al. 2000; Pistollato et al. 2007; Panchision 2009). Our results demonstrate that NSPCs display robust survival even under conditions of pathological hypoxia (< 0.1% O2) and under conditions of mitochondrial inhibition, but not under conditions of impaired glycolysis. Our results are in agreement with a previous report where it was demonstrated that NSPCs from adult brain withstand 24 h of anoxia, but not conditions of glycolytic inhibition in the presence of pyruvate (Burgers et al. 2008), and also with a more recent report of decreased oxygen metabolism and mitochondrial function in NSPCs isolated from aging brain (Stoll et al. 2011).
Although NSPCs are capable of withstanding anoxia, they display poor survival under conditions of glycolytic inhibition, even in the presence of pyruvate and ample oxygen. The glycolytic requirement of NSPCs does not appear to be entirely because of their need for glycolytic ATP production, but rather because of their dependence on glycolytic intermediates to meet metabolic needs. For example, we found that NSPCs grown in galactose medium display impaired viability compared to neuronal cultures, but only by 20–25%. Since conversion of galactose to pyruvate via glycolysis yields no net ATP, it appears that NSPCs are capable of utilizing mitochondrial oxidative phosphorylation sufficient to meet most of their ATP demand if required to do so. One difference between glycolytic inhibition with 2-DG (which leads to 60–100% loss of viability) and growth in galactose medium (which leads to 20–25% loss in viability) is that galactose enters glycolysis at glucose-6-phosphate and thereby leaves the PPP intact, but its metabolism does not produce a net increase in glycolytic ATP production, whereas 2-DG inhibition of glycolysis impairs both PPP and glycolytic ATP production. A major function of high glycolytic rate under conditions of normoxia within proliferating cells is to support macromolecular synthesis and other anabolic processes [reviewed in (Lunt and Vander Heiden 2011)]. A high rate of glycolytic flux in NSPCs is also suggested by their relatively high LDH activity, lactate production, and glucose consumption compared with cortical cultures, where the glucose consumption of eNSPCs was similar to what has been described in glycolytic cancer cells with a similar amount of lactate production (Zhou et al. 2011). Shunting of pyruvate into lactate generates NAD+ required for continued glycolysis (Lunt and Vander Heiden 2011). Thus, it appears that NSPCs may be capable of utilizing mitochondrial oxidative phosphorylation sufficient to meet most of their ATP demand if required to do so, but complete glycolytic inhibition is further detrimental because of the need for glycolytic intermediates to support anabolic processes.
A caveat to the presented experiments is that both neurons and NSPCs were cultured in media containing 25 mM glucose, the concentration of glucose usually used in Dulbecco’s modified Eagle’s medium and Neurobasal medium (Brewer 1995). However, blood glucose levels in vivo range from 8 mM in the human (MacKay 1932) to 10 mM in the rat (Sun et al. 2003). High glucose levels in cultured cells may contribute to the Crabtree effect, where cells shift ATP production away from the electron transport chain toward glycolysis because of the presence of excess substrate (Frezza and Gottlieb 2009). However, neurons require 25 mM glucose to survive in culture (Russell et al. 2002), and appeared to maintain oxidative metabolism in our studies. Future studies to determine whether NSPCs succumb to the Crabtree effect could be resolved by testing the metabolic phenotype of NSPCs under lower concentrations of glucose. Regardless, our studies show that when neurons and NSPCs are cultured using the same concentration of glucose their metabolic phenotypes differ.
It was somewhat surprising that HIF-1α does not appear to be the primary metabolic regulator of glycolytic and oxidative metabolism within NSPCs under standard culture conditions. Many studies have linked HIF-1α regulation of metabolic state to pluripotency in various stem cell populations, including human embryonic stem cells (hESCs) and bone marrow hematopoietic stem cells (HSCs). For example, hESCs are almost exclusively glycolytic, even when cultured in the presence of ample oxygen (Zhou et al. 2012). The restricted oxidative capacity in hESCs has been attributed to low numbers of mitochondria and to suppressed activity of mitochondrial complex IV cytochrome c oxidase linked to constitutively high HIF-1α expression (Zhou et al. 2012). Similarly, primitive HSCs freshly isolated from bone marrow utilize glycolysis instead of mitochondrial oxidative phos-phorylation to meet their energy demand, and can be isolated by flow cytometry based solely on their low mitochondrial potential (Simsek et al. 2010). These primitive HSCs are primed for hypoxic resistance and express high levels of HIF-1α (Simsek et al. 2010). Selective and inducible deletion of exon-1 of the Hif1a gene in the HSC population in vivo results in loss of the quiescent HSC population and loss in the ability of these cells to repopulate recipient bone marrow following serial transplantation (Takubo et al. 2010).
Although our results suggest that HIF-1α expression is not linked to metabolic phenotype of cultured NSPCs, this does not necessarily imply that Hif1a gene expression is not important for metabolic phenotype and maintenance of the stem cell population in vivo. We previously demonstrated constitutive Hif1a gene expression within the nestin-positive NSPCs of adult SVZ and SGZ in vivo (Roitbak et al. 2011). Further, inducible Hif1a gene deletion in adult nestin-CreERT2/R26R-YFP/Hif1afl/fl mice depletes primitive neural stem cells and downstream transient amplifying progenitors within the SVZ, although this may be secondary to regression of SVZ vasculature and/or impairment of other intracellular signaling mechanisms (Cunningham, unpublished observations). Similarly, it has recently been reported that Hif1a gene deletion in adult CNS impairs hippocampal neurogenesis, mediated through impairment of Wnt/β-catenin signaling rather than via regulation of metabolic phenotype (Mazumdar et al. 2010).
Maintenance of NSPCs under high growth factor stimulation in culture, as done here, might override normal HIF-1α signaling. For example, growth factor signaling, tyrosine kinase activity, and PI3K/Akt activity have been shown to up-regulate the glycolytic phenotype through modulation of glycolytic enzymes, as well as stimulation of glucose uptake and utilization (Vander Heiden et al. 2009). EGF stimulates cultured NSPCs to proliferate, and selects for rapidly proliferating transient amplifying progenitor cells and not the quiescent primitive stem cell population that maintains the NSPC pool in vivo (Pastrana et al. 2011). Growth factors also promote glycolysis and lactate production by signaling through PI3K/Akt to up-regulate protein synthesis via mTOR of glucose transporters and glycolytic enzymes independent of HIF-1α signaling (DeBerardinis et al. 2008).
In summary, our findings indicate a high innate resistance of NSPCs to anoxic conditions in culture that does not require HIF-1α signaling. Hif1a gene deletion within NSPCs also did not stimulate a major shift from glycolytic dependence and therefore is unlikely to regulate this metabolic phenotype. Future studies will be required to elucidate the role of HIF-1α on metabolic signaling within NSPCs in situ, particularly with respect to their ability to withstand metabolic injury and mount regenerative responses that promote functional recovery.
Supplementary Material
Acknowledgments
This study was supported by the American Heart Association (0810071Z and 09GRNT2290178) and by a Graduate Research Development grant from the University of New Mexico Graduate and Professional Society made possible by the State of New Mexico legislature. Confocal images were generated using the University of New Mexico Cancer Center Fluorescence Microscopy Facility, supported as detailed at http://hsc.unm.edu/crtc/microscopy/index.shtml. Transmission electron microscopy images were generated in the Electron Microscopy Facility at the University of New Mexico Health Sciences Center by Tamara Howard. The authors thank Dr. Tamara Roitbak for the electron microscopy preparation and Kelsey Thomas for outstanding technical assistance. Experiments were conceived, designed, and interpreted by KMC, CWS, and LAC. Experiments were performed and data were acquired by KMC. The article was drafted by KMC and LAC, and critically revised by KMC, CWS, and LAC. The final version of the manuscript was approved by KMC, CWS, and LAC.
Abbreviation used
- HIF-1α
hypoxia inducible factor-1alpha
- HSCs
hematopoietic stem cells
- NSPCs
neural stem/progenitor cells
- PPP
pentose phosphate pathway
- SGZ
subgranular zone
- SVZ
subventricular zone
Footnotes
The authors of this manuscript declare no conflict of interest.
Additional supporting information may be found in the online version of this article at the publisher’s web-site.
Figure S1. Adult NSPCs display a similar metabolic phenotype as embryonic NSPCs.
Figure S2. NSPCs are immunopositive for the cell cycle marker Ki67.
Figure S3. Deletion of Hif1a does not alter the metabolic phenotype of adult NSPCs.
Figure S4. Deletion of Hif1a does not alter protein expression of HIF-2α.
References
- Arvidsson A, Collin T, Kirik D, Kokaia Z, Lindvall O. Neuronal replacement from endogenous precursors in the adult brain after stroke. Nat Med. 2002;8:963–970. doi: 10.1038/nm747. [DOI] [PubMed] [Google Scholar]
- Battiste J, Helms AW, Kim EJ, Savage TK, Lagace DC, Mandyam CD, Eisch AJ, Miyoshi G, Johnson JE. Ascl1 defines sequentially generated lineage-restricted neuronal and oligodendrocyte precursor cells in the spinal cord. Development. 2007;134:285–293. doi: 10.1242/dev.02727. [DOI] [PubMed] [Google Scholar]
- Bishai JM, Blood AB, Hunter CJ, Longo LD, Power GG. Fetal lamb cerebral blood flow (CBF) and oxygen tensions during hypoxia: a comparison of laser Doppler and microsphere measurements of CBF. J Physiol. 2003;546:869–878. doi: 10.1113/jphysiol.2002.025270. [DOI] [PMC free article] [PubMed] [Google Scholar]
- Brewer GJ. Serum-free B27/neurobasal medium supports differentiated growth of neurons from the striatum, substantia nigra, septum, cerebral cortex, cerebellum, and dentate gyrus. J Neurosci Res. 1995;42:674–683. doi: 10.1002/jnr.490420510. [DOI] [PubMed] [Google Scholar]
- Burgers HF, Schelshorn DW, Wagner W, Kuschinsky W, Maurer MH. Acute anoxia stimulates proliferation in adult neural stem cells from the rat brain. Exp Brain Res. 2008;188:33–43. doi: 10.1007/s00221-008-1336-6. [DOI] [PubMed] [Google Scholar]
- Chung S, Dzeja PP, Faustino RS, Perez-Terzic C, Behfar A, Terzic A. Mitochondrial oxidative metabolism is required for the cardiac differentiation of stem cells. Nat Clin Pract Cardiovasc Med. 2007;4(Suppl 1):S60–S67. doi: 10.1038/ncpcardio0766. [DOI] [PMC free article] [PubMed] [Google Scholar]
- DeBerardinis RJ, Lum JJ, Hatzivassiliou G, Thompson CB. The biology of cancer: metabolic reprogramming fuels cell growth and proliferation. Cell Metab. 2008;7:11–20. doi: 10.1016/j.cmet.2007.10.002. [DOI] [PubMed] [Google Scholar]
- Doetsch F. The glial identity of neural stem cells. Nat Neurosci. 2003a;6:1127–1134. doi: 10.1038/nn1144. [DOI] [PubMed] [Google Scholar]
- Doetsch F. A niche for adult neural stem cells. Curr Opin Genet Dev. 2003b;13:543–550. doi: 10.1016/j.gde.2003.08.012. [DOI] [PubMed] [Google Scholar]
- Frezza C, Gottlieb E. Mitochondria in cancer: not just innocent bystanders. Semin Cancer Biol. 2009;19:4–11. doi: 10.1016/j.semcancer.2008.11.008. [DOI] [PubMed] [Google Scholar]
- Gage FH. Mammalian neural stem cells. Science. 2000;287:1433–1438. doi: 10.1126/science.287.5457.1433. [DOI] [PubMed] [Google Scholar]
- Germano I, Swiss V, Casaccia P. Primary brain tumors, neural stem cell, and brain tumor cancer cells: where is the link? Neuropharmacology. 2010;58:903–910. doi: 10.1016/j.neuropharm.2009.12.019. [DOI] [PMC free article] [PubMed] [Google Scholar]
- Harms KM, Li L, Cunningham LA. Murine neural stem/progenitor cells protect neurons against ischemia by HIF-1alpha-regulated VEGF signaling. PLoS ONE. 2010;5:e9767. doi: 10.1371/journal.pone.0009767. [DOI] [PMC free article] [PubMed] [Google Scholar]
- Kriegstein A, Alvarez-Buylla A. The glial nature of embryonic and adult neural stem cells. Annu Rev Neurosci. 2009;32:149–184. doi: 10.1146/annurev.neuro.051508.135600. [DOI] [PMC free article] [PubMed] [Google Scholar]
- Lagace DC, Whitman MC, Noonan MA, et al. Dynamic contribution of nestin-expressing stem cells to adult neurogenesis. J Neurosci. 2007;27:12623–12629. doi: 10.1523/JNEUROSCI.3812-07.2007. [DOI] [PMC free article] [PubMed] [Google Scholar]
- Li Z, Bao S, Wu Q, et al. Hypoxia-inducible factors regulate tumorigenic capacity of glioma stem cells. Cancer Cell. 2009;15:501–513. doi: 10.1016/j.ccr.2009.03.018. [DOI] [PMC free article] [PubMed] [Google Scholar]
- Li L, Harms KM, Ventura PB, Lagace DC, Eisch AJ, Cunningham LA. Focal cerebral ischemia induces a multilineage cytogenic response from adult subventricular zone that is predominantly gliogenic. Glia. 2010;58:1610–1619. doi: 10.1002/glia.21033. [DOI] [PMC free article] [PubMed] [Google Scholar]
- Lichtenwalner RJ, Parent JM. Adult neurogenesis and the ischemic forebrain. J Cereb Blood Flow Metab. 2006;26:1–20. doi: 10.1038/sj.jcbfm.9600170. [DOI] [PubMed] [Google Scholar]
- Lunt SY, Vander Heiden MG. Aerobic glycolysis: meeting the metabolic requirements of cell proliferation. Annu Rev Cell Dev Biol. 2011;27:441–464. doi: 10.1146/annurev-cellbio-092910-154237. [DOI] [PubMed] [Google Scholar]
- MacKay EM. The distribution of glucose in human blood. J Biol Chem. 1932;97:685–689. [Google Scholar]
- Mazumdar J, O’Brien WT, Johnson RS, LaManna JC, Chavez JC, Klein PS, Simon MC. O2 regulates stem cells through Wnt/beta-catenin signalling. Nat Cell Biol. 2010;12:1007–1013. doi: 10.1038/ncb2102. [DOI] [PMC free article] [PubMed] [Google Scholar]
- Mohyeldin A, Garzon-Muvdi T, Quinones-Hinojosa A. Oxygen in stem cell biology: a critical component of the stem cell niche. Cell Stem Cell. 2010;7:150–161. doi: 10.1016/j.stem.2010.07.007. [DOI] [PubMed] [Google Scholar]
- Morrison SJ, Csete M, Groves AK, Melega W, Wold B, Anderson DJ. Culture in reduced levels of oxygen promotes clonogenic sympathoadrenal differentiation by isolated neural crest stem cells. J Neurosci. 2000;20:7370–7376. doi: 10.1523/JNEUROSCI.20-19-07370.2000. [DOI] [PMC free article] [PubMed] [Google Scholar]
- Panchision DM. The role of oxygen in regulating neural stem cells in development and disease. J Cell Physiol. 2009;220:562–568. doi: 10.1002/jcp.21812. [DOI] [PubMed] [Google Scholar]
- Pastrana E, Silva-Vargas V, Doetsch F. Eyes wide open: a critical review of sphere-formation as an assay for stem cells. Cell Stem Cell. 2011;8:486–498. doi: 10.1016/j.stem.2011.04.007. [DOI] [PMC free article] [PubMed] [Google Scholar]
- Pelicano H, Martin DS, Xu RH, Huang P. Glycolysis inhibition for anticancer treatment. Oncogene. 2006;25:4633–4646. doi: 10.1038/sj.onc.1209597. [DOI] [PubMed] [Google Scholar]
- Pistollato F, Chen HL, Schwartz PH, Basso G, Panchision DM. Oxygen tension controls the expansion of human CNS precursors and the generation of astrocytes and oligodendrocytes. Mol Cell Neurosci. 2007;35:424–435. doi: 10.1016/j.mcn.2007.04.003. [DOI] [PubMed] [Google Scholar]
- Robert F, Cloix JF, Hevor T. Ultrastructural characterization of rat neurons in primary culture. Neuroscience. 2012;200:248–260. doi: 10.1016/j.neuroscience.2011.10.002. [DOI] [PubMed] [Google Scholar]
- Roitbak T, Li L, Cunningham LA. Neural stem/progenitor cells promote endothelial cell morphogenesis and protect endothelial cells against ischemia via HIF-1alpha-regulated VEGF signaling. J Cereb Blood Flow Metab. 2008;28:1530–1542. doi: 10.1038/jcbfm.2008.38. [DOI] [PMC free article] [PubMed] [Google Scholar]
- Roitbak T, Surviladze Z, Cunningham LA. Continuous expression of HIF-1alpha in neural stem/progenitor cells. Cell Mol Neurobiol. 2011;31:119–133. doi: 10.1007/s10571-010-9561-5. [DOI] [PMC free article] [PubMed] [Google Scholar]
- Russell JW, Golovoy D, Vincent AM, Mahendru P, Olzmann JA, Mentzer A, Feldman EL. High glucose-induced oxidative stress and mitochondrial dysfunction in neurons. FASEB J. 2002;16:1738–1748. doi: 10.1096/fj.01-1027com. [DOI] [PubMed] [Google Scholar]
- Ryan HE, Poloni M, McNulty W, Elson D, Gassmann M, Arbeit JM, Johnson RS. Hypoxia-inducible factor-1alpha is a positive factor in solid tumor growth. Cancer Res. 2000;60:4010–4015. [PubMed] [Google Scholar]
- Santilli G, Lamorte G, Carlessi L, Ferrari D, Rota Nodari L, Binda E, Delia D, Vescovi AL, De Filippis L. Mild hypoxia enhances proliferation and multipotency of human neural stem cells. PLoS ONE. 2010;5:e8575. doi: 10.1371/journal.pone.0008575. [DOI] [PMC free article] [PubMed] [Google Scholar]
- Semenza GL. Regulation of metabolism by hypoxia-inducible factor 1. Cold Spring Harb Symp Quant Biol. 2011;76:347–353. doi: 10.1101/sqb.2011.76.010678. [DOI] [PubMed] [Google Scholar]
- Semenza GL. Hypoxia-inducible factors in physiology and medicine. Cell. 2012;148:399–408. doi: 10.1016/j.cell.2012.01.021. [DOI] [PMC free article] [PubMed] [Google Scholar]
- Simsek T, Kocabas F, Zheng J, Deberardinis RJ, Mahmoud AI, Olson EN, Schneider JW, Zhang CC, Sadek HA. The distinct metabolic profile of hematopoietic stem cells reflects their location in a hypoxic niche. Cell Stem Cell. 2010;7:380–390. doi: 10.1016/j.stem.2010.07.011. [DOI] [PMC free article] [PubMed] [Google Scholar]
- Stoll EA, Cheung W, Mikheev AM, Sweet IR, Bielas JH, Zhang J, Rostomily RC, Horner PJ. Aging neural progenitor cells have decreased mitochondrial content and lower oxidative metabolism. J Biol Chem. 2011;286:38592–38601. doi: 10.1074/jbc.M111.252171. [DOI] [PMC free article] [PubMed] [Google Scholar]
- Studer L, Csete M, Lee SH, Kabbani N, Walikonis J, Wold B, McKay R. Enhanced proliferation, survival, and dopaminergic differentiation of CNS precursors in lowered oxygen. J Neurosci. 2000;20:7377–7383. doi: 10.1523/JNEUROSCI.20-19-07377.2000. [DOI] [PMC free article] [PubMed] [Google Scholar]
- Sun Y, Jin K, Xie L, Childs J, Mao XO, Logvinova A, Greenberg DA. VEGF-induced neuroprotection, neurogenesis, and angiogenesis after focal cerebral ischemia. J Clin Invest. 2003;111:1843–1851. doi: 10.1172/JCI17977. [DOI] [PMC free article] [PubMed] [Google Scholar]
- Takubo K, Suda T. Roles of the hypoxia response system in hematopoietic and leukemic stem cells. Int J Hematol. 2012;95:478–483. doi: 10.1007/s12185-012-1071-4. [DOI] [PubMed] [Google Scholar]
- Takubo K, Goda N, Yamada W, et al. Regulation of the HIF-1alpha level is essential for hematopoietic stem cells. Cell Stem Cell. 2010;7:391–402. doi: 10.1016/j.stem.2010.06.020. [DOI] [PubMed] [Google Scholar]
- Thored P, Arvidsson A, Cacci E, Ahlenius H, Kallur T, Darsalia V, Ekdahl CT, Kokaia Z, Lindvall O. Persistent production of neurons from adult brain stem cells during recovery after stroke. Stem Cells. 2006;24:739–747. doi: 10.1634/stemcells.2005-0281. [DOI] [PubMed] [Google Scholar]
- Thored P, Wood J, Arvidsson A, Cammenga J, Kokaia Z, Lindvall O. Long-term neuroblast migration along blood vessels in an area with transient angiogenesis and increased vascularization after stroke. Stroke. 2007;38:3032–3039. doi: 10.1161/STROKEAHA.107.488445. [DOI] [PubMed] [Google Scholar]
- Vander Heiden MG, Cantley LC, Thompson CB. Understanding the Warburg effect: the metabolic requirements of cell proliferation. Science. 2009;324:1029–1033. doi: 10.1126/science.1160809. [DOI] [PMC free article] [PubMed] [Google Scholar]
- Weinberg F, Chandel NS. Mitochondrial metabolism and cancer. Ann N Y Acad Sci. 2009;1177:66–73. doi: 10.1111/j.1749-6632.2009.05039.x. [DOI] [PubMed] [Google Scholar]
- Wetzel M, Li L, Harms KM, Roitbak T, Ventura PB, Rosenberg GA, Khokha R, Cunningham LA. Tissue inhibitor of metalloproteinases-3 facilitates Fas-mediated neuronal cell death following mild ischemia. Cell Death Differ. 2008;15:143–151. doi: 10.1038/sj.cdd.4402246. [DOI] [PubMed] [Google Scholar]
- Yang Z, You Y, Levison SW. Neonatal hypoxic/ischemic brain injury induces production of calretinin-expressing interneurons in the striatum. J Comp Neurol. 2008;511:19–33. doi: 10.1002/cne.21819. [DOI] [PMC free article] [PubMed] [Google Scholar]
- Zhou Y, Shingu T, Feng L, Chen Z, Ogasawara M, Keating MJ, Kondo S, Huang P. Metabolic alterations in highly tumorigenic glioblastoma cells: preference for hypoxia and high dependency on glycolysis. J Biol Chem. 2011;286:32843–32853. doi: 10.1074/jbc.M111.260935. [DOI] [PMC free article] [PubMed] [Google Scholar]
- Zhou W, Choi M, Margineantu D, et al. HIF1alpha induced switch from bivalent to exclusively glycolytic metabolism during ESC-to-EpiSC/hESC transition. EMBO J. 2012;31:2103–2116. doi: 10.1038/emboj.2012.71. [DOI] [PMC free article] [PubMed] [Google Scholar]
Associated Data
This section collects any data citations, data availability statements, or supplementary materials included in this article.