

Abstract
Background and Aims
Proteins containing the SPX (SYG1/Pho81/XPR1) domain are vital components in the phosphorus (P) signalling pathway, and regulate phosphate (Pi) homeostasis in plants. However, the characteristics and functions of GmSPX members in soybean (Glycine max) remain largely unknown.
Methods
BLAST searching revealed nine GmSPX members in the soybean genome. Subsequently, expression patterns of GmSPX members were investigated in various tissues of soybean grown in nutrient solution or sand culture through quantitative real-time PCR (qPCR) analysis. Sub-cellular localization of GmSPX was examined via transient expression of 35S:GmSPX-GFP in epidermal cells of onion (Allium cepa). Finally, soybean transgenic composite plants were generated to study GmSPX3 functions.
Key Results
Nine GmSPX members were identified, which were classified into three groups based on phylogenetic analysis. Diverse responses of GmSPX members to deficiencies of nutrients (nitrogen, phosphorus, potassium and iron) or inoculation of arbuscular mycorrhizal fungi and rhizobia were observed in soybean. In addition, variations of sub-cellular localization of GmSPX members were found. Among them, GmSPX3, GmSPX7 and GmSPX8 were localized in the nuclei, and the other GmSPX members were confined to the nuclei and cytoplasm. The nuclear-localized and Pi starvation responsive-gene, GmSPX3, was functionally analysed in soybean transgenic composite plants. Overexpression of GmSPX3 led to increased P concentrations in both shoots and roots in the high-P treatment, and increased transcription of seven Pi starvation-responsive genes in soybean hairy roots.
Conclusions
Taken together, the results suggest that GmSPX3 is a positive regulator in the P signalling network, and controls Pi homeostasis in soybean.
Keywords: Expression pattern, phosphate starvation, Pi homeostasis, phosporus signalling, soybean, Glycine max, SPX domain, GmSPX members
INTRODUCTION
Phosphorus (P) is a macronutrient and major constituent in plant cells that participates in multiple physiological and biochemical processes. However, available P is commonly limited in soils because P is easily fixed by soil particles into unavailable forms (Vance et al., 2003; Richardson et al., 2009). As a result, low P is often a major limitation for crop growth, especially in tropical and sub-tropical regions where P fixation occurs widely (Graham and Vance, 2000; Hardarson and Atkins, 2003). Although application of P fertilizers helps plants to cope with soil P deficiency, it is a partial solution, because >80 % of applied P fertilizers are wasted and cause environment pollution due to low P acquisition and utilization efficiency in crops (Richardson et al., 2009). Furthermore, rock phosphate is a non-renewable P resource estimated to be exhausted within the next 50 years (Cordell et al., 2009). Therefore, future sustainable agricultural development will require improved P acquisition and utilization efficiency in crop varieties along with optimized field P management (Tian et al., 2012).
Cumulative results suggest that plants have developed a wide range of adaptive strategies to improve P acquisition and utilization efficiency, such as optimized root morphology and architecture, increased root exudation (e.g. protons and organic acids) and enhanced internal and secreted acid phosphatase (APase) activities (Liang et al., 2010; Chen et al., 2011; Péret et al., 2011; Qin et al., 2012; Robinson et al., 2012; Taghipour and Jalali, 2012; Tian et al., 2012). These physiological and morphological responses are co-ordinately regulated in plants by an elaborate P signalling network in which the major components include phosphate (Pi), sugar, phytohormone, microRNAs (e.g. miR399) and transcription factors (Chiou and Lin, 2011). Among the transcription factors, a well-characterized R2R3 MYB member, PHR1 or PHR1-like, is generally considered as the central regulator of Pi starvation-responsive genes (Bari et al., 2006; Nilsson et al., 2007; Valdés-López et al., 2008; Zhou et al., 2008; Chiou and Lin, 2011). Overexpression of AtPHR1 in arabidopsis (Arabidopsis thaliana) or OsPHR2 in rice (Oryza sativa) resulted in excessive P accumulation in shoots (Nilsson et al., 2007; Zhou et al., 2008). Similarly, excessive P accumulation in arabidopsis shoots was also observed with overexpression of miR399 (Bari et al., 2006). Through genetic and molecular analysis, it has been determined that miR399 and PHO2 are downstream of PHR1 in the P signalling pathway that tightly regulates Pi acquisition and mobilization (Bari et al., 2006; Chiou and Lin, 2011).
The complexity of the P signalling pathway in plants has been highlighted with identification and characterization of proteins containing the SPX (Syg1, Pho81 and Xpr1) domain in this kingdom. Proteins containing the SPX domain were first isolated in yeast, and named after the suppressor of yeast gpa1 (Syg1), yeast phosphatase (Pho81) and the human xenotropic and polytropic retrovirus receptor 1 (Xpr1) (Secco et al., 2012b). In yeast, most proteins containing the SPX domain, such as two low affinity transporters Pho87 and Pho90, have been well characterized as being involved in regulating Pi homeostasis (Secco et al., 2012b). In plants, there are four families containing the SPX domain, SPX-EXS, SPX-MFS, SPX-RING and SPX (Hamburger et al., 2002; Stefanovic et al., 2007; Lin et al., 2010; Secco et al., 2010, 2012a; Kant et al., 2011; Wang et al., 2012). Recently, it has been well documented that proteins only containing the SPX domain play a vital role in the P signalling pathway in model plants, including arabidopsis and rice (Duan et al., 2008; C. Wang et al., 2009; Z. Wang et al., 2009; Liu et al., 2010; Yang et al., 2011; Wu et al., 2013). In arabidopsis, a positive regulatory role for AtSPX1 and a negative role for AtSPX3 have been suggested (Duan et al., 2008). In rice, the SPX family contains six members, namely OsSPX1, OsSPX2, OsSPX3, OsSPX4, OsSPX5 and OsSPX6 (C. Wang et al., 2009; Z. Wang et al., 2009; Liu et al., 2010). Among these, OsSPX1, OsSPX3, OsSPX4 and OsSPX5 have been proposed to be negative regulators of transcription of several Pi starvation-responsive genes (C. Wang et al., 2009; Z. Wang et al., 2009; Liu et al., 2010; Wu et al., 2013; Lv et al., 2014; Shi et al., 2014). Furthermore, it has been demonstrated that OsSPX4 could interact with OsPHR2, and thus antagonize OsPHR2 activity in regulation of its downstream gene expression (Lv et al., 2014). Recently, three Pi starvation-responsive SPX members have been cloned and characterized in bean (Phaseolus vulgaris), in which PvSPX1 is found to be a positive regulator in the P signalling pathway (Yao et al., 2014). However, genome-wide analysis of SPX members in other crops, especially in legume crops, remains largely unknown.
Soybean (Glycine max) is a major oil and food crop, as well as an exceptionally good protein source for humans and animals. As a major legume crop, soybean requires a relatively high amount of P because it can form nodules with rhizobia to fix atmospheric nitrogen, which is a high-P-demanding process (Chen et al., 2011; Qin et al., 2012). Adaptive strategies of soybean to P deficiency have been well characterized, including development of a shallower root system, an increase in root exudation (e.g. malate and protons), enhancement of APase activity and formation of symbiosis with arbuscular mycorrhizal (AM) fungi (Shen et al., 2006; Liu et al., 2008; Z. Wang et al., 2009; Wang et al., 2010; Chen et al., 2011; Li et al., 2012; Liang et al., 2013). Furthermore, complex molecular responses of soybean to Pi starvation have been revealed through suppression subtraction hybridization, along with microRNA sequence and proteomic analysis (Guo et al., 2008; Chen et al., 2011; Qin et al., 2012; Xu et al., 2013). Recently, with the release of the soybean genome, genome-wide analysis of several gene families as related to P acquisition and utilization (e.g. GmPAP and GmPT genes) has been studied (Li et al., 2012; Qin et al., 2012; Li et al., 2013). However, key regulators in the soybean P signalling pathway remain to be identified. In the present study, nine soybean GmSPX members were identified and subsequently examined for sub-cellular localization and expression patterns in response to nutrient deficiencies. Furthermore, the functions of GmSPX3 were analysed in transgenic soybean composite plants, which revealed that GmSPX3 might be involved in positively controlling expression of several Pi starvation-responsive genes and Pi homeostasis in soybean.
MATERIALS AND METHODS
Identification and bioinformatics analysis of GmSPX genes in soybean
Using the amino acid sequence of PvEF191350 in common bean (Tian et al., 2007) as a query sequence, BLAST searches were conducted to yield nine GmSPX genes in the soybean (Glycine max) genome at the Phytozome website (http://www.phytozome.net). Furthermore, BLAST searches were performed separately using the nine GmSPX sequences as query sequences at the same website, and no more SPX genes were identified. The GmSPX genes were named GmSPX1–GmSPX9 according to their positions on the soybean chromosomes.
The molecular weight of the proteins was predicted by the ExPASY web server (http://www.expasy.org/). The numbers of exons and introns, the first exon length and total exon length were extracted separately from the Phytozome website. The sub-cellular localization of GmSPXs was predicted on the WoLF PSORT server (http://wolfpsort.org/).
A multiple alignment of GmSPX amino acid sequences was constructed using the ClustalX program. A phylogenetic tree of the SPX family based on alignment of the entire protein sequences obtained from ClustalX was constructed using the Neighbor–Joining method in the MEGA 4·1 program, with the complete-deletion option selected for dealing with gaps or missing data in sequences.
Plant materials and treatments
Seeds of soybean genotype HN66 were surface sterilized for 1 min using 10 % (v/v) H2O2 and then germinated in the dark on germination paper moistened with quarter-strength modified nutrient solution for 7 d as described previously (Li et al., 2012). After germination, seedlings were grown in full-strength nutrient solution for 10 d when the first trifoliate leaves were fully developed, and then were treated with two P levels (−P, 5 μm KH2PO4; +P, 500 μm KH2PO4) as described previously (Li et al., 2012). Roots, stems, leaves, flowers, young pods and seeds were harvested separately as described by Li et al. (2012). Nutrient solution was well aerated and its pH was maintained between 5·8 and 6·0.
For other nutrient deficiency stress experiments, seedlings with the first fully developed trifoliate leaves were transplanted into the nutrient solution lacking nitrogen (N), potassium (K) or iron (Fe). Control plants were grown in full-strength nutrient solution. Leaves and roots were harvested separately at 14 d after initiating treatments. For the N deficiency (−N) experiment, KNO3 and Ca(NO3)2 were replaced by K2SO4 and CaCl2, respectively. For the K deficiency (−K) experiment, KNO3 and KH2PO4 were replaced by Ca(NO3)2 and NH4H2PO4, respectively. For the Fe deficiency (−Fe) experiment, Fe-EDTA was withdrawn from the nutrient solution. Nutrient solutions were well aerated and the pH was maintained between 5·8 and 6·0.
To test for effects of AM fungal inoculation on expression of GmSPX, soybean seeds were surface sterilized and then germinated in sand culture with (+M) or without (−M) Glomus mosseae spores and mycelium. After 7 d, seedlings were irrigated by low-P nutrient solution as described previously (Li et al., 2012). Roots were harvested for RNA extraction after 50 d.
For expression analysis of GmSPX in nodules, soybean seeds were surface sterilized and then germinated on germination paper as above. After 7 d, seedlings were inoculated with rhizobia, Bradyrhizobium sp. BXYD3, and then grown in the nutrient solution containing 50 μm NH4NO3 supplied with 5 μm (−P) or 500 μM (+P) KH2PO4. After 30 d, nodules were harvested to extract RNA for further analysis.
All expression analysis samples were stored at −80 °C prior to RNA extraction. Four biological replicates were included in all of the experiments.
RNA extraction and quantitative real-time PCR analysis
Total RNA was isolated from different tissues of soybean plants using RNAiso Plus reagent (TaKaRa, Japan) following the manufacturer instructions. RNA samples were treated with DNase I (TaKaRa, Japan) to avoid amplification from genomic DNA. The first-strand cDNA was synthesized from 2 μg of total RNA using MMLV reverse transcriptase and oligo(dT) according to the kit protocol (Promega, USA). First-strand cDNA was used for SYBR Green Premix EX Taq™- (TaKaRa, Japan) monitored quantitative real-time PCR (qPCR) analysis. The qPCR analysis was performed using a Rotor-Gene 3000 system (Corbett Research, Australia) with initial denaturation at 95 °C for 1 min, followed by 40 cycles of 95 °C for 15 s, 58–60 °C for 15 s and 72 °C for 30 s. The soybean housekeeping gene EF-1α (X56856) was used as an endogenous control to normalize the samples. The primer pairs used for qPCR analysis are listed in Supplementary Data, Table S1. All gene expression analysis experiments included four biological replicates.
Sub-cellular localization analysis
The coding regions of the nine GmSPX members without stop codons were ligated separately into the transient expression vector (pBEGFP) and fused with the GFP (green fluorescent protein) gene as described previously (Liang et al., 2010). All of the 35S:GmSPX-GFP fusion constructs, as well as the 35S:GFP empty vector control were transiently expressed in onion epidermal cells using the Bio-Rad biolistic PDS/1000 system (http://www.bio-rad.com/). Epidermal cells were observed by the green fluorescence of the GmSPX–GFP protein using a fluorescence microscope (LEICA, DM5000B, Germany) as described previously (Liang et al., 2010). The GFP fluorescence was imaged using a LEICA DFC 480 camera. The onion epidermal cells were plasmolysed by treating them with 30 % sucrose solution.
GmSPX3 overexpression in soybean hairy roots
The coding region of GmSPX3 was cloned into the pTF101-OX vector. The OX-GmSPX3 or empty vector construct was transformed into Agrobacterium rhizogenes strain K599, which infected soybean to produce composite plants with transgenic hairy roots as described previously (Guo et al., 2011). Composite plants were grown in full-strength nutrient solution until the emerged hairy roots were approx. 10 cm long, when they were transplanted separately into nutrient solution supplied with 5 μm KH2PO4 (−P) or 500 μm KH2PO4 (+P) for 14 d. Nutrient solution was well aerated and the pH was maintained between 5·8 and 6·0. One independent transgenic line originating from one transgenic hairy root was considered as one biological replicate. Four biological replicates were included in this experiment. Roots were harvested separately after 14 d in P treatments. The fresh weight and P concentration of each transgenic line was determined separately. A small portion of hairy roots were also harvested for qPCR analysis.
Determination of dry weight and P concentration
Hairy roots and shoots were kept in an oven at 75 °C until completely dried. The dry weight of hairy roots and shoots from the empty vector control and OX-GmSPX3 transgenic lines was analysed. Then the hairy roots and shoots were ground for P concentration analysis using the phosphorus–molybdate blue colour reaction as described previously (Murphy and Riley, 1962). Four biological replicates were included in all the experiments.
Transcripts of downstream genes in transgenic soybean hairy roots
To analyse expression patterns of genes downstream of GmSPX3 in the soybean P signalling pathway, total RNA was extracted from the transgenic hairy roots grown under normal P conditions. Subsequently, qPCR was conducted to analyse the expression of seven GmSPX3 downstream genes. All qPCR primers (Supplementary Data Table S1) were designed according to the sequences from GenBank (http://www.ncbi.nlm.nih.gov/genbank) for GmPT2 (FJ814696) and GmALMT1 (EU586178), or from Phytozome (http://www.phytozome.net) for GmHAD1-6 (Glyma08g20810), GmPAP21 (Glyma10g08300), GmPT7 (Glyma10g33030), GmIPS1 (Glyma13g21070) and GmRNS1 (Glyma01g05840).
RESULTS
Identification and characterization of the GmSPX family genes in soybean
A total of nine putative GmSPX members were identified in the soybean genome database (http://www.phytozome.net) through BLAST searching. General information on the GmSPX members is summarized in Table 1. The GmSPX members were unevenly distributed on soybean chromosomes 1, 4, 10, 13, 17 and 20 (Table 1). Based on their chromosomal positions, the nine GmSPX members were named GmSPX1, GmSPX2, GmSPX3, GmSPX4, GmSPX5, GmSPX6, GmSPX7, GmSPX8 and GmSPX9. Open reading frames of the GmSPX members ranged from 753 to 936 bp in length, which were predicted to encode proteins 250–311 amino acids in length and 29·1–35·2 kDa in molecular weight. Sub-cellular localization of GmSPX members predicted on the WoLF PSORT website showed that GmSPX6, GmSPX7 and GmSPX8 might reside in the nucleus, GmSPX2, GmSPX3, GmSPX4, GmSPX5 and GmSPX9 might localize in the cytoplasm, and GmSPX1 might be located in the chloroplast (Table 1).
Table 1.
General information for the nine GmSPX members
| Gene locus | Proposed name | No. of exons/introns | First/total exon length (bp) | No. of amino acids | Predicted size (kDa) | Sub-cellular location |
|---|---|---|---|---|---|---|
| Glyma01g33170 | GmSPX1 | 4/3 | 249/852 | 283 | 32·2 | chlo: 5·0 |
| Glyma04g07160 | GmSPX2 | 3/2 | 243/753 | 250 | 29·1 | cyto: 12·0 |
| Glyma04g19450 | GmSPX3 | 4/3 | 126/870 | 286 | 32·9 | cyto: 8·0 |
| Glyma06g07260 | GmSPX4 | 2/1 | 437/888 | 296 | 29·1 | cyto: 12·0 |
| Glyma10g40820 | GmSPX5 | 3/2 | 244/754 | 289 | 33·5 | cyto: 11·0 |
| Glyma13g05570 | GmSPX6 | 3/2 | 285/936 | 311 | 35·2 | nucl: 5·5 |
| Glyma13g23580 | GmSPX7 | 3/2 | 282/855 | 284 | 32·6 | nucl: 8·0 |
| Glyma17g12340 | GmSPX8 | 4/3 | 110/753 | 295 | 33·5 | nucl: 8·0 |
| Glyma20g26490 | GmSPX9 | 3/2 | 86/861 | 270 | 31·3 | cyto: 9·0 |
The gene locus, exon or intron length, and protein size were extracted and analysed from the Phytozome website (http://www.phytozome.net) and the ExPASY web server (http://www.expasy.org/).
Chlo: chloroplast; cyto: cytoplasm; nucl: nucleus.
Numbers after organelles are scores from the WoLF PSORT prediction; a higher score indicates a greater possibility of the protein localization.
To examine the similarity and identify the conserved domain among GmSPX members, a multiple sequence alignment was constructed. Results showed that the amino acid sequences of all GmSPX members were similar to each other (Supplementary Data Fig. S1). The nine GmSPX members contained a highly conserved region (i.e. the SPX domain) in the N-terminal region, which could be further divided into three sub-domains (Supplementary Data Fig. S1).
A phylogenetic tree was constructed to examine evolutionary relationships among SPX family members in soybean, arabidopsis, rice, Medicago truncatula, common bean (Phaseolus vulgaris L.), Capsella rubella, Eutrema salsugineum and rapeseed (Brassica napus L.). Phylogenetic analysis demonstrated that the SPX family in plants could be classified into three groups, and that group I could be further subdivided into two groups (Fig. 1). All GmSPX members belonged to group I, except for GmSPX1 and GmSPX6, which belonged to group II and III, respectively. Subdivision of group I placed GmSPX3, GmSPX7 and GmSPX8 into sub-group I-1, along with PvSPX1 and PvSPX2 from bean, OsSPX1 and OsSPX2 from rice, AtSPX1 and AtSPX2 from arabidopsis, MtXP_003609335 from M. truncatula, and EsXP_006409728 and EsXP_006400582 from E. salsugineum (Fig. 1). The remaining soybean members, GmSPX2, GmSPX4, GmSPX5 and GmSPX9 were clustered in sub-group I-2 with PvSPX3 from bean and MtXP_003588760 from M. truncatula (Fig. 1).
Fig. 1.

Phylogenetic analysis of SPX proteins in plants. The phylogenetic tree was created in the Mega 4·1 program. The GenBank accession numbers of the protein or gene locus are listed as follows: AtSPX1 (At5g20150); AtSPX2 (At2g26660); AtSPX3 (At2g45130); AtSPX4 (At5g15330); GmSPX1 (Glyma01g33170); GmSPX2 (Glyma04g07160); GmSPX3 (Glyma04g19450); GmSPX4 (Glyma06g07260); GmSPX5 (Glyma10g40820); GmSPX6 (Glyma13g05570); GmSPX7 (Glyma13g23580); GmSPX8 (Glyma17g12340); GmSPX9 (Glyma20g26490); OsSPX1 (Os03g0343400); OsSPX2 (Os02g10780); OsSPX3 (Os10g25310); OsSPX4 (Os03g61200); OsSPX5 (Os03g29250); OsSPX6 (Os07g42330); PvSPX1 (EF191350); PvSPX2 (EG594307); PvSPX3 (EG594308). The first two letters of each protein label represent the abbreviated species name, followed by the GenBank accession number. At, Arabidopsis thaliana; Gm, Glycine max; Os, Oryza sativa; Mt, Medicago truncatula; Pv, Phaseolus vulgaris; Bn, Brassica napus; Cr, Capsella rubella; Es, Eutrema salsugineum.
Sub-cellular localization of GmSPX members
To determine the sub-cellular localization of GmSPX members, GmSPX–GFP fusion proteins were transiently expressed in onion epidermal cells. The results showed that GmSPX3, GmSPX7 and GmSPX8 were confined to the nuclei of onion epidermal cells (Fig. 2), suggesting that they might be nuclear proteins. Furthermore, signals of GFP fused with GmSPX1, GmSPX2, GmSPX4, GmSPX5, GmSPX6 and GmSPX9 were detected in many areas in onion epidermal cells, including the cytoplasm and nucleus (Fig. 2).
Fig. 2.

Sub-cellular localization of GmSPX in onion epidermal cells. The first row shows the localization of the empty vector control before and after plasmolysis, followed by localization of 35S:GmSPX–GFP constructs before and after plasmolysis. Cells were observed by green fluorescence of GFP in the control and of GmSPX–GFP protein constructs in the remaining panels. Scale bars = 100 μm.
Tissue-specific responses of GmSPX to P deficiency
Expression patterns of the nine GmSPX genes were investigated at two P levels in various soybean tissues, including young leaves, stems, roots, flowers, pods and seeds (Fig. 3). Under P-replete conditions, transcripts of GmSPX genes were detected in all the tested tissues, except that negligible expression levels were observed for GmSPX4 in seeds and for GmSPX5 in roots (Fig. 3). Even so, GmSPX genes exhibited diverse expression levels among the tissues. For example, GmSPX6 and GmSPX8 had similar expression levels among all the tissues (Fig. 3), whereas GmSPX2, GmSPX7 and GmSPX9 had the highest expression levels in flowers (Fig. 3), and GmSPX1 was expressed preferentially in seeds (Fig. 3).
Fig. 3.

Expression levels of GmSPX members in various tissues of soybean under high-P (+P) and low-P (−P) conditions. Asterisks indicate significant differences in GmSPX gene expression levels between high-P and low-P conditions. *0·01 < P < 0·05; **0·001 < P < 0·01; ***P < 0·001.
Diverse responses of GmSPX members to P deficiency were further demonstrated in the various soybean tissues (Fig. 3). All GmSPX members, except GmSPX6, were significantly regulated by Pi starvation in at least one tissue. Six GmSPX transcripts were significantly increased by P deficiency in four or more tissues, with GmSPX1, GmSPX5 and GmSPX6 being the exceptions (Fig. 3). Significant increases in transcription in all tissues in response to P deficiency were observed only for GmSPX8. Finally, reduced transcription in response to P deficiency was only found for GmSPX1 in seeds and for GmSPX5 in both flowers and seeds (Fig. 3).
Responses of GmSPX transcripts to other nutrient deficiencies
Expression patterns of GmSPX genes in both leaves and roots were further studied under deficiencies of N, K or Fe. Similar to responses to P deficiency, transcripts of most GmSPX genes in leaves were increased by N, K and Fe deficiencies, except that suppressed transcripts were observed for GmSPX7 and GmSPX8 under K deficiency conditions, and for GmSPX5 under Fe deficiency conditions (Fig. 4). More diverse responses of GmSPX genes were observed in roots under N, K and Fe deficiency conditions (Fig. 4). Under N deficiency conditions, transcription levels of GmSPX1, GmSPX2, GmSPX3 and GmSPX6 in roots were enhanced, while expression of GmSPX5 was reduced by >2 fold, and expression of the other GmSPX genes remained unchanged (i.e. expression changes <2-fold) (Fig. 4). In the K-deficient treatment, expression levels of GmSPX2 and GmSPX5 in roots increased >2-fold, and transcripts of GmSPX1, GmSPX3 and GmSPX9 were reduced >2-fold (Fig. 4). Under Fe deficiency conditions, only GmSPX8 expression was increased by >2-fold in roots, and reduced transcripts were found for most GmSPX genes, especially GmSPX1, GmSPX2, GmSPX3, GmSPX4 and GmSPX9 (Fig. 4).
Fig. 4.

Expression patterns of GmSPX in response to nutrient deficiency in leaves and roots. Soybean seedlings with the first fully developed trifoliate leaves were transplanted separately to nutrient solution lacking N (−N), K (−K) or Fe (−Fe). Control plants (CK) were those grown in full-strength solution. Leaves and roots were harvested separately after 14 d of the treatments. The fold change of the expression of GmSPX genes between nutrient-deficient and control treatments was calculated as log2 (nutrient deficiency/CK). Data in the figure are the mean of four replicates with the standard error. Dotted lines indicate the log2(2) scale. Different letters represent significant differences for GmSPX transcripts at 0·05 levels.
GmSPX transcripts in mycorrhizal roots and nodules
Soybean can form symbiotic associations with rhizobia and AM fungi, which can influence nutrient (e.g. P and N) status in soybean. Therefore, expression patterns of GmSPX genes in mycorrhizal roots and nodules were also investigated. Expression levels of GmSPX5 were significantly enhanced by AM fungal infection under low P conditions (Fig. 5A). Changes in transcription of the other GmSPX genes were <2-fold, compared with those without AM fungi inoculation, suggesting that their expression levels were not significantly affected by AM infection at a low P level (Fig. 5A).
Fig. 5.
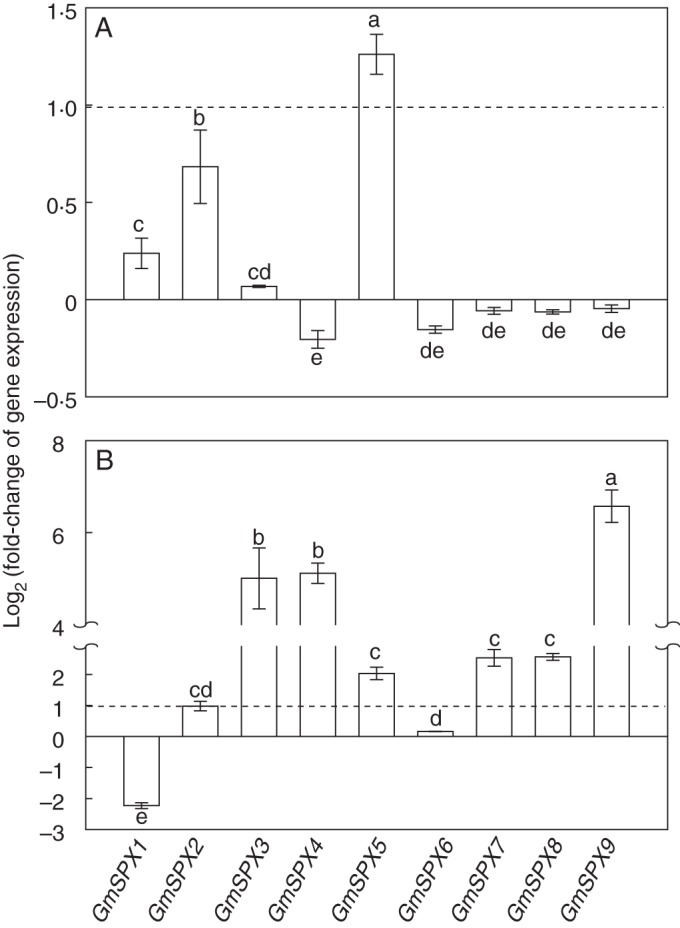
Expression patterns of GmSPX in mycorrhizal roots and nodules. (A) Fold change of the expression of GmSPX in roots inoculated with AM fungi (+AM) relative to roots without AM fungi inoculation (−AM) was calculated as log2 (+AM/−AM). (B) Fold change of the expression of GmSPX in nodules formed in low-P (−P) treatment relative to those in high-P (+P) treatment was calculated as log2 (−P nodules/+P nodules). Data in the figure are the mean of four replicates with the standard error. Dotted lines indicate the log2(2) scale. Different letters represent significant differences for GmSPX transcripts at 0·05 levels.
In soybean nodules, expression levels of most GmSPX genes, except GmSPX1 and GmSPX6, were up-regulated by Pi starvation (Fig. 5B). Most notably, GmSPX3, GmSPX4 and GmSPX9 transcripts increased considerably (Fig. 5B). In contrast, a suppressed or <2-fold change in transcription was observed for GmSPX1 and GmSPX6 in nodules under Pi starvation, respectively (Fig. 5B).
Functional analysis of GmSPX3 in soybean composite plants
Since GmSPX3 exhibited high sequence homology to and had similar properties (e.g. increased transcription under Pi starvation, nuclear localization) to those reported for OsSPX1 and AtSPX1, the functions of GmSPX3 were further evaluated through analysis of soybean transgenic composite plants with GmSPX3-overexpressing hairy roots. Increased expression of GmSPX3 in transgenic hairy roots was verified through qPCR analysis (Supplementary Data Fig. S2). Soybean transgenic composite plants were grown in nutrient solution at two P levels. After 14 d, the fresh weight and P concentration were separately determined. Under P deficiency conditions, the fresh weight of CK (i.e. soybean hairy roots transformed with the empty vector) and OX (i.e. soybean hairy roots overexpressing GmSPX3) lines was similar (Fig. 6). However, under P-sufficient conditions, the fresh weight of the OX line was significantly lower than that in the CK line (Fig. 6). In contrast, higher P concentrations were observed in shoots and roots of the OX line under P-sufficient conditions (Fig. 6), suggesting that overexpression of GmSPX3 could increase P accumulation in both shoots and roots in soybean.
Fig. 6.

Fresh weight and P concentration in composite soybean plants. Fresh weight (top) and phosphorus concentration (bottom) in shoots and roots. Composite soybean plants with transgenic hairy roots were grown in full-strength nutrient solution for 7 d prior to transfer into nutrient solution containing 5 μm (−P) or 500 μm (+P) phosphorus. After 14 d in P treatments, shoots and roots were harvested separately for analysis. CK represents soybean hairy roots transformed with the empty vector; OX indicates transgenic soybean hairy roots overexpressing of GmSPX3. Each bar is the mean of four replicates with the standard error. Asterisks indicate significant differences between OX and CK within the same P treatments at 0·05 levels.
GmSPX3 participates in the soybean P signalling network
In order to demonstrate the regulatory roles of GmSPX3 in the soybean P signalling network, transcription levels of seven Pi starvation-responsive genes were analysed in OX and CK transgenic hairy roots. The seven genes comprised a ribonuclease gene (GmRNS1), GmIPS1, two Pi transporters (GmPT2 and GmPT7), a protein phosphatase (GmHAD1-6), a malate transporter (GmALMT1) and a purple acid phosphatase (GmPAP21). The qPCR results showed that overexpressing GmSPX3 led to significantly increased transcription of all the seven tested genes in the transgenic hairy roots (Fig. 7). Among them, compared with those in CK lines, the expression levels of three genes in GmSPX3-overexpressing soybean hairy roots were increased by >2-fold, but <8-fold, namely GmPT2, GmIPS1 and GmHAD1-6 (Fig. 7). However, transcripts of the remaining genes were increased by >20-fold, i.e. GmPT7, GmALMT1, GmRNS1 and GmPAP21 (Fig. 7). These results strongly suggest that GmSPX3 might positively regulate the transcription levels of Pi starvation-responsive genes in soybean.
Fig. 7.

Transcription of seven Pi starvation-responsive genes in CK and GmSPX3-overexpressing transgenic hairy roots. Soybean composite plants were grown in nutrient solution containing 500 μm (+P) phosphorus for 21 d. Transcripts of the seven genes in hairy roots were determined by qPCR analysis. CK represents soybean hairy roots transformed with the empty vector; OX indicates transgenic soybean hairy roots overexpressing GmSPX3. Each bar is the mean of four replicates with the standard error. Asterisks indicate significant differences in downstream gene expression between OX and CK. *0·01 < P < 0·05; **0·001 < P < 0·01; ***P < 0·001.
DISCUSSION
Critical roles in the P signalling network for proteins containing the SPX domain have been well documented in model organisms, including yeast, arabidopsis, bean and rice (Duan et al., 2008; C. Wang et al., 2009; Z. Wang et al., 2009; Liu et al., 2010; Chiou and Lin, 2011; Secco et al., 2012a; Lv et al., 2014; Shi et al., 2014; Yao et al., 2014). However, genome-wide analysis of SPX family members in other crops remains scarce. The release of the soybean genome sequence provided an opportunity to characterize GmSPX members and to dissect their potential roles in soybean adaptation to P deficiency. In this study, structure, sub-cellular localization and expression patterns of GmSPX members were analysed in soybean for the first time. Furthermore, positive regulatory roles of GmSPX3 in the P signalling pathway were evaluated.
In total, nine GmSPX members were identified in the soybean genome by blastp searches on the Phytozome website (Table 1). Through phylogenetic analysis, SPX members in plants can be divided into three groups. Most SPX members in the tested species belong to group I, which can be further classified into two sub-groups (Fig. 1). In subgroup I-1, three GmSPX members, GmSPX3, GmSPX7 and GmSPX8, were grouped with AtSPX1 from arabidopsis, OsSPX1 from rice and PvSPX1 from bean; all of them have been well documented to be involved in plant P signalling (Duan et al., 2008; C. Wang et al., 2009; Z. Wang et al., 2009; Liu et al., 2010; Yao et al., 2014). Furthermore, GmSPX3, GmSPX7 and GmSPX8 were localized in the nucleus (Fig. 2), the same as AtSPX1, OsSPX1 and PvSPX1 (Duan et al., 2008; Z. Wang et al., 2009; Yao et al., 2014), which further suggests that these three GmSPX members might play regulatory roles in soybean P signalling similar to those of AtSPX1, OsSPX1 and PvSPX1 in their respective genomes (Fig. 2). Other GmSPX members were found in many locations in onion epidermal cells, including the cytoplasm and nucleus (Fig. 2). This suggests that GmSPX members might fulfil diverse functions throughout the cell. It has been suggested that the nuclear-localized AtSPX1 and intercellular membrane-localized AtSPX3 play contrasting regulatory roles in arabidopsis P signalling (Duan et al., 2008). A similar pattern requiring further characterization is possible in soybean.
With the advent of next-generation sequencing, transcriptomics analysis has been performed in various tissues of soybean, and transcripts of GmSPX members have been detected (Libault et al., 2010; Severin et al., 2010). Consistent with these reports, transcripts of all GmSPX members were found among the tested tissues of soybean (Fig. 3). However, expression levels of several GmSPX members differed from previous results. For example, preferential expression in flowers was observed for GmSPX2, GmSPX3, GmSPX7 and GmSPX9 at high P levels (Fig. 3), which contrasted with results from previous transcriptomics analyses (Libault et al., 2010; Severin et al., 2010). The inconsistencies might be caused by different experimental materials, growth conditions or techniques.
Responses of GmSPX members to P deficiency were examined in a variety of soybean tissues. In this study, transcripts of most GmSPX genes were significantly increased by P deficiency in more than four tissues (Fig. 3). However, no response to P deficiency was observed for GmSPX6 in any tested tissue, or for GmSPX1 in any of the tested tissues except seeds (Fig. 3). Similar expression patterns of SPX members were found in arabidopsis, rice and bean. In arabidopsis, P deficiency resulted in increased transcription of AtSPX1, AtSPX2 and AtSPX3, but reduced transcription of AtSPX4 in shoots and roots (Duan et al., 2008). In rice, expression of five OsSPX members (i.e. OsSPX1, OsSPX2, OsSPX3, OsSPX5 and OsSPX6) was upregulated by P deficiency, while no response was observed for OsSPX4 (Z. Wang et al., 2009). Although genome-wide analysis of the responses of PvSPX members to Pi starvation have not been studied in bean, at least three PvSPX members were upregulated by Pi starvation (Yao et al., 2014). These results suggest that the expression patterns of SPX members in responses to P deficiency might be conserved among plant species, and diverse functions might be present among SPX members. Interestingly, several SPX members exhibiting no upregulated response to Pi starvation were classified into group III, including GmSPX6 in soybean, AtSPX4 in arabidopsis and OsSPX4 in rice (Fig. 1), which strongly suggests conservation of functions among these SPX members in plants that warrants further clarification.
In addition to P deficiency responses, genome-wide analysis of GmSPX responses to other nutrient deficiencies was first examined in plants. The results showed that expression of most GmSPX members was significantly affected by N, K or Fe deficiency, particularly in leaves (Fig. 4). This suggests that transcriptional responses of GmSPX members to P deficiency are non-specific, and that interactions are possible between pathways involved in soybean adaptation to P, N, Fe or K deficiency. Although cross-talk between these nutrients has been studied and recognized, the critical components remain to be characterized (Coello and Polacco, 1999; Wang et al., 2002; Misson et al., 2005). Recently, it has been documented that a protein containing the SPX domain, AtNLA, could control Pi homeostasis in a nitrate-dependent manner in arabidopsis (Kant et al., 2011), which indicates that proteins containing the SPX domain might be important for dissecting interactions among the nutrients in plants in the future.
Soybean can form nodules with rhizobia, which fix atmospheric N and provide N resources for soybean growth. However, biological N fixation is a high energy consuming process, which is easily inhibited by P deficiency (Chaudhary et al., 2008; Hernández et al., 2009; Chen et al., 2011; Qin et al., 2012). Therefore, it has been documented that one adaptive strategy of soybean nodules to P deficiency is to maintain Pi homeostasis through increased transcription of a Pi transporter gene, GmPT5, in nodules (Qin et al., 2012). In this study, we found that transcripts of seven of nine GmSPX members increased considerably in nodules exposed to P deficiency (Fig. 5B). Since it has been well documented that AtSPX3, four OsSPX members (i.e. OsSPX1, OsSPX3, OsSPX4 and OsSPX5) and PvSPX1 participate in regulating Pi homeostasis in plants, it can be hypothesized that some GmSPX members are involved in regulating Pi homeostasis in soybean nodules. Another typical symbiotic association for soybean is to develop symbiotic relationships with AM fungi, which affect plant Pi acquisition and utilization (Wang et al., 2010). Recently, it has been documented that inoculation of AM fungi significantly increases transcription of a group of genes in soybean, such as purple APases (GmPAP) and expansin (GmEXPB) genes (Li et al., 2012; Li et al., 2013). Strangely, most GmSPX members exhibited no response to inoculation with AM fungi, except for GmSPX5 (Fig. 5A). Since regulatory roles for SPX in P signalling have been well documented in rice and arabidopsis, it is possible GmSPX5 might be involved in regulating a group of AM fungal symbiosis-related genes in soybean.
Among all the GmSPX members, GmSPX3 was most similar to PvSPX1, AtSPX1 and OsSPX1 in sequence homology, Pi starvation responses and nuclear localization. Therefore, we selected GmSPX3 as the candidate for further functional analysis in soybean. Composite soybean plants with GmSPX3-overexpressing hairy roots were generated. In this study, seven Pi starvation-responsive genes were significantly upregulated in the GmSPX3-overexpressing roots, implying that GmSPX3 is a positive regulator in the soybean P signalling network (Fig. 7). Regulatory roles for SPX family members in P signalling have also been identified in arabidopsis, rice and bean. Duan et al. (2008) found that AtSPX1 overexpression in arabidopsis enhances the transcription of several Pi starvation-induced genes (e.g. AtACP5, AtPAP2 and AtRNS1), indicating a positive regulatory role for AtSPX1. Similarly, a positive regulatory role for PvSPX1 has also been suggested in bean (Yao et al., 2014). On the other hand, regulatory roles for SPX members appear to vary among plant species, because OsSPX1, OsSPX3, OsSPX4 and OsSPX5 negatively regulate expression levels of several Pi starvation-induced genes in rice (C. Wang et al., 2009; Liu et al., 2010; Lv et al., 2014; Shi et al., 2014). These results imply that the molecular mechanisms underlying the regulatory roles of SPX members might be different between monocot and dicot plants, which requires further study. Consistent with increased transcription of two Pi transporter genes, GmPT2 and GmPT7, in GmSPX3-overexpressing hairy roots, the P concentration in shoots and roots of GmSPX3-overexpressing composite plants was significantly higher than that in control lines under high-P conditions (Fig. 6). This suggests that GmSPX3 plays a regulatory role in Pi absorption and translocation in soybean. The involvement of SPX members in Pi homeostasis has also been demonstrated in rice, in which suppression of OsSPX1 results in P overaccumulation in both leaves and roots under high P conditions (C. Wang et al., 2009; Liu et al., 2010). However, the molecular mechanisms of SPX regulation of P acquisition and translocation need to be further clarified.
In summary, GmSPX members were systematically characterized with respect to gene structure, sub-cellular localization, tissue-specific expression patterns and responses to nutrient (i.e. N, P, K and Fe) deficiencies. Furthermore, the functions of GmSPX3 involved in the P signalling pathway and Pi homeostasis in soybean have been elucidated. These results provide not only comprehensive information on properties of GmSPX members in soybean, but also the impetus to understand further the molecular mechanisms underlying soybean adaptation to P deficiency.
SUPPLEMENTARY DATA
ACKNOWLEDGEMENTS
This work was supported by grants from the National Natural Science Foundation of China [31372119], the National Key Basic Research Special Funds of China [2011CB100301] and the Project of Science and Technology New Star in Zhujiang Guangzhou city [2011J2200055]. We thank Dr Thomas Walk and Liang Cuiyue for critical review of the manuscript. We thank Miss Lu Qin, Miss Xinxin Li, Mr Chengchen Li and Mr Qiangqiang Cui for sampling assistance.
LITERATURE CITED
- Bari R, Pant BD, Stitt M, Scheible WR. PHO2, microRNA399, and PHR1 define a phosphate-signaling pathway in plants. Plant Physiology. 2006;141:988–999. doi: 10.1104/pp.106.079707. [DOI] [PMC free article] [PubMed] [Google Scholar]
- Chaudhary MI, Adu-Gyamfi JJ, Saneoka H, et al. The effect of phosphorus deficiency on nutrient uptake, nitrogen fixation and photosynthetic rate in mash bean, mung bean and soybean. Acta Physiologiae Plantarum. 2008;30:537–544. [Google Scholar]
- Chen Z, Cui Q, Liang C, Sun L, Tian J, Liao H. Identification of differentially expressed proteins in soybean nodules under phosphorus deficiency through proteomic analysis. Proteomics. 2011;11:4648–4659. doi: 10.1002/pmic.201100231. [DOI] [PubMed] [Google Scholar]
- Chiou TJ, Lin S. Signaling network in sensing phosphate availability in plants. Annual Review of Plant Physiology and Plant Molecular Biology. 2011;62:185–206. doi: 10.1146/annurev-arplant-042110-103849. [DOI] [PubMed] [Google Scholar]
- Coello P, Polacco JC. ARR6, a response regulator from Arabidopsis, is differentially regulated by plant nutritional status. Plant Science. 1999;143:211–220. [Google Scholar]
- Cordell D, Drangert JO, White S. The story of phosphorus: global food security and food for thought. Global Environmental Change. 2009;19:292–305. [Google Scholar]
- Duan K, Yi K, Dang L, Huang H, Wu W, Wu P. Characterization of a sub-family of Arabidopsis genes with the SPX domain reveals their diverse functions in plant tolerance to phosphorus starvation. The Plant Journal. 2008;54:965–975. doi: 10.1111/j.1365-313X.2008.03460.x. [DOI] [PubMed] [Google Scholar]
- Graham PH, Vance CP. Nitrogen fixation in perspective: an overview of research and extension needs. Field Crops Research. 2000;65:93–106. [Google Scholar]
- Guo W, Zhang L, Zhao J, Liao H, Zhuang C, Yan X. Identification of temporally and spatially phosphate-starvation responsive genes in Glycine max. Plant Science. 2008;175:574–584. [Google Scholar]
- Guo W, Zhao J, Li X, Qin L, Yan X, Liao H. A soybean β-expansin gene GmEXPB2 intrinsically involved in root system architecture responses to abiotic stresses. The Plant Journal. 2011;66:541–552. doi: 10.1111/j.1365-313X.2011.04511.x. [DOI] [PubMed] [Google Scholar]
- Hamburger D, Rezzonico E, MacDonald-Comber PJ, Somerville C, Poirier Y. Identification and characterization of the Arabidopsis PHO1 gene involved in phosphate loading to the xylem. The Plant Cell. 2002;14:889–902. doi: 10.1105/tpc.000745. [DOI] [PMC free article] [PubMed] [Google Scholar]
- Hardarson G, Atkins C. Optimising biological N2 fixation by legumes in farming systems. Plant and Soil. 2003;252:41–54. [Google Scholar]
- Hernández G, Valdés-López O, Ramírez M, et al. Global changes in the transcript and metabolic profiles during symbiotic nitrogen fixation in phosphorus-stressed common bean plants. Plant Physiology. 2009;151:1221–1238. doi: 10.1104/pp.109.143842. [DOI] [PMC free article] [PubMed] [Google Scholar]
- Kant S, Peng M, Rothstein SJ. Genetic regulation by NLA and microRNA 827 for maintaining nitrate-dependent phosphate homeostasis in Arabidopsis. PLoS Genetics. 2011;7:e1002021. doi: 10.1371/journal.pgen.1002021. [DOI] [PMC free article] [PubMed] [Google Scholar]
- Li C, Gui S, Yang T, Walk T, Wang X, Liao H. Identification of soybean purple acid phosphatase genes and their expression responses to phosphorus availability and symbiosis. Annals of Botany. 2012;109:275–285. doi: 10.1093/aob/mcr246. [DOI] [PMC free article] [PubMed] [Google Scholar]
- Li X, Zhao J, Walk TC, Liao H. Characterization of soybean β-expansin genes and their expression responses to symbiosis, nutrient deficiency and hormone treatments. Applied Microbiology and Biotechnology. 2013;98:2805–2817. doi: 10.1007/s00253-013-5240-z. [DOI] [PubMed] [Google Scholar]
- Liang C, Tian J, Lam HM, Lim BL, Yan X, Liao H. Biochemical and molecular characterization of PvPAP3, a novel purple acid phosphatase isolated from common bean enhancing extracellular ATP utilization. Plant Physiology. 2010;152:854–865. doi: 10.1104/pp.109.147918. [DOI] [PMC free article] [PubMed] [Google Scholar]
- Liang C, Piñeros M, Tian J, et al. Low pH, aluminum and phosphorus coordinately regulate malate exudation through GmALMT1 to improve soybean adaptation to acid soils. Plant Physiology. 2013;161:1347–1361. doi: 10.1104/pp.112.208934. [DOI] [PMC free article] [PubMed] [Google Scholar]
- Libault M, Farmer A, Joshi T, et al. An integrated transcriptome atlas of the crop model Glycine max, and its use in comparative analyses in plants. The Plant Journal. 2010;63:86–99. doi: 10.1111/j.1365-313X.2010.04222.x. [DOI] [PubMed] [Google Scholar]
- Lin SI, Santi C, Jobet E, et al. Complex regulation of two target genes encoding SPX-MFS proteins by rice miR827 in response to phosphate starvation. Plant and Cell Physiology. 2010;51:2119–2131. doi: 10.1093/pcp/pcq170. [DOI] [PubMed] [Google Scholar]
- Liu F, Wang Z, Ren H, et al. OsSPX1 suppresses the function of OsPHR2 in the regulation of expression of OsPT2 and phosphate homeostasis in shoots of rice. The Plant Journal. 2010;62:508–517. doi: 10.1111/j.1365-313X.2010.04170.x. [DOI] [PubMed] [Google Scholar]
- Liu L, Liao H, Wang X, Yan X. Regulation effect of soil P availability on mycorrhizal infection in relation to root architecture and P efficiency of Glycine max. Chinese Journal of Applied Ecology. 2008;19:564–568. [PubMed] [Google Scholar]
- Lv Q, Zhong Y, Wang Y, et al. SPX4 negatively regulates phosphate signaling and homeostasis through its interaction with PHR2 in rice. The Plant Cell. 2014;26:1586–1597. doi: 10.1105/tpc.114.123208. [DOI] [PMC free article] [PubMed] [Google Scholar]
- Misson J, Raghothama KG, Jain A, et al. A genome-wide transcriptional analysis using Arabidopsis thaliana Affymetrix gene chips determined plant responses to phosphate deprivation. Proceedings of the National Academy of Sciences, USA; 2005. pp. 11934–11939. [DOI] [PMC free article] [PubMed] [Google Scholar]
- Murphy J, Riley J. A modified single solution method for the determination of phosphate in natural water. Analytica Chimica Acta. 1962;27:31–35. [Google Scholar]
- Nilsson L, Müller R, Nielsen TH. Increased expression of the MYB-related transcription factor, PHR1, leads to enhanced phosphate uptake in Arabidopsis thaliana. Plant, Cell and Environment. 2007;30:1499–1512. doi: 10.1111/j.1365-3040.2007.01734.x. [DOI] [PubMed] [Google Scholar]
- Péret B, Clément M, Nussaume L, Desnos T. Root developmental adaptation to phosphate starvation: better safe than sorry. Trends in Plant Science. 2011;16:442–450. doi: 10.1016/j.tplants.2011.05.006. [DOI] [PubMed] [Google Scholar]
- Qin L, Zhao J, Tian J, et al. The high-affinity phosphate transporter GmPT5 regulates phosphate transport to nodules and nodulation in soybean. Plant Physiology. 2012;159:1634–1643. doi: 10.1104/pp.112.199786. [DOI] [PMC free article] [PubMed] [Google Scholar]
- Richardson AE, Hocking PJ, Simpson RJ, George TS. Plant mechanisms to optimise access to soil phosphorus. Crop and Pasture Science. 2009;60:124–143. [Google Scholar]
- Robinson WD, Park J, Tran HT, et al. The secreted purple acid phosphatase isozymes AtPAP12 and AtPAP26 play a pivotal role in extracellular phosphate-scavenging by Arabidopsis thaliana. Journal of Experimental Botany. 2012;63:6531–6542. doi: 10.1093/jxb/ers309. [DOI] [PMC free article] [PubMed] [Google Scholar]
- Secco D, Baumann A, Poirier Y. Characterization of the rice PHO1 gene family reveals a key role for OsPHO1;2 in phosphate homeostasis and the evolution of a distinct clade in dicotyledons. Plant Physiology. 2010;152:1693–1704. doi: 10.1104/pp.109.149872. [DOI] [PMC free article] [PubMed] [Google Scholar]
- Secco D, Wang C, Arpat BA, Wang ZY, Whelan J. The emerging importance of the SPX domain-containing proteins in phosphate homeostasis. New Phytologist. 2012a;193:842–851. doi: 10.1111/j.1469-8137.2011.04002.x. [DOI] [PubMed] [Google Scholar]
- Secco D, Wang C, Shou H, Whelan J. Phosphate homeostasis in the yeast Saccharomyces cerevisiae, the key role of the SPX domain-containing proteins. FEBS Letters. 2012b;586:289–295. doi: 10.1016/j.febslet.2012.01.036. [DOI] [PubMed] [Google Scholar]
- Severin AJ, Woody JL, Bolon YT, et al. RNA-Seq atlas of Glycine max: a guide to the soybean transcriptome. BMC Plant Biology. 2010;10:160. doi: 10.1186/1471-2229-10-160. [DOI] [PMC free article] [PubMed] [Google Scholar]
- Shen H, Chen J, Wang Z, et al. Root plasma membrane H+-ATPase is involved in the adaptation of soybean to phosphorus starvation. Journal of Experimental Botany. 2006;57:1353–1362. doi: 10.1093/jxb/erj111. [DOI] [PubMed] [Google Scholar]
- Shi J, Hu H, Zhang K, et al. The paralogous SPX3 and SPX5 genes redundantly modulate Pi homeostasis in rice. Journal of Experimental Botany. 2014;65:859–870. doi: 10.1093/jxb/ert424. [DOI] [PMC free article] [PubMed] [Google Scholar]
- Stefanovic A, Ribot C, Rouached H, et al. Members of the PHO1 gene family show limited functional redundancy in phosphate transfer to the shoot, and are regulated by phosphate deficiency via distinct pathways. The Plant Journal. 2007;50:982–994. doi: 10.1111/j.1365-313X.2007.03108.x. [DOI] [PubMed] [Google Scholar]
- Taghipour M, Jalali M. Effect of low-molecular-weight organic acids on kinetics release and fractionation of phosphorus in some calcareous soils of western Iran. Environmental Monitoring and Assessment. 2012;185:5471–5482. doi: 10.1007/s10661-012-2960-y. [DOI] [PubMed] [Google Scholar]
- Tian J, Venkatachalam P, Liao H, Yan X, Raghothama K. Molecular cloning and characterization of phosphorus starvation responsive genes in common bean (Phaseolus vulgaris L.) Planta. 2007;227:151–165. doi: 10.1007/s00425-007-0603-2. [DOI] [PubMed] [Google Scholar]
- Tian J, Wang X, Tong Y, Chen X, Liao H. Bioengineering and management for efficient phosphorus utilization in crops and pastures. Current Opinion in Biotechnology. 2012;23:866–871. doi: 10.1016/j.copbio.2012.03.002. [DOI] [PubMed] [Google Scholar]
- Valdés-López O, Arenas-Huertero C, Ramirez M, et al. Essential role of MYB transcription factor: PvPHR1 and microRNA: PvmiR399 in phosphorus-deficiency signaling in common bean roots. Plant, Cell and Environment. 2008;31:1834–1843. doi: 10.1111/j.1365-3040.2008.01883.x. [DOI] [PubMed] [Google Scholar]
- Vance CP, Uhde-Stone C, Allan DL. Phosphorus acquisition and use: critical adaptations by plants for securing a nonrenewable resource. New Phytologist. 2003;157:423–447. doi: 10.1046/j.1469-8137.2003.00695.x. [DOI] [PubMed] [Google Scholar]
- Wang C, Ying S, Huang H, Li K, Wu P, Shou H. Involvement of OsSPX1 in phosphate homeostasis in rice. The Plant Journal. 2009;57:895–904. doi: 10.1111/j.1365-313X.2008.03734.x. [DOI] [PubMed] [Google Scholar]
- Wang C, Huang W, Ying Y, et al. Functional characterization of the rice SPX-MFS family reveals a key role of OsSPX-MFS1 in controlling phosphate homeostasis in leaves. New Phytologist. 2012;196:139–148. doi: 10.1111/j.1469-8137.2012.04227.x. [DOI] [PubMed] [Google Scholar]
- Wang X, Yan X, Liao H. Genetic improvement for phosphorus efficiency in soybean: a radical approach. Annals of Botany. 2010;106:215–222. doi: 10.1093/aob/mcq029. [DOI] [PMC free article] [PubMed] [Google Scholar]
- Wang YH, Garvin DF, Kochian LV. Rapid induction of regulatory and transporter genes in response to phosphorus, potassium, and iron deficiencies in tomato roots. Evidence for cross talk and root/rhizosphere-mediated signals. Plant Physiology. 2002;130:1361–1370. doi: 10.1104/pp.008854. [DOI] [PMC free article] [PubMed] [Google Scholar]
- Wang Z, Hu H, Huang H, Duan K, Wu Z, Wu P. Regulation of OsSPX1 and OsSPX3 on expression of OsSPX domain genes and Pi-starvation signaling in rice. Journal of Integrative Plant Biology. 2009;51:663–674. doi: 10.1111/j.1744-7909.2009.00834.x. [DOI] [PubMed] [Google Scholar]
- Wu P, Shou HX, Xu GH, Lian XM. Improvement of phosphorus efficiency in rice on the basis of understanding phosphate signaling and homeostasis. Current Opinion in Plant Biology. 2013;16:205–212. doi: 10.1016/j.pbi.2013.03.002. [DOI] [PubMed] [Google Scholar]
- Xu F, Liu Q, Chen LY, et al. Genome-wide identification of soybean microRNAs and their targets reveals their organ-specificity and responses to phosphate starvation. BMC Genomics. 2013;14:66. doi: 10.1186/1471-2164-14-66. [DOI] [PMC free article] [PubMed] [Google Scholar]
- Yang GZ, Ding GD, Shi L, Cai HM, Xu FS. Characterization of phosphorus starvation-induced gene BnSPX3 in Brassica napus. Plant and Soil. 2011;350:339–351. [Google Scholar]
- Yao Z, Liang C, Zhang Q, et al. SPX1 is an important component in the phosphorus signalling network of common bean regulating root growth and phosphorus homeostasis. Journal of Experimental Botany. 2014;65:3299–3310. doi: 10.1093/jxb/eru183. [DOI] [PMC free article] [PubMed] [Google Scholar]
- Zhou J, Jiao F, Wu Z, et al. OsPHR2 is involved in phosphate-starvation signaling and excessive phosphate accumulation in shoots of plants. Plant Physiology. 2008;146:1673–1686. doi: 10.1104/pp.107.111443. [DOI] [PMC free article] [PubMed] [Google Scholar]
Associated Data
This section collects any data citations, data availability statements, or supplementary materials included in this article.