Abstract
Long recognized as an evolutionarily ancient cell type involved in tissue homeostasis and immune defense against pathogens, macrophages are being rediscovered as regulators of several diseases including cancer. Here we show that in mice, mammary tumor growth induces the accumulation of tumor-associated macrophages (TAMs) that are phenotypically and functionally distinct from mammary tissue macrophages (MTMs). TAMs express the adhesion molecule Vcam1 and proliferate upon their differentiation from inflammatory monocytes, but do not exhibit an “alternatively activated” phenotype. TAM differentiation depends on the transcriptional regulator of Notch signaling, RBPJ; and TAM, but not MTM, depletion restores tumor-infiltrating cytotoxic T cell responses and suppresses tumor growth. These findings reveal the ontogeny of TAMs and a discrete tumor-elicited inflammatory response, which may provide new opportunities for cancer immunotherapy.
Macrophages are tissue-resident innate immune cells important in homeostasis and host defense against pathogens (1). These functionally diverse phagocytes differentiate from yolk sac-derived embryonic precursors, and locally self-renew both during steady state (2–4) and helminth infection (5). Additionally, bone marrow-derived monocytes give rise to macrophages in the intestine and the dermis (6, 7) as well as during acute infection and inflammation (8). However, the precise ontogeny and function of macrophages in chronic disorders, such as cancer, are incompletely understood (9).
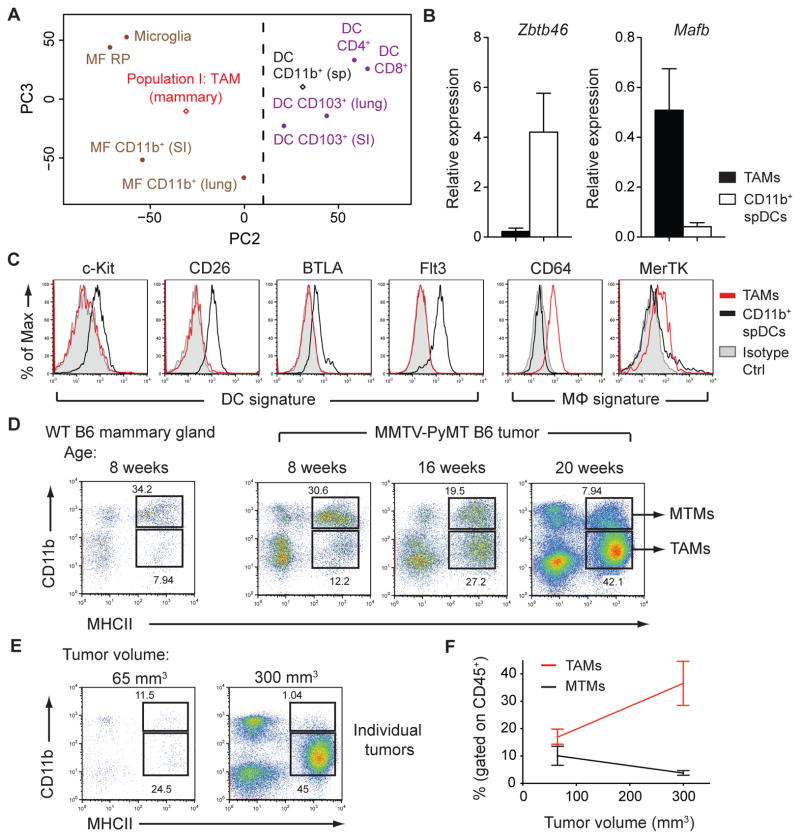
To investigate myeloid cells during cancer progression, we utilized the MMTV-PyMT (PyMT) mammary tumor model (10). Myeloid cells made up more than 50% of CD45+ tumor-infiltrating leukocytes and consisted of three major populations (I, II, & III), distinguishable by morphology and cell surface expression of major histocompatibility complex class II (MHCII), CD11b, Ly6C, Ly6G, CD11c, CD115, and F4/80 (fig. S1). Populations II and III phenotypically resembled Ly6C+ inflammatory monocytes and neutrophils, respectively, while population I expressed classical dendritic cell (DC) markers, MHCII and CD11c, and the macrophage marker, F4/80. Due to the ambiguity of characterizing cell populations using surface markers (11, 12), we sought to define these cells based on transcriptional phenotype (13). Using principal component analysis of DC and macrophage populations from the ImmGen Project (14, 15), we defined “population I” cells as tumor-associated macrophages (TAMs) because they clustered with macrophage subsets (Fig. 1A). A support vector machine learning algorithm corroborated this classification (fig. S2). Moreover, cells of population I did not express the DC lineage-specific transcription factor Zbtb46 or DC markers, c-Kit, CD26, BTLA, and Flt3, but expressed the macrophage transcription factor Mafb and macrophage markers CD64 and MerTK (14–16) (Fig. 1, B and C). Furthermore, Flt3L-deficient PyMT mice, which lack cells of the classical DC lineage (16), showed no defect in population I, confirming a pre-DC-independent origin of TAMs (fig. S3).
Figure 1. Macrophages Constitute the Dominant Myeloid Cell Population in Mammary Tumors.
(A) Principal component analysis of Population I: TAM (mammary) and CD11b+ splenic DC (sp) gene expression compared to populations collected by the Immunological Genome Project (GSE15907). Expression data are pooled from 2 replicate microarray experiments. (B) Expression of Zbtb46 and Mafb mRNA in sorted TAMs and CD11b+ splenic DCs (spDCs) relative to Actb as determined by qPCR (n=3). (C) Flow cytometric analysis of DC and macrophage (mFϕ) signature surface markers expressed on TAMs and CD11b+ spDCs. Data are representative of 2 independent experiments (D) Flow cytometric analysis of myeloid cell populations found in wild-type (WT) mammary glands and pooled tumors from 8-, 16-, and 20-week-old PyMT mice. Data are representative of 3 independent experiments. (E) Flow cytometry of TAM and MTM populations in individual tumors from the same mouse. (F) Pooled data of individual tumors as in (G) from multiple mice (n=3). Data are shown as mean ±SEM. Dot plots are gated on CD45+ leukocytes.
Macrophages populate mammary tissues during steady state and are required for mammary gland development (17). Upon tumor growth, we observed a decrease in the proportion of MHCIIhiCD11bhi cells found in untransformed wild type (WT) mammary glands and an increase in TAMs (Fig. 1D). We defined MHCIIhiCD11bhi cells as “mammary tissue macrophages” or “MTMs” because they also phenotypically resembled macrophages (fig. S4). TAM expansion was associated with the growth of individual tumors (Fig. 1, E and F), demonstrating that CD11blo TAMs, but not CD11bhi MTMs, are bona fide tumor-associated macrophages that accumulate with increased tumor burden.
Tissue-resident macrophage expansion or differentiation of macrophages from blood-borne precursors could account for TAM accumulation. To distinguish between these mechanisms, we connected congenically-marked PyMT mice using parabiosis (fig. S5A). We observed Ly6C+ inflammatory monocytes, MTMs, and TAMs from both parabionts in developing tumors (fig. S5, B and C), demonstrating that TAMs and MTMs required input from the circulation. The chimerism of inflammatory monocytes and T cells (fig. S4, C and D) was in accordance with published studies (2, 18, 19). This was in contrast to red pulp macrophages, which are maintained independently from monocytes (2) and consequently exhibited minimal chimerism (fig. S5C).
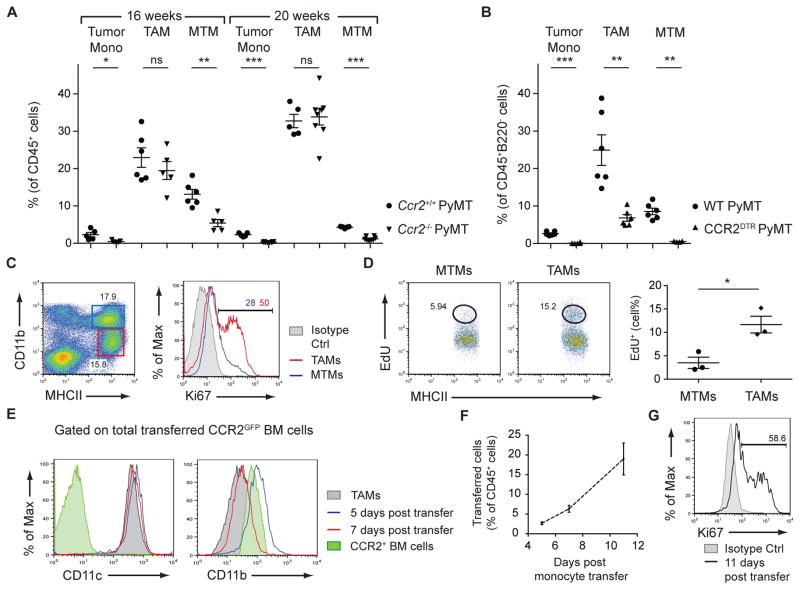
Circulating monocytes are critical progenitors for macrophages (20). To determine whether Ly6C+CCR2+ inflammatory monocytes contributed to TAMs and MTMs, PyMT mice were crossed to Ccr2−/− mice, which exhibit reduced circulating inflammatory monocytes due to impaired bone marrow egress (21). At 16 weeks, MTMs were significantly reduced in Ccr2−/− PyMT mice (Fig. 2A and fig. S6), implying that MTMs are constitutively repopulated by inflammatory monocytes. Due to the loss of both the monocyte and MTM populations (Fig. 2A and fig. S6), a concomitant increase in TAMs would be expected if their maintenance was independent of CCR2+ monocytes. However, the TAM percentage in Ccr2−/− PyMT mice was not significantly different compared to controls (Fig. 2A and fig. S6). Similar trends were observed in 20-week-old mice (Fig. 2A and fig. S6), suggesting that inflammatory monocytes contribute to MTMs, and to a lesser extent, TAMs.
Figure 2. TAMs Differentiate from CCR2+ Inflammatory Monocytes.
(A) Flow cytometric analysis of tumor monocytes (mono), TAMs, and MTMs from 16- and 20-week-old Ccr2+/+ PyMT and Ccr2−/− PyMT mice (n=5–8). Data are pooled from 5 independent experiments. (B) Flow cytometric analysis of tumor monocytes, TAMs, and MTMs from WT PyMT and CCR2DTR PyMT mice after DT treatment (mice were treated i.p. every 3 days, 7 treatments total) (n=6). Data are pooled from 4 independent experiments. (C) Ki67 staining in TAMs and MTMs from 16-week-old PyMT mice. Data are representative of 4 independent experiments. (D) EdU incorporation in MTMs and TAMs from 16-week-old PyMT mice 20 hours after intraperitoneal EdU injection. MTM and TAM populations are first gated on CD45+ cells and then gated as shown in (C). Data are representative of 2 independent experiments. (E) Surface expression of CD11c and CD11b on transferred CCR2+ bone marrow cells from CCR2GFP mice 5 and 7 days post transfer, gated on total transferred cells. (F) Percentage of total CD45+ leukocytes that are of CCR2GFP donor origin as identified by congenic marker 5, 7, and 11 days post transfer (n=3 per time-point). (G) Cell proliferation of transferred cells 11 days post transfer. Data are pooled from 3 independent experiments. All comparisons were made using student’s t test and data are shown as mean ±SEM. Statistical significance is indicated by *p< 0.05, **p< 0.01, ***p< 0.001; ns=not statistically significant.
To determine whether inflammatory monocytes were required for TAM maintenance, we generated CCR2DTR PyMT mice expressing diphtheria toxin receptor (DTR) under control of the Ccr2 locus (22). DT treatment resulted in 96% depletion of tumor-associated monocytes (Fig. 2B and fig. S7), compared to 80% depletion in Ccr2−/− mice (Fig. 2A and fig. S6). Using this more potent depletion strategy, both MTMs and TAMs were significantly reduced (Fig. 2B and fig. S7), suggesting that TAMs are derived from CCR2+ monocytic precursors, but require less input from the blood compared to MTMs. We considered that a higher proliferative capacity of TAMs compared to MTMs might account for their differing precursor requirement. Indeed, TAMs expressed higher levels of Ki67 staining and EdU incorporation relative to MTMs (Fig. 2, C and D).
To investigate whether monocytes could differentiate into TAMs in vivo, CCR2+ bone marrow cells isolated from CCR2GFP reporter mice (23) were transferred into congenically-marked CCR2DTR PyMT mice depleted of endogenous monocytes. At days 5, 7, and 11 post-transfer, we observed transferred cells in developing tumors (fig. S8A). Five and seven days post-transfer, we detected upregulation of F4/80, CD11c, and MHCII, and downregulation of Ly6C and CD11b on the transferred cells (Fig. 2E and fig. S8B). Additionally, transferred cells expanded and were Ki67+ 11 days post-transfer (Fig. 2, F and G). Transfer of hematopoietic stem cell-depleted CCR2+ bone marrow monocytes (CCR2+Flt3− c-Kit−) provided similar results (fig S9). Collectively, these observations demonstrate that tumor growth induces the differentiation of CCR2+ monocytes into TAMs.
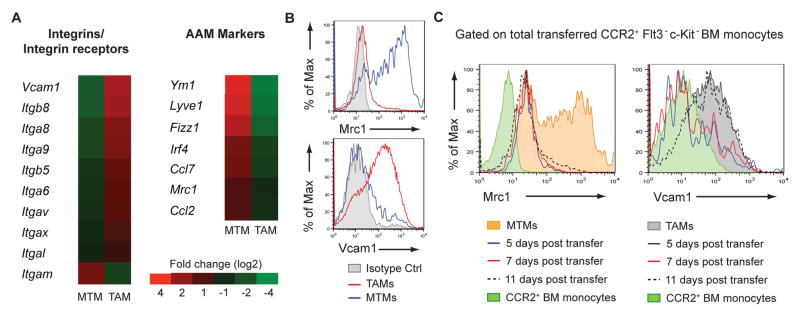
We performed gene-expression profiling to further distinguish TAMs from MTMs. As expected, the integrin CD11b (Itgam) was expressed at lower levels in TAMs than in MTMs (Fig. 3A). However, several other integrins and the integrin receptor Vcam1 were upregulated in TAMs (Fig. 3A). “M2” or alternatively-activated macrophages (AAMs), have been proposed to be associated with tumor progression (24). Surprisingly, we found that the TAM population did not express AAM markers such as Ym1, Fizz1, and Mrc1; instead, MTMs more closely resembled AAMs (Fig. 3A and fig S10). In line with the expression data, Vcam1 and Mrc1 (CD206) proteins were detected in TAMs and MTMs, respectively (Fig. 3B). Combining these markers with our monocyte transfer system, we addressed whether TAMs differentiated from MTMs. The lack of Mrc1 expression on transferred monocytes at all examined time points suggested that TAM differentiation from monocytes was a distinct pathway, rather than MTM conversion (Fig. 3C). Additionally, we detected Vcam1 upregulation on TAMs as a late differentiation event (Fig 3C). Altogether, we identified sequential phenotypic changes in monocytes during TAM differentiation (fig. S11).
Figure 3. TAMs are not Phenotypically AAMs and can be Identified by Vcam1 Expression.

(A) Gene expression of sorted TAMs and MTMs from 16-week-old PyMT mice. Data are pooled from 3 replicate microarray experiments (2 MTM samples and 3 TAM samples). Differentially expressed genes were determined with a p-value threshold of 0.05. Fold change is depicted using a log scale. (B) Flow cytometry of Vcam1 and Mrc1 expression on TAMs and MTMs. Data are representative of more than 5 independent experiments. (C) Mrc1 and Vcam1 expression on transferred CCR2+Flt3− c-Kit− bone marrow monocytes and their progenies at 5, 7, and 11 days post-transfer into DT-treated CCR2DTR PyMT recipients (n=2 mice per time-point). Mrc1 and Vcam1 expression on MTMs or TAMs, respectively, are shown for comparison.
The finding that TAMs did not resemble AAMs was unexpected, because the type 2 cytokine interleukin (IL)-4 produced by T cells and/or tumor cells has been implicated in TAM polarization (25, 26). Additionally, in other M2-polarizing environments, IL-4 is crucial for the expansion of tissue-resident macrophage populations (5). However, we found that Il4−/− PyMT mice had normal proportions of CD11bloVcam1+ TAMs (fig. S12, A to C). Furthermore, TAM differentiation was intact in the absence of lymphocytes (fig. S12, D to F). These observations suggest that TAMs are not AAMs, and their differentiation is not secondary to tumor-elicited adaptive immune responses.
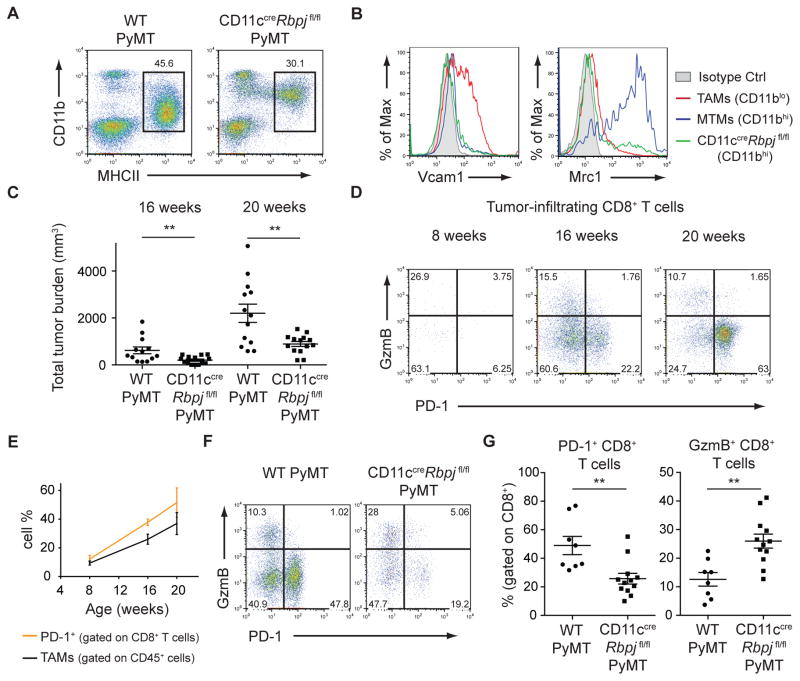
While investigating the mechanisms of TAM differentiation, we observed that TAMs display a gene expression signature (27) associated with the Notch signaling pathway (fig. S13). Notch signaling is a conserved developmental pathway instrumental in hematopoietic cell fate specification (28). In DCs, canonical Notch signaling mediated by the key transcriptional regulator, RBPJ, controls lineage commitment and terminal differentiation (27, 29, 30). To explore whether Notch signaling played a role in TAM differentiation, we used CD11ccre mice that efficiently deleted floxed DNA sequences to a greater extent in TAMs than MTMs, but not in monocytes or neutrophils (fig. S14). CD11ccreRbpjfl/fl PyMT mice exhibited a selective loss of MHCIIhiCD11blo TAMs (Fig. 4A). However, a MHCIIhiCD11bhi population still remained (Fig. 4A and fig. S15, A and B). Transcriptional profiling comparing this population to WT TAMs confirmed a loss of the Notch-dependent program in RBPJ-deficient cells (fig. S15C). MHCIIhiCD11bhi macrophages in CD11ccreRbpjfl/fl PyMT mice did not express the TAM marker Vcam1 or the MTM marker Mrc1 in most cells (Fig. 4B), suggesting that the majority are TAM intermediates. Moreover, we observed increased Ly6C− MHCII−/lo TAM precursors (fig. S11) in CD11ccreRbpjfl/fl PyMT mice compared to WT PyMT mice (fig. S15, D and E). These data reveal that in the absence of RBPJ, inflammatory monocytes are unable to terminally differentiate into TAMs.
Figure 4. RBPJ-dependent TAMs Modulate the Adaptive Immune Response.
(A) Flow cytometric data of myeloid populations in 20-week-old CD11ccre Rbpjfl/fl PyMT and WT PyMT mice. Plots are gated on CD45+B220− cells. Data are representative of more than 5 independent experiments. (B) Flow cytometry of Vcam1 and Mrc1 expression on TAMs and MTMs from WT PyMT mice and MHCII+ cells from CD11ccre Rbpjfl/fl PyMT mice. Data are representative of 3 independent experiments. (C) Total tumor burden of WT PyMT and CD11ccreRbpjfl/fl PyMT mice at 16 and 20 weeks of age (n=13–14). (D) Flow cytometric analysis of GzmB and PD-1 expression in CD8+ T cells infiltrating PyMT tumors at 8, 16, and 20 weeks. Data are representative of 3 independent experiments. (E) Quantification of TAMs (gated on CD45+ cells) and PD-1+CD8+ T cells (gated on CD45+TCRβ+CD8+ cells) from 8-, 16-, and 20-week-old PyMT mice (n=3 per time-point). (F) PD-1 and GzmB expression in CD8+ T cells from WT PyMT or CD11ccreRbpjfl/fl PyMT mice. Data are representative of more that 5 independent experiments. (G) Quantification of PD-1+ or GzmB+ CD8+ T cells as in (F) (n=8–12). Results represent pooled data and are shown as mean ±SEM. Student’s t test was performed and statistical significance is indicated by **p< 0.01.
The Mrc1+ cells found within the CD11bhi population in CD11ccreRbpjfl/fl PyMT mice (Fig. 4B) indicated that MTM differentiation was not compromised. To address the specificity of this RBPJ-dependent pathway during tumorigenesis, we analyzed non-PyMT mice. As expected, MHCIIhiCD11bhi MTMs from WT and CD11ccreRbpjfl/fl mammary glands expressed Mrc1 (fig. S16). MHCIIhiCD11blo myeloid cells were present in mammary glands from WT mice (Fig. 1D). However, these cells did not express Vcam1 (fig. S16A), and their differentiation was not affected in CD11ccreRbpjfl/fl mice (fig. S16B), suggesting that they are distinct from MHCIIhiCD11blo TAMs.
Associated with the TAM differentiation defect, CD11ccreRbpjfl/fl PyMT mice had reduced tumor burden (Fig. 4C). In Ccr2−/− PyMT mice, which have reduced MTMs (Fig. 2A and fig. S6), tumor development was unaffected (fig. S17A), implying a non-redundant function for RBPJ-dependent TAMs in promoting tumor growth. In the PyMT model, CD11c+ myeloid cells act as antigen-presenting cells, forming stable, yet unproductive, interactions with tumor-infiltrating T cells (12). We hypothesized that one tumor-promoting function of TAMs may be their control of the adaptive immune response. Granzyme B (GzmB) is a cytolytic molecule important for tumor immunosurveillance. Conversely, Programmed Death-1 (PD-1) is an inhibitory co-receptor denoting “exhausted” T cells. As PyMT tumors progressed, an increase in PD-1+GzmB− CD8+ T cells was observed (Fig. 4D), paralleling TAM expansion, with PD-1+ cells making up ~50% of late stage tumor-infiltrating CD8+ T cells (Fig. 4E). In CD11ccreRbpjfl/fl PyMT mice, the PD-1+ population decreased, while the GzmB+ population increased (Fig. 4, F and G). In contrast, the T cell phenotype in Ccr2−/− mice was unchanged (fig. S17, B to D). Classical DCs also delete RBPJ in the CD11ccreRbpjfl/fl system, so we examined Flt3L-deficient PyMT mice that lack cells of the DC lineage, but have a comparable TAM population (fig. S3). Flt3l−/− PyMT mice showed no difference in tumor growth or CD8+ T cell phenotype (fig. S17 E to H). These data suggest a specific function for RBPJ-dependent TAMs in promoting tumor immune tolerance in part by modulating the CD8+ T cell response (fig. S18).
Other RBPJ-dependent TAM functions, including non-immune regulatory roles, require further investigation. In addition, TAM differentiation is not completely abolished in the absence of RBPJ, raising the possibility that the remaining TAM intermediates may have tumor-promoting activities. Furthermore, to what extent TAM differentiation from monocytes occurs in other murine and in human tumors remains to be determined. Nonetheless, our findings suggest that a better understanding of this distinct tumor-elicited inflammatory response may create new opportunities for cancer treatment.
Supplementary Material
Acknowledgments
We thank T. Honjo for the Rbpj fl/fl mouse strain and B. Reizis for the CD11ccre mouse strain. We also thank J. Joyce and the M. Li lab for their insightful discussions. The data presented in this paper are tabulated in the manuscript paper and in the supplementary materials (accession # pending, dataset uploaded to Gene Expression Omnibus). R.A.F and M.O.L are listed as inventors on a patent application related to this work. This work was supported by the Cancer Research Institute Tumor Immunology Predoctoral Fellowship Training Grant (R.A.F), Cancer Research Institute Clinic and Laboratory Integration Program Grant (M.O.L.), and the American Cancer Society (M.O.L.).
Footnotes
References and Notes
- 1.Murray PJ, Wynn TA. Protective and pathogenic functions of macrophage subsets. Nature reviews Immunology. 2011 Nov;11:723. doi: 10.1038/nri3073. [DOI] [PMC free article] [PubMed] [Google Scholar]
- 2.Hashimoto D, et al. Tissue-Resident Macrophages Self-Maintain Locally throughout Adult Life with Minimal Contribution from Circulating Monocytes. Immunity. 2013 Apr 18;38:792. doi: 10.1016/j.immuni.2013.04.004. [DOI] [PMC free article] [PubMed] [Google Scholar]
- 3.Schulz C, et al. A lineage of myeloid cells independent of Myb and hematopoietic stem cells. Science. 2012 Apr 6;336:86. doi: 10.1126/science.1219179. [DOI] [PubMed] [Google Scholar]
- 4.Yona S, et al. Fate mapping reveals origins and dynamics of monocytes and tissue macrophages under homeostasis. Immunity. 2013 Jan 24;38:79. doi: 10.1016/j.immuni.2012.12.001. [DOI] [PMC free article] [PubMed] [Google Scholar]
- 5.Jenkins SJ, et al. Local macrophage proliferation, rather than recruitment from the blood, is a signature of TH2 inflammation. Science. 2011 Jun 10;332:1284. doi: 10.1126/science.1204351. [DOI] [PMC free article] [PubMed] [Google Scholar]
- 6.Jakubzick C, et al. Minimal differentiation of classical monocytes as they survey steady-state tissues and transport antigen to lymph nodes. Immunity. 2013 Sep 19;39:599. doi: 10.1016/j.immuni.2013.08.007. [DOI] [PMC free article] [PubMed] [Google Scholar]
- 7.Zigmond E, et al. Ly6C hi monocytes in the inflamed colon give rise to proinflammatory effector cells and migratory antigen-presenting cells. Immunity. 2012 Dec 14;37:1076. doi: 10.1016/j.immuni.2012.08.026. [DOI] [PubMed] [Google Scholar]
- 8.Shi C, Pamer EG. Monocyte recruitment during infection and inflammation. Nature reviews Immunology. 2011 Nov;11:762. doi: 10.1038/nri3070. [DOI] [PMC free article] [PubMed] [Google Scholar]
- 9.Wynn TA, Chawla A, Pollard JW. Macrophage biology in development, homeostasis and disease. Nature. 2013 Apr 25;496:445. doi: 10.1038/nature12034. [DOI] [PMC free article] [PubMed] [Google Scholar]
- 10.Guy CT, Cardiff RD, Muller WJ. Induction of mammary tumors by expression of polyomavirus middle T oncogene: a transgenic mouse model for metastatic disease. Mol Cell Biol. 1992 Mar;12:954. doi: 10.1128/mcb.12.3.954. [DOI] [PMC free article] [PubMed] [Google Scholar]
- 11.Lin EY, Nguyen AV, Russell RG, Pollard JW. Colony-stimulating factor 1 promotes progression of mammary tumors to malignancy. J Exp Med. 2001 Mar 19;193:727. doi: 10.1084/jem.193.6.727. [DOI] [PMC free article] [PubMed] [Google Scholar]
- 12.Engelhardt JJ, et al. Marginating dendritic cells of the tumor microenvironment cross-present tumor antigens and stably engage tumor-specific T cells. Cancer Cell. 2012 Mar 20;21:402. doi: 10.1016/j.ccr.2012.01.008. [DOI] [PMC free article] [PubMed] [Google Scholar]
- 13.Satpathy AT, Wu X, Albring JC, Murphy KM. Re(de)fining the dendritic cell lineage. Nat Immunol. 2012 Dec;13:1145. doi: 10.1038/ni.2467. [DOI] [PMC free article] [PubMed] [Google Scholar]
- 14.Gautier EL, et al. Gene-expression profiles and transcriptional regulatory pathways that underlie the identity and diversity of mouse tissue macrophages. Nat Immunol. 2012 Nov;13:1118. doi: 10.1038/ni.2419. [DOI] [PMC free article] [PubMed] [Google Scholar]
- 15.Miller JC, et al. Deciphering the transcriptional network of the dendritic cell lineage. Nat Immunol. 2012 Sep;13:888. doi: 10.1038/ni.2370. [DOI] [PMC free article] [PubMed] [Google Scholar]
- 16.McKenna HJ, et al. Mice lacking flt3 ligand have deficient hematopoiesis affecting hematopoietic progenitor cells, dendritic cells, and natural killer cells. Blood. 2000 Jun 1;95:3489. [PubMed] [Google Scholar]
- 17.Gouon-Evans V, Rothenberg ME, Pollard JW. Postnatal mammary gland development requires macrophages and eosinophils. Development. 2000 Jun;127:2269. doi: 10.1242/dev.127.11.2269. [DOI] [PubMed] [Google Scholar]
- 18.Jakubzick C, et al. Blood monocyte subsets differentially give rise to CD103+ and CD103-pulmonary dendritic cell populations. J Immunol. 2008 Mar 1;180:3019. doi: 10.4049/jimmunol.180.5.3019. [DOI] [PubMed] [Google Scholar]
- 19.Liu K, et al. In vivo analysis of dendritic cell development and homeostasis. Science. 2009 Apr 17;324:392. doi: 10.1126/science.1170540. [DOI] [PMC free article] [PubMed] [Google Scholar]
- 20.Geissmann F, et al. Development of monocytes, macrophages, and dendritic cells. Science. 2010 Feb 5;327:656. doi: 10.1126/science.1178331. [DOI] [PMC free article] [PubMed] [Google Scholar]
- 21.Serbina NV, Pamer EG. Monocyte emigration from bone marrow during bacterial infection requires signals mediated by chemokine receptor CCR2. Nat Immunol. 2006 Mar;7:311. doi: 10.1038/ni1309. [DOI] [PubMed] [Google Scholar]
- 22.Hohl TM, et al. Inflammatory monocytes facilitate adaptive CD4 T cell responses during respiratory fungal infection. Cell Host Microbe. 2009 Nov 19;6:470. doi: 10.1016/j.chom.2009.10.007. [DOI] [PMC free article] [PubMed] [Google Scholar]
- 23.Serbina NV, et al. Selective expansion of the monocytic lineage directed by bacterial infection. J Immunol. 2009 Aug 1;183:1900. doi: 10.4049/jimmunol.0900612. [DOI] [PMC free article] [PubMed] [Google Scholar]
- 24.Sica A, Mantovani A. Macrophage plasticity and polarization: in vivo veritas. J Clin Invest. 2012 Mar 1;122:787. doi: 10.1172/JCI59643. [DOI] [PMC free article] [PubMed] [Google Scholar]
- 25.DeNardo DG, et al. CD4(+) T cells regulate pulmonary metastasis of mammary carcinomas by enhancing protumor properties of macrophages. Cancer Cell. 2009 Aug 4;16:91. doi: 10.1016/j.ccr.2009.06.018. [DOI] [PMC free article] [PubMed] [Google Scholar]
- 26.Wang HW, Joyce JA. Alternative activation of tumor-associated macrophages by IL-4: priming for protumoral functions. Cell Cycle. 2010 Dec 15;9:4824. doi: 10.4161/cc.9.24.14322. [DOI] [PMC free article] [PubMed] [Google Scholar]
- 27.Satpathy AT, et al. Notch2-dependent classical dendritic cells orchestrate intestinal immunity to attaching-and-effacing bacterial pathogens. Nat Immunol. 2013 Sep;14:937. doi: 10.1038/ni.2679. [DOI] [PMC free article] [PubMed] [Google Scholar]
- 28.Radtke F, Macdonald HR, Tacchini-Cottier F. Regulation of innate and adaptive immunity by Notch. Nature reviews. Immunology. 2013 May 13; doi: 10.1038/nri3445. [DOI] [PubMed] [Google Scholar]
- 29.Caton ML, Smith-Raska MR, Reizis B. Notch-RBP-J signaling controls the homeostasis of CD8-dendritic cells in the spleen. J Exp Med. 2007 Jul 9;204:1653. doi: 10.1084/jem.20062648. [DOI] [PMC free article] [PubMed] [Google Scholar]
- 30.Lewis KL, et al. Notch2 receptor signaling controls functional differentiation of dendritic cells in the spleen and intestine. Immunity. 2011 Nov 23;35:780. doi: 10.1016/j.immuni.2011.08.013. [DOI] [PMC free article] [PubMed] [Google Scholar]
- 31.Waskow C. Generation of parabiotic mice for the study of DC and DC precursor circulation. Methods Mol Biol. 2010;595:413. doi: 10.1007/978-1-60761-421-0_27. [DOI] [PubMed] [Google Scholar]
- 32.Irizarry RA, et al. Summaries of Affymetrix GeneChip probe level data. Nucleic acids research. 2003 Feb 15;31:e15. doi: 10.1093/nar/gng015. [DOI] [PMC free article] [PubMed] [Google Scholar]
- 33.Chang CC, Lin CJ. LIBSVM: A Library for Support Vector Machines. Acm T Intel Syst Tec. 2011;2 [Google Scholar]
Associated Data
This section collects any data citations, data availability statements, or supplementary materials included in this article.


