Abstract
Exposure to bright light appears to be protective against myopia in both animals (chicks, monkeys) and children, but quantitative data on human light exposure are limited. In this study, we report on a technique for quantifying light exposure using wearable sensors. Twenty-seven young adult subjects wore a light sensor continuously for two weeks during one of three seasons, and also completed questionnaires about their visual activities. Light data were analyzed with respect to refractive error and season, and the objective sensor data were compared with subjects’ estimates of time spent indoors and outdoors. Subjects’ estimates of time spent indoors and outdoors were in poor agreement with durations reported by the sensor data. The results of questionnaire-based studies of light exposure should thus be interpreted with caution. The role of light in refractive error development should be investigated using multiple methods such as sensors to complement questionnaires.
Keywords: sunlight, photometry, outdoor exposure, light intensity, light sensor, myopia
1. Introduction
As myopia prevalence continues to rise globally, the contributions of the visual environment to excessive eye growth are receiving increased attention [1]. Genetic factors alone cannot explain the steep increases in prevalence recorded in many countries, such as in South Korea where over 96% of young adult males in Seoul were recently reported to be myopic [2]. There is accumulating evidence for the protective effect of outdoor exposure, with a number of recent questionnaire-based studies linking reduced myopia risk in children with more outdoor exposure [3–5]. While there are a number of potential explanations for the apparent protective effect of outdoor exposure, studies using animal models of myopia suggest light exposure may be the crucial variable.
Excessive axial elongation and myopia can be induced in chicks, guinea pigs, tree shrews, and monkeys using form-depriving diffusers, which reduce retinal contrast and high spatial frequencies [6]. Intriguingly, bright light exposure appears to have a significant protective effect against form deprivation myopia in most animals. In chickens, a short 15-minute daily dose of bright light (15,000 lux) and sunlight were both found to counteract the myopigenic effects of form deprivation that normally manifest under standard indoor illumination [7]. Moreover, this effect appears to be mediated by retinal dopamine [8], which is released on a diurnal cycle when animals are reared under normal diurnal lighting conditions [9]. Similar findings have been reported for tree shrews [10] and monkeys [11]. For example, in one study most, though not all, of the monkeys wearing form-depriving diffusers remained hyperopic under bright light conditions [11]. The effect of bright light on myopia induction via negative defocusing lenses is more variable and typically less robust [12], and in the case of monkeys, negligible [13]; this paradigm, rather than form deprivation, also more closely reflects human myopia development. Nonetheless, the strong anti-myopigenic effects of bright light seen in form-deprived animals together with human epidemiological data on outdoor exposure have spurred interest in the possibility of a ‘light treatment’ being developed to counter excessive myopia progression in children.
While animal studies have convincingly established the importance of normal visual experience and a regular light/dark cycle for emmetropization [9] (normal eye growth that eliminates neonatal refractive error), in humans the role of vision and light per se in abnormal eye growth patterns, including myopia, remains a topic of debate. The lack of predictability in human behavior and the frequent exposure of individuals to numerous different light environments make characterizing light exposure patterns particularly challenging. Based on parentally-completed visual activity questionnaires [3–5], lower rates of myopia have been found in children who spend more time outdoors, yet the critical factor mediating this effect is unknown. If animal studies are to be used as a guide, transient bright light exposure [7] or temporal modulation of light reaching the retina [14] might underpin this anti-myopigenic effect. Analogous interventions, such as taking outdoor breaks, are currently being evaluated in human clinical trials [15,16], as the bulk of questionnaire-based myopia studies support an association between light and lower myopia levels [1]. The efficacy of sunlight, bright light, and/or outdoor exposure in human myopia development is far from clear, however, as some studies have failed to find an association between time spent outdoors and myopia [17,18], and another found that less daily exposure to darkness (i.e. more light exposure) was associated with myopia progression in students [19]. Together these studies raise many as yet unanswered questions about the influence of light intensity, duration, and timing of exposure, and perhaps even seasonal variations [20], on myopic eye growth.
In human myopia studies, information about the visual environment has traditionally been inferred from data collected through questionnaires, which are subject to errors in estimation and memory biases when retrospectively administered. Poor agreement between reports of daily and weekly activities from children and their parents have also been noted [21]. As a quantitative alternative to questionnaires, wearable light sensors were deployed in two small-scale studies of myopic children. Backhouse et al. [22] found cumulative light exposure and refractive error to be uncorrelated in their 12 subjects, but did not administer concurrent visual activity questionnaires. In a second study, Dharani et al. [23] compared two measures of light exposure and time outdoors (a diary and a sensor) over one week and also found poor agreement between the two. Schmid et al. [24] investigated light exposure in young adults and found no difference between myopes and emmetropes in daily light levels or time spent in sunlight, though UV levels (measured with a separate polysulfone badge) were different between emmetropes, stable myopes, and progressing myopes. Studies of light exposure unrelated to vision or myopia have shown that adults tend to spend little time in bright light [25], and that season and geographic location can greatly influence outdoor exposure levels [26].
In this study, we deployed wearable light sensors, identical to those used in the above studies [22–24], for measuring ambient light exposure in young adults. Light exposure data, along with sunlight and weather data and ocular measurements, were collected in three groups of subjects during three seasons in temperate Northern California. Subjects also estimated how much time they spent indoors and outdoors, allowing comparison of questionnaire-based responses (the typical measure of outdoor exposure) to data obtained objectively via the sensors. We also explored the influence of sampling frequency on the quality of the data collected via these methods. Our use of young adults compared to children in the two previous studies involving light sensors allowed a further examination of the reliability of questionnaire-based data. Isolating light as a factor in the outdoor experience using objective measures could refine our understanding of the etiology of myopia and inform behavioral interventions to retard its progression in children.
2. Materials and methods
Twenty-seven students (17 females, 10 males) from the University of California, Berkeley, aged 18–25 years, participated in this study. Twenty-three were classified as myopic (spherical equivalent refraction ≤−1.0 diopters (D), with a range of −1.06 to −8.56 D), and the remaining four subjects were approximately emmetropic (0 ± 0.5 D). Refractions were measured with a Grand Seiko WR-5100K autorefractor without cycloplegia as part of an initial vision screening, which also included a general ocular health assessment and visual acuity, accommodation, and axial length measurements (IOL-Master, Carl Zeiss Meditec). Subjects completed a myopia history (including progression), visual behavior, and activity questionnaire based on a published myopia risk factor questionnaire [27]. Visual activity questions included estimates of time spent in near-work (reading, computer use, etc.) and sports, both indoors and outdoors, on both a typical weekday and weekend (judgment of typicality was subjective, but participants were students with fairly repetitive and regular schedules). Subjects were also asked to estimate the typical amount of time spent indoors and outdoors and, for the results reported here, these numerical estimates are the only activity questionnaire data that we address. Detailed methods, including device technical specifications, photometry, and questionnaire, have been previously described [28]. All subjects gave their informed consent to participate. This study was approved by the Committee for Protection of Human Subjects at the University of California, Berkeley and followed the tenets of the Declaration of Helsinki.
Light exposure data were collected during three different seasons, with seven subjects participating in spring, 10 in fall, and 10 in winter. Data were collected from 30 March–13 April 2011 (spring), 3–17 November 2011 (fall), and 23 February–8 March 2012 (winter). Data collection was simultaneous for all subjects during each season, and took place over 14 consecutive days. During these periods, subjects were engaged in lectures and other school-related activities on campus on most weekdays. Subjects were each given a light sensor (HOBO Pendant UA-002-64, Onset Computer Corp.), which was worn on the upper arm, mounted on a custom pedestal attached to a Velcro armband and pointing skyward (due to its cosine-dependent response profile). This sensor has a peak sensitivity at 900 nm, with a broader wavelength catch than the human photopic function. Subjects were instructed to wear the sensor all day, every day, and to place it by their bed when they went to sleep. Daily text message reminders were sent to the subjects every morning to encourage compliance. The light sensors recorded the instantaneous ambient light intensity in lux every 10 seconds. Only data between the hours of sunrise and sunset each day were used for analysis; a similar strategy, i.e. fixed daily time window, was used in a previous light sensor study [23] to align light sensor data with subjects’ daily activities. Sunrise and sunset times for Berkeley, California were calculated using the Almanac for Computers [29] implemented in MATLAB and verified against the National Oceanic and Atmospheric Administration’s online solar calculator [30].
Weather data for the study period were obtained from the pyranometer weather station (LI200S, Campbell Scientific) at Lawrence Berkeley National Laboratory [31], adjacent to the University of California campus. These data were recorded every 15 minutes and included precipitation and solar radiation. The solar radiation data, in W/m2, were converted to lux using a published conversion factor (table 1 in [32]). The pyranometer has a wavelength range of 400–1100 nm, and is cosine-corrected to catch light from wide angles of incidence. To differentiate time spent indoors from time spent outdoors, we assigned a threshold criterion of 1000 lux, identical to that used by both Backhouse et al. [22] and Dharani et al. [23]. Measurements ≥1000 lux were labeled ‘outdoor exposure’. Typical indoor lighting levels are in the range 100–1000 lux [33], and for the indoor environments representative of those frequented by our study participants (offices, laboratories, libraries, and coffee shops in five buildings that we surveyed on the University of California campus), sampled light levels never exceeded 1000 lux.
3. Results
It is not known a priori which light exposure dimensions are relevant to myopia and eye growth regulation. Light sensor data collected in this study were analyzed in terms of temporal variations, intensity, and cumulative light exposure. Sensor data were also used to assess the reliability of subjective estimates of time spent indoors and outdoors. Additionally, seasonal variations in light exposure were examined.
3.1. Light intensity
Daily maximum light exposure varied greatly, both within and between subjects. Daily maxima ranged from 102 to around 3 × 10⁵ lux. Subjects were exposed to bright sunlight (>105 lux) on almost all days; only 23.5% of subject-days (89 out of 378) had maxima below 105 lux. Most of these days (54) occurred in the fall period, while the fewest (10 days) were in the spring period. The 14-day means of intensity maxima are shown in Figure 1 as a function of season. Ambient light intensity varied during and between days by orders of magnitude, with subjects’ bright light exposure often being very momentary, and not necessarily tied to the day’s weather, as described in [28]. The mean light intensity across all subjects over their 14-day exposures was 2232 ± 1261 lux for spring, 857 ± 472 lux for fall, and 1591 ± 934 lux for winter. These values are much lower than mean measured sunlight intensities from the pyranometer during the same periods: 44,273 ± 39,970, 10,882 ± 59,448, and 22,563 ± 41,107 lux, respectively. These values mirror the changes in day length and thus available sunlight across seasons (Table 1). At best, subjects were experiencing average light levels comparable to an overcast day.
Figure 1.
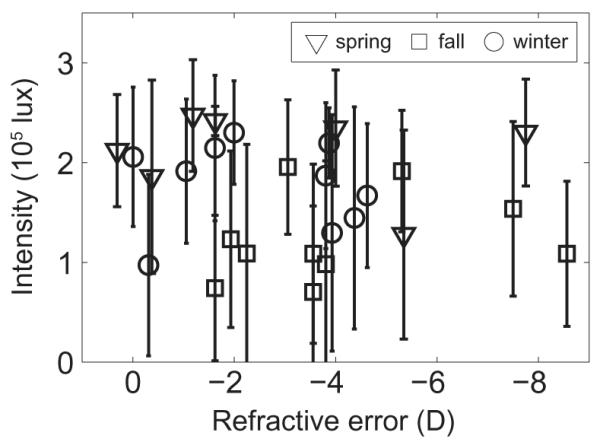
Mean maximum daily light intensity (lux) over 14 days plotted against subject refractive error, for spring, winter, and fall study periods. Error bars are standard errors.
Table 1.
Mean seasonal light data: daylight hours (sunrise to sunset), integrated solar radiation from the pyranometer (lux-hours), and daily hours spent outdoors and indoors from sensor data and questionnaire estimates. Sensor data and questionnaire estimates pairs significantly different at p < 0.03 (**) and p < 0.01 (*) (two-tailed t-tests).
| Season |
|||
|---|---|---|---|
| Metric | spring | fall | winter |
| Mean hours of daylight | 12.68 ± 0.18 | 10.15 ± 0.15 | 11.26 ± 0.19 |
| Total solar lux-hours | 1.30 × 10⁷ | 4.70 × 10⁶ | 6.94 × 10⁶ |
| Mean outdoor exposure hours: light sensor | 1.57 ± 1.22 * | 1.27 ± 1.18 * | 1.23 ± 1.18 * |
| Mean outdoor exposure hours: estimate | 4.00 ± 1.42 * | 3.35 ± 1.85 * | 4.15 ± 1.93 * |
| Mean indoor exposure hours: light sensor | 11.12 ± 1.23 ** | 8.88 ± 1.17 * | 10.03 ± 1.19 |
| Mean indoor exposure hours: estimate | 12.14 ± 2.66 ** | 13.20 ± 1.48 * | 10.35 ± 2.60 |
3.2. Cumulative light exposure
To facilitate future comparisons with similar studies of different durations and in different seasons, we developed a solar-normalized index of light exposure. Cumulative lux-hours were calculated by taking the integral for each subject’s intensity data over each study period. The same was done for the solar radiation data, for the same study periods (see Table 1). The ratio of these values is solar-normalized cumulative light exposure, as shown in Figure 2. Most subjects were exposed to less than 10% of the available sunlight over each 14-day study period. The mean for spring was 5.57 ± 3.22%, for fall 6.01 ± 3.32%, and for winter 7.31 ± 4.47%. Seasonal differences in light exposure were not evident, implying that exposure to daylight was similar across the three seasons for our subjects. Nonetheless, the absolute amount of light logged by the sensors did differ across seasons, being greatest in spring and lowest in fall.
Figure 2.
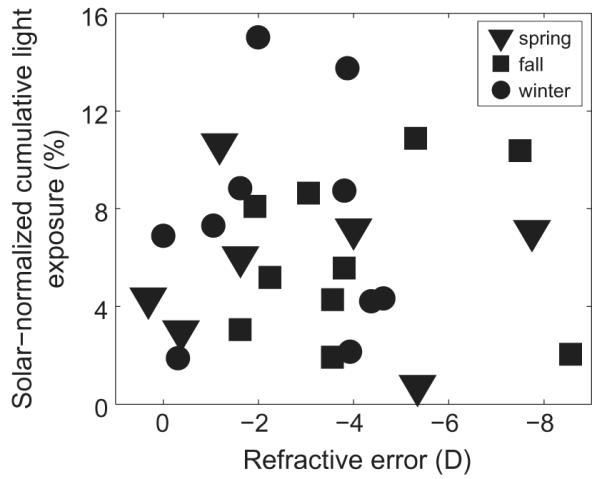
Solar-normalized cumulative light exposure, i.e. the percentage of available light that subjects were exposed to during each season, plotted against subject refractive error, for spring, winter, and fall study periods.
3.3. Duration of outdoor exposure
Subjects typically spent less than 20% of the day outdoors (≥1000 lux) (Figure 3). By season, the 14-day mean daily percentage of time spent outdoors across subjects was 12.35 ± 5.16% in spring, 12.49 ± 5.96% in fall, and 10.91 ± 5.53% in winter (see Table 1 for further details). The number of subject-days on which less than one hour was spent outdoors was 17 for spring, 39 for fall, and 30 for winter.
Figure 3.
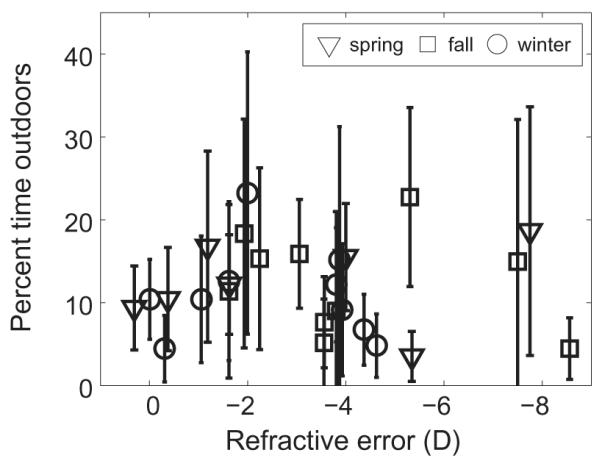
Mean percentage of daily time spent outdoors (≥1000 lux) over 14 days, plotted against subject refractive error, for spring, winter, and fall study periods. Error bars are standard errors.
Because bright light is believed by some to be protective against myopia [7,8,11], additional analyses were undertaken to examine the daily exposure of subjects to bright sunlight. A cut-off of >105 lux was used in this analysis. Of the daily time spent outdoors, typically less than 15 min involved exposure to bright sunlight, with such exposure being most restricted in the fall period (Figure 4). Mean daily bright light exposures for spring, fall, and winter were 11.20 ± 7.08, 3.19 ± 2.29, and 7.86 ± 4.90 min, respectively. These values represent 5–10% of total outdoor time, although the remainder of outdoor exposure also involved relatively high light levels (anything from 1000 to 105 lux).
Figure 4.
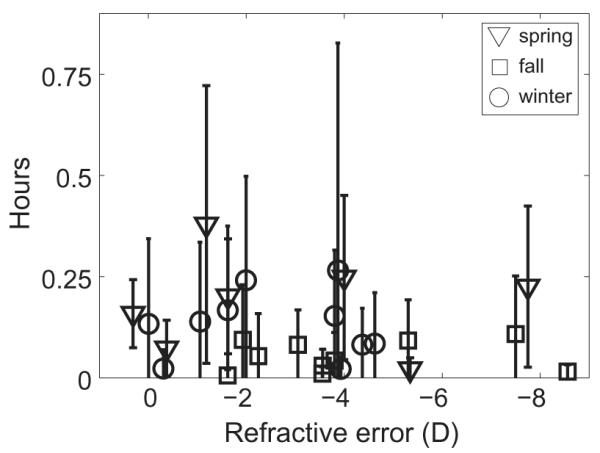
Mean daily hours spent in bright sunlight (>105 lux) over 14 days, plotted against subject refractive error, for spring, winter, and fall study periods. Error bars are standard errors.
As a measure of the frequency of intensity changes, the number of indoor-to-outdoor and outdoor-to-indoor transitions were calculated (i.e. the number of times the threshold of 1000 lux was crossed). These transitions may represent voluntary breaks from classes or study taken by the subjects, and are of potential interest, given that temporal modulation patterns of visual experience and light exposure appear to influence eye growth, based on animal model studies [34]. By season, the mean daily transitions were 63.2 ± 19.7, 51.4 ± 31.1, and 53.1 ± 27.1 for spring, fall, and winter, respectively (Figure 5). These data predict intensity changes occurring, on average, every 15.2 min in spring, 12.2 min in fall, and 13.5 min in winter. The short durations of outdoor exposure described above, however, realistically preclude such frequent transitions. Instead, at least some of these transitions across the 1000 lux criterion likely represent occasional exposure to unusually bright light indoors or transient dimming of light levels outdoors created by passing clouds or shadows. The number of daily transitions rarely exceeded 150 for most subjects and showed clustering, consistent with stereotyped behavior and long periods of sustained activity without lighting ‘breaks’.
Figure 5.
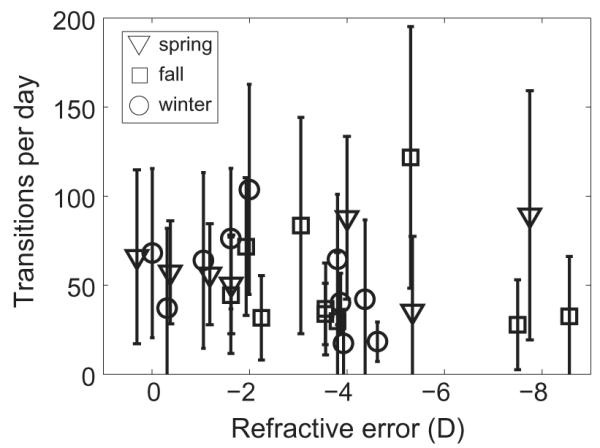
Frequency of intensity changes (mean daily indoor/outdoor and outdoor/indoor transitions over 14 days), plotted against subject refractive error, for spring, winter, and fall study periods. Error bars are standard errors.
3.4. Indoor and outdoor exposure: estimates vs. sensor data
One of the main aims of this study was to investigate the accuracy of self-report data gathered via questionnaires. As described in the methods, subjects were asked to give an estimate of time spent indoors and outdoors on a typical day. These estimates were compared against the durations of indoor and outdoor exposure logged by the light sensors. The general trend across seasons was an overestimation in questionnaire responses of time spent both indoors and outdoors, compared with sensor data (Figure 6). Estimates and sensor data were statistically significantly different for both indoor and outdoor values for spring, for both indoor and outdoor values for fall, and for the outdoor value for winter (see Table 1 caption). The means of the estimates and sensor data, grouped by season, are shown in Figure 7 and Table 1 (bottom four rows).
Figure 6.
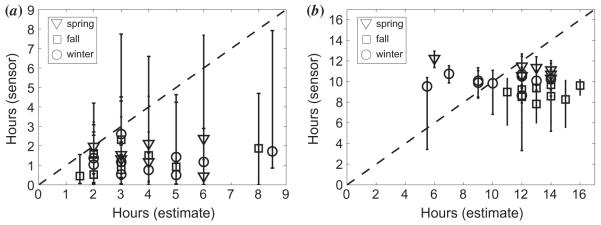
Mean hours from sensor data over 14 days plotted against subject questionnaire estimates for (a) outdoor and (b) indoor exposure, for spring, winter and fall study periods. Error bars represent the range.
Figure 7.
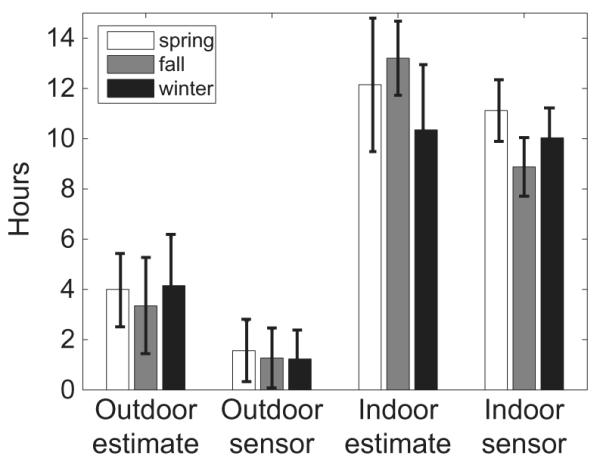
Indoor and outdoor questionnaire estimates and sensor data (mean hours per day), for spring, winter and fall study periods. Error bars are standard errors. All sensor-estimate pairs are significantly different except for indoor during winter, see Table 1.
3.5. Effects of sampling frequency
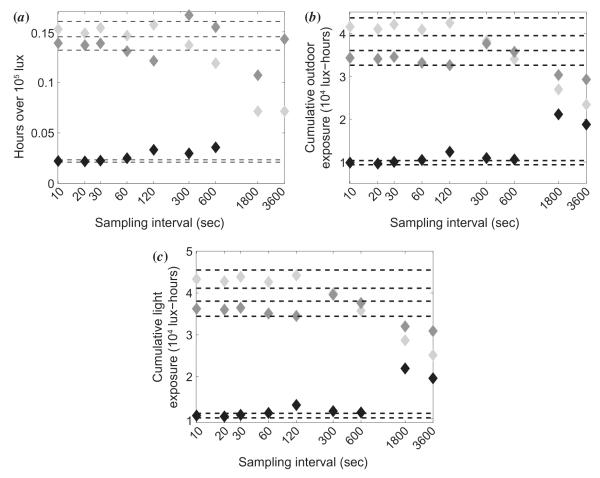
The sampling interval used here was 10 s, which was chosen as a compromise between good temporal resolution and being able to record continuously for the entire study period with the sensor’s 64 kB memory limit. To examine the plausibility of using a lower sampling frequency without loss of critical temporal behavior information, some of our data were reanalyzed. Representative data are shown for three subjects in Figure 8. Data derived using coarser sampling rates were compared to the original data derived using 0.1 Hz sampling. In general, sampling less frequently than every 120 s (0.008 Hz) caused a deviation of ± 5% or greater from the original measurement. Hours spent in bright sunlight (Figure 8(a)), cumulative outdoor exposure (Figure 8(b)), and total cumulative exposure (Figure 8(c)) all show large variation from the ± 5% error bounds, especially at sampling intervals of 600, 1800, and 3600 s. In contrast, values derived using 10 to 120 s sampling intervals are relatively stable. A sampling interval of two minutes or less thus appears preferable for faithfully capturing the ambient light exposure signal.
Figure 8.
Effect of different sampling intervals on (a) hours spent in bright sunlight, (b) cumulative outdoor exposure, and (c) total cumulative light exposure. Dashed lines indicate ± 5% of the original values for a 10 s sampling interval. The different grayscale symbols represent three different subjects.
4. Discussion
Few studies have been undertaken to specifically address light exposure in human myopia. A widely cited study in the field found increased outdoor exposure to be associated with lower odds of myopia [3]. In that study data were collected from questionnaires administered to parents, and the authors concluded that the protective outdoor effect was due to increased light levels, although no direct measurements of light exposure were taken.
Here we deployed an objective method of quantifying light exposure to validate and expand on questionnaire-based studies that link increased outdoor or light exposure with reduced myopia. The subjects in this study were young adults, including mostly myopes and four emmetropes, some of whom were still progressing (n = 9), and who (as students) are subject to many of the same myopigenic factors as young children developing myopia [20]. Interestingly, estimates of time spent indoors and outdoors do not appear markedly different from equivalent values reported for pre-teens and younger children in two previous studies using light sensors [22,23], presumably reflecting the general trend in the developed world toward sedentary, indoor lifestyles.
A closer examination of the data from the Backhouse et al. study [22] reveals many similarities with the findings of the current study, although their study was confined to one season (winter) and involved only a small sample of children in New Zealand. For example, Backhouse et al. found that their subjects spent little time outdoors and were exposed to only 5.72% of the available sunlight over the study period (cf. 7.31% during winter, and 6.30% across all seasons in the young adult sample of the present study). Their subjects received a large proportion of their light exposure while outdoors and the same was true in the present study, where time outdoors accounted for an average of 82% of light exposure. On the other hand, Backhouse et al. reported a poor correlation between time spent outdoors and cumulative light from outdoor exposure. Essentially, some subjects spent more time outdoors but were not exposed to bright light, and others received a large bright dose with a short outdoor duration. In contrast, in the present study time outdoors and cumulative light from outdoors were strongly correlated (r = 0.71, p < 0.01). Backhouse et al. found no refractive error correlations with cumulative light exposure, or with rate of change in light levels, a result that is mirrored in the present study.
Significant differences between subjects’ indoor and outdoor estimates and durations reported by the sensor were found in all but one case (see Table 1). Subjects’ indoor and outdoor estimates are based on their individual awake windows which, being unknown to the investigator, must be roughly approximated by daylight hours. The use of a restricted time window in analyzing light sensor data may partly account for discrepancies in indoor estimates (subjects were not instructed to limit their responses to daylight hours only, but were instructed to exclude time spent sleeping) but cannot account for discrepancies in outdoor estimates. Outdoor estimates truly were inaccurate, because there is never daylight outside the fixed sunrise-sunset window. However, the subjects’ indoor estimates likely include awake evening hours, which were excluded by the sunset-sunrise criterion used to set the time window for analysis of sensor data. We therefore cannot conclude that the observed significant differences between indoor estimates and indoor sensor durations are meaningful. Dharani et al. [23] also used a restricted time window in their comparison, and reported poor agreement between questionnaire and light sensor data.
The poor agreement between estimates and sensor data suggests that questionnaires are an unreliable and suboptimal method for estimating outdoor activity or sunlight exposure. Many questionnaires, including the one used here, limit the respondent to a single integer value for a given question (“How many hours do you spend indoors/outdoors in a day?”). Attempts to improve the temporal resolution of questionnaires by using finer-grained questions (“How many hours were spent reading under a tree outside?”) would likely result in lengthy lists of questions about episodes that are too short for a typical person to be aware of, much less remember, effectively increasing the noise. In reality, nothing approaching the resolution of 0.1 Hz, the sampling rate of the light sensor, is attainable with questionnaires.
The use of a high sampling frequency minimizes the risk of losing potentially informative data such as infrequent high intensity events. For example, in the case of our university student population, walking from one building to another between lectures may only take a few minutes. Even though daily outdoor time was found to be limited, sometimes on the order of minutes, a coarser sampling frequency (<0.008 Hz) is nonetheless inadvisable for capturing the brief events that constitute the majority of total light exposure. A previous light exposure study using the same sensor sampled ambient light intensity every five minutes [23]. However, large changes can occur in activity level, location, and light exposure over five minutes, especially in the active life of a child or adolescent. To faithfully capture the temporal characteristics of a data signal, it must be sampled at twice the frequency of the signal, according to the Nyquist sampling theorem [35]. In this case, the ambient light exposure signal is highly irregular and non-periodic, and so the minimum recommended sampling rate (Nyquist frequency) is difficult to determine and can be highly subject, task, and weather-dependent. If the profile of the ambient light exposure signal is not known a priori, as is the case here, sampling should be as frequent as possible for faithful reconstruction of the original signal. If clinically meaningful data are to be obtained and recommendations made with regard to outdoor and sun exposure as potential myopia therapies, it is paramount that objective measurements, such as those obtainable with small, high-capacity and high-precision sensing and monitoring devices, be employed to complement or replace questionnaires.
The wider deployment in myopia studies of light sensors and other portable electronic monitoring technology to directly quantify exposure and behavior could enhance our understanding of what in outdoor exposure is beneficial, if anything. For example, the GOAL myopia light treatment study has reported small but clinically insignificant effects of the one extra daily hour of outdoor exposure in their myopia intervention group, leading the authors to conclude that “greater exposures will be required to obtain clinically significant effects” [15,16]. Broad statements like these could be clarified with objective data, such as those from light sensors. ‘Greater exposures’ are not necessarily uniformly better, in myopia or vision in general, and a more analytical approach like that employed here is warranted.
The addition of localized weather data provides an important calibrating factor that was absent in the other two previous studies using light sensors. First, data on local solar radiation allow for seasonal comparisons to be made, and can facilitate interpretation of subjects’ indoor and outdoor behavior with respect to daylight length. In the Dharani et al. study [23], for example, data collection was spread over a period of two months rather than confined to the same week for all subjects. Thus the light sensor data for individual subjects are potentially confounded by differences in weather patterns. Second, local solar radiation levels can act as a guide for selecting a site and season-specific indoor/outdoor threshold. The two other light sensor studies in the field have converged on the 1000 lux criterion without strong justification. The present study initially used a criterion of 882 lux for differentiating between indoor and outdoor exposure. This value was selected based on local solar radiation data, outdoor measurements on a typical day during the study period, and indoor measurements specific to the locale of this study. While this initial criterion value of 882 lux was significantly higher than any indoor intensity values recorded (data not shown), analyses of light sensor data in the present study with criteria of 882 and 1000 lux did not yield significantly different outcomes. For the sake of consistency with the studies of Backhouse et al. [22] and Dharani et al. [23], a criterion of 1000 lux was adopted for the analyses in the present study.
The methods outlined here can improve the accuracy of data collection for epidemiological studies of myopia. We found significant disagreement between data gathered using the existing experimental paradigm (the visual activity questionnaire) and the novel light sensor approach. In the present study the sample sizes in the two refractive error groups do not allow us to draw any conclusions about myopia and outdoor or light exposure; limited time period, and cross-sectional study design are other limitations. Further, time spent outdoors and visual activities are different in children and our young adult subjects. Nonetheless, just as there appear to be no refraction-related differences in our data, Backhouse et al. [22] also found no correlation between refractive error and either cumulative light exposure, or rate of change in light levels. A separate questionnaire-based study also failed to find an association between outdoor activity and myopia progression in children [18]. Together these findings serve to emphasize two points: the analyses conducted so far only cover the tip of the iceberg in terms of potential myopia-relevant factors in light exposure, which is itself only one potential outdoor effect, and second, that questionnaires, while appropriate for documenting parental myopia and ocular health, may be insufficient to cover the nuances of visual activities and behavior that appear pertinent to the myopia story.
5. Conclusion
Outdoor exposure, often equated with intense light levels, has been linked to lower rates of myopia and slowed myopia progression in children, and exposure to bright light also inhibits form deprivation myopia in animals. Human myopia studies have relied on questionnaires, often completed by parents of myopic children, for data on time spent indoors, outdoors, in physical activity, studying, and other visual activities. The study presented here supplemented the questionnaire approach with objectively gathered data from light sensors, and compared the accuracy of the two approaches. Most subjects spent less than 20% of the day outdoors, were exposed to an average of only 7.42 min of bright sunlight per day, and received 15% or less of the total sunlight available over the study periods, in broad agreement with two previous studies that used the same sensor. That subjects’ estimates of time spent indoors and outdoors were in poor agreement with durations reported by the sensor data reinforces the need to include objective methods for quantifying the visual environment, in place of or to complement questionnaires. A high sampling frequency and the incorporation of weather data allow the capture of brief intensity changes and daily and seasonal variations, respectively, facilitating future comparisons with related studies. These data dramatically illustrate the indoor bias of modern living and also suggest caution in interpreting purely questionnaire-based results that indicate protective light or outdoor effects for myopia.
Acknowledgements
The authors thank the reviewers for their comments, Peter Cheng for assistance in data analysis, Emily Liu for performing subject screenings, Dr. Hany Eitouni for hardware, and Patrick Thorson of Lawrence Berkeley National Laboratory for providing weather data.
Funding This work was supported by NIH [grant number EY012392]; and UC Berkeley Graduate Division.
References
- [1].Sherwin JC, Reacher M, Keogh R, Khawaja A, Mackey D, Foster P. Ophthalmology. 2012;119:2141–2151. doi: 10.1016/j.ophtha.2012.04.020. [DOI] [PubMed] [Google Scholar]
- [2].Jung S-K, Lee J, Kakizaki H, Jee D. Invest. Ophthalmol. Visual Sci. 2012;53:5579–5583. doi: 10.1167/iovs.12-10106. [DOI] [PubMed] [Google Scholar]
- [3].Rose KA, Morgan I, Ip J, Kifley A, Huynh S, Smith W, Mitchell P. Ophthalmology. 2008;115:1279–1285. doi: 10.1016/j.ophtha.2007.12.019. [DOI] [PubMed] [Google Scholar]
- [4].Dirani M, Tong L, Gazzard G, Zhang X, Chia A, Young T, Rose K, Mitchell P, Saw S. Br. J. Ophthalmol. 2009;93:997–1000. doi: 10.1136/bjo.2008.150979. [DOI] [PubMed] [Google Scholar]
- [5].Jones LA, Sinnott L, Mutti D, Mitchell G, Moeschberger M, Zadnik K. Invest. Ophthalmol. Visual Sci. 2007;48:3524–3532. doi: 10.1167/iovs.06-1118. [DOI] [PMC free article] [PubMed] [Google Scholar]
- [6].Norton TT. ILAR J. 1999;40:59–77. doi: 10.1093/ilar.40.2.59. [DOI] [PubMed] [Google Scholar]
- [7].Ashby R, Ohlendorf A, Schaeffel F. Invest. Ophthalmol. Visual Sci. 2009;50:5348–5354. doi: 10.1167/iovs.09-3419. [DOI] [PubMed] [Google Scholar]
- [8].Ashby RS, Schaeffel F. Invest. Ophthalmol. Visual Sci. 2010;51:5247–5253. doi: 10.1167/iovs.09-4689. [DOI] [PubMed] [Google Scholar]
- [9].Weiss S, Schaeffel F. J. Comp. Physiol., A. 1993;172:263–270. doi: 10.1007/BF00216608. [DOI] [PubMed] [Google Scholar]
- [10].Siegwart JT, Ward AH, Norton TT. Invest. Ophthalmol. Visual Sci. 2012;53:3457. [Google Scholar]
- [11].Smith EL, Hung L, Huang J. Invest. Ophthalmol. Visual Sci. 2012;53:421–428. doi: 10.1167/iovs.11-8652. [DOI] [PMC free article] [PubMed] [Google Scholar]
- [12].Bartmann M, Schaeffel F, Hagel G, Zrenner E. Visual Neurosci. 1994;11:199–208. doi: 10.1017/s0952523800001565. [DOI] [PubMed] [Google Scholar]
- [13].Smith EL, Hung L, Arumugam B, Huang J. J. Invest. Ophthalmol. Visual Sci. 2013;54:2959–2969. doi: 10.1167/iovs.13-11713. [DOI] [PMC free article] [PubMed] [Google Scholar]
- [14].Crewther SG, Barutchu A, Murphy M, Crewther D. Exp. Eye Res. 2006;83:322–328. doi: 10.1016/j.exer.2005.12.016. [DOI] [PubMed] [Google Scholar]
- [15].Xiang F, Morgan I, Smith W, Rose K, He M. Presented at the Annual Meeting of the Association for Research in Vision and Ophthalmology; Fort Lauderdale, FL. May 1–5, 2011; ARVO E-Abstract 3057. [Google Scholar]
- [16].Morgan IG, Xiang F, Rose K, Chen Q, He M. Presented at the Annual Meeting of the Association for Research in Vision and Ophthalmology; Fort Lauderdale, FL. May 6–9, 2012; ARVO E-Abstract 2735. [Google Scholar]
- [17].Lu B, Congdon N, Liu X, Choi K, Lam D, Zhang M, Zheng M, Zhou Z, Li L, Liu X, Sharma A, Song Y. Arch. Ophthalmol. 2009;127:769–775. doi: 10.1001/archophthalmol.2009.105. [DOI] [PubMed] [Google Scholar]
- [18].Jones-Jordan LA, Sinnott L, Cotter S, Kleinstein R, Manny R, Mutti D, Twelker J, Zadnik K. Invest. Ophthalmol. Visual Sci. 2012;53:7169–7175. [Google Scholar]
- [19].Loman J, Quinn G, Kamoun L, Ying G, Maguire M, Hudesman D, Stone R. Ophthalmology. 2002;109:1032–1038. doi: 10.1016/s0161-6420(02)01012-6. [DOI] [PubMed] [Google Scholar]
- [20].Deng L, Gwiazda J, Thorn F. Optom. Vision Sci. 2010;87:406–413. doi: 10.1097/OPX.0b013e3181da8a85. [DOI] [PMC free article] [PubMed] [Google Scholar]
- [21].Rah MJ, Mitchell G, Mutti D, Zadnik K. Ophthalmic Epidemiol. 2002;9:191–203. doi: 10.1076/opep.9.3.191.1514. [DOI] [PubMed] [Google Scholar]
- [22].Backhouse S, Ng H, Phillips J. Optom. Vision Sci. 2011;88:400. [Google Scholar]
- [23].Dharani R, Lee C, Theng Z, Drury V, Ngo C, Sandar M, Wong T, Finkelstein E, Saw S. Eye. 2012;26:911–918. doi: 10.1038/eye.2012.49. [DOI] [PMC free article] [PubMed] [Google Scholar]
- [24].Schmid KL, Leyden K, Chiu Y, Lind S, Vos D, Kimlin M, Wood J. Optom. Vision Sci. 2013;90:148–155. doi: 10.1097/OPX.0b013e31827cda5b. [DOI] [PubMed] [Google Scholar]
- [25].Hubert M, Dumont M, Paquet J. Chronobiol. Int. 1998;15:59–70. doi: 10.3109/07420529808998670. [DOI] [PubMed] [Google Scholar]
- [26].Cole RJ, Kripke D, Wisbey J, Mason W, Gruen W, Hauri P, Juarez S. J. Biol. Rhythms. 1995;10:324–334. doi: 10.1177/074873049501000406. [DOI] [PubMed] [Google Scholar]
- [27].Rose K. Acta Ophthalmol. 2008;86:s243. [Google Scholar]
- [28].Alvarez AA. Ph.D. Dissertation [Online] University of California; Berkeley, CA: [accessed July 21, 2013]. 2012. Light, Nearwork, and Visual Environment Risk Factors in Myopia. http://digitalassets.lib.berkeley.edu/etd/ucb/text/Alvarez_berkeley_0028E_13030.pdf. [Google Scholar]
- [29].Nautical Almanac Office . Almanac for computers. United States Naval Observatory; [accessed Mar 19, 2013]. 1990. http://williams.best.vwh.net/sunrise_sunset_example.htm. [Google Scholar]
- [30].Earth Systems Research Laboratory . Solar calculator. National Oceanic and Atmospheric Administration; [accessed Mar 19, 2013]. 2012. http://www.esrl.noaa.gov/gmd/grad/solcalc/ [Google Scholar]
- [31].Thorson P. Weather charts. Lawrence Berkeley National Laboratory; [accessed Mar 19, 2013]. 2012. http://ehswprod.lbl.gov/weather/Home.htm. [Google Scholar]
- [32].Thimijan RW, Heins R. HortScience. 1983;18:818–822. [Google Scholar]
- [33].Palmer JM, Grant B. The Art of Radiometry. SPIE Press; Bellingham, WA: 2009. [Google Scholar]
- [34].Wallman J, Winawer J. Neuron. 2004;43:447–468. doi: 10.1016/j.neuron.2004.08.008. [DOI] [PubMed] [Google Scholar]
- [35].Marvasti FA, editor. Nonuniform Sampling: Theory and Practice. Springer; New York: 2001. [Google Scholar]


