

Abstract
Determining the full complement of protein-coding genes is a key goal of genome annotation. The most powerful approach for confirming protein-coding potential is the detection of cellular protein expression through peptide mass spectrometry (MS) experiments. Here, we mapped peptides detected in seven large-scale proteomics studies to almost 60% of the protein-coding genes in the GENCODE annotation of the human genome. We found a strong relationship between detection in proteomics experiments and both gene family age and cross-species conservation. Most of the genes for which we detected peptides were highly conserved. We found peptides for >96% of genes that evolved before bilateria. At the opposite end of the scale, we identified almost no peptides for genes that have appeared since primates, for genes that did not have any protein-like features or for genes with poor cross-species conservation. These results motivated us to describe a set of 2001 potential non-coding genes based on features such as weak conservation, a lack of protein features, or ambiguous annotations from major databases, all of which correlated with low peptide detection across the seven experiments. We identified peptides for just 3% of these genes. We show that many of these genes behave more like non-coding genes than protein-coding genes and suggest that most are unlikely to code for proteins under normal circumstances. We believe that their inclusion in the human protein-coding gene catalogue should be revised as part of the ongoing human genome annotation effort.
INTRODUCTION
The actual number of protein-coding genes that make up the human genome has long been a source of discussion. Before the first draft of the human genome came out, many researchers believed that the final number of human protein-coding genes would fall somewhere between 40 000 and 100 000 (1). The initial sequencing of the human genome revised that figure drastically downwards by suggesting that the final number would fall somewhere between 26 000 (2) and 30 000 (3) genes. With the publication of the final draft of the Human Genome Project (4), the number of protein-coding genes was revised downwards again to between 20 000 and 25 000. Most recently, Clamp and co-workers (5) used evolutionary comparisons to suggest that the most likely figure for the protein-coding genes would be at the lower end of this continuum, just 20 500 genes.
The Clamp analysis suggested that a large number of ORFs were not protein coding because they had features resembling non-coding RNA and lacked evolutionary conservation. The study suggested that there were relatively few novel mammalian protein-coding genes and that the ∼24 500 genes annotated in the human gene catalogue would end up being cut by 4000.
The Ensembl project began the annotation of the human genome in 1999 (6). The number of genes annotated in the Ensembl database (7) has been on a downward trend since its inception. Initially, there were >24 000 human protein-coding genes predicted for the reference genome, but that number has gradually been revised lower. More than two thousand automatically predicted genes have been removed from the reference genome as a result of the merge with the manual annotation produced by the Havana group (8), often by being re-annotated as non-coding biotypes. The numbers of genes in the updates of merged GENCODE geneset are now close to the number of genes predicted by Clamp in 2007. The most recent GENCODE release (GENCODE 19) contains 20 719 protein-coding genes.
The GENCODE consortium is composed of nine groups that are dedicated to producing high-accuracy annotations of evidence-based gene features based on manual curation, computational analyses and targeted experiments. The consortium initially focused on 1% of the human genome in the Encyclopedia of DNA Elements (9) pilot project (8,10) and expanded this to cover the whole genome (11).
Manual annotation of protein-coding genes requires many different sources of evidence (11,12). The most convincing evidence, experimental verification of cellular protein expression, is technically challenging to produce. Although some evidence for the expression of proteins is available through antibody tagging (13) and individual experiments, high-throughput tandem MS-based proteomics methods are the main source of evidence. Proteomics technology has improved considerably over the last two decades (14,15), and these advances are making MS an increasingly important tool in genome annotation projects. High-quality proteomics data can confirm the coding potential of genes and alternative transcripts, this is especially useful in those cases where there is little additional supporting evidence, and a number of groups have demonstrated how proteomics data might be used to validate protein translation (16–18). However, while MS evidence can be used to verify protein-coding potential, the low coverage of proteomics experiments implies that the reverse is not true. Not detecting peptides does not prove that the corresponding gene is non-coding because it may be a consequence of the protein being expressed in few tissues, having very low abundance, or being degraded quickly.
Finding peptides for all protein-coding genes is the holy grail of proteomics, and a number of recent large-scale experiments have detected protein expression for ∼50% of the human genome (18–24). The collaborative effort from the Human Proteome Project has identified close to 70% of annotated proteins from a range of sources (25).
Here, we put together reliable peptide evidence from seven separate large-scale MS analyses and confirm protein expression for 11 840 protein-coding genes. We show that the vast majority of these confirmed protein-coding genes correspond to the oldest and most conserved ORFs. We also describe a set of 2001 genes that have little or no peptide evidence from the seven proteomics studies and that have multiple features that suggest that they may not code for proteins. These results lead us to conclude that the human genome is likely to have <20 000 protein-coding genes.
RESULTS
We collected peptides from seven separate MS sources. Two came from large-scale proteomics databases, PeptideAtlas (26) and NIST (http://peptide.nist.gov/). Another four, referred to as ‘Geiger’, ‘Muñoz’, ‘Nagaraj’ and ‘Neuhauser’ throughout the paper, were recently published large-scale MS experiments (20,22–24). For all six datasets, the starting point was the list of peptides provided by the authors or databases. We generated the final set of peptides (referred to as ‘CNIO’) in house from an X!Tandem (27) search against spectra from the GPM (28) and PeptideAtlas databases, following the protocol set out in Ezkurdia et al. (18) with a false discovery rate of 0.1%. These seven studies cover a wide range of search engines, tissues and cell types.
In order to improve reliability, the peptides from each of these studies were filtered, eliminating non-tryptic and semi-tryptic peptides and peptides containing missed cleavages. For those studies where it was possible, we considered only peptides identified by multiple search engines (see Materials and methods).
We identified a total of 255 188 peptides in the seven analyses and mapped them to genes in the GENCODE 12 annotation of the human genome (GENCODE 12 corresponds to Ensembl 67). There were a total of 240 688 discriminating peptides (those that mapped uniquely to a single gene) and 14 520 non-discriminating peptides (those that matched more than one gene product).
We considered a gene to be uniquely identified when we could map at least two discriminating peptides to the gene. We found at least two discriminating peptides for 11 840 genes, 57.9% of the genes annotated in the GENCODE 12 geneset. We were able to map non-discriminating peptides to another 1648 genes, whereas 6974 genes had no peptide evidence at all.
The number of genes detected is comparable with previous recent studies (18–24). There was a substantial overlap between the seven datasets. A total of 9781 genes were identified in four or more different datasets. The PeptideAtlas collection identified the highest number of genes (10 394 genes from 127 404 peptides). Surprisingly, the combination of the seven datasets did not substantially increase the number of genes detected—the addition of the six other datasets to the PeptideAtlas peptides identified just 1444 additional genes. However, the identification of peptides across multiple experiments did serve to increase the confidence of the identifications. Our results suggest that the detected and undetected genes in proteomics experiments form two relatively robust and well-defined groups.
The relationship between proteomics detection and gene features
We carried out a series of comparisons in order to determine why we found peptides for just 11 840 genes. Three technical reasons make protein detection more difficult a priori. First, the length of the protein influences the probability of peptide identification because the shorter the protein is, the fewer peptides can be produced making identification of low-molecular-weight proteins technically challenging. We found a relationship between protein length and peptide detection (Supplementary Material, Fig. S1). Very few peptides were detected for proteins shorter than 50 amino acid residues; in fact, we did not detect peptides for proteins shorter than 38 residues.
Secondly, it is well known that it is more difficult to detect peptides for proteins with trans-membrane helices. Membrane-bound proteins are poorly accessible to tryptic digestion, and hydrophobic peptides may be difficult to detect in conventional reverse-phase columns. In order to measure the relationship between trans-membrane helices and peptide detection, we culled trans-membrane helix predictions from the APPRIS database (29). We compared detection rates for proteins that contained trans-membrane helices against those that did not. The results confirmed that proteomics detects fewer peptides for proteins with multiple trans-membrane helices—we found peptides for just 39.1% of these genes. However, proteins with single trans-membrane helices were just as likely to be detected as those without trans-membrane helices.
Finally, the range of transcript expression is also important; it should be easier to detect peptides for genes that express transcripts across many tissues than those that express transcripts in very few tissues. Using data from UniGene (30), we found a strong correlation between peptide detection and the number of tissues in which a transcript was expressed (Supplementary Material, Fig. S2). We detected protein evidence for >90% of the 6286 genes that express transcripts in 24 or more tissues. In contrast, we detected peptides for <25% of the 2932 genes that express transcripts in two or fewer tissues.
Genes with low-molecular-weight gene products, with restricted transcript expression, or with multiple trans-membrane helices made up over 3400 of the 7000 genes that we did not identify, so these three features go some way towards explaining why we detect peptides for just 58% of the protein-coding genes. The olfactory receptors are a good example of protein-coding genes that it is hard to detect peptides for. These proteins have multiple trans-membrane helices, and their expression is tissue-restricted (though, curiously, UniGene registers expression in as many as 17 different tissues). We do not detect any peptide evidence for any of the 380 olfactory receptors annotated in GENCODE 12.
Conservation and gene age are the best predictors of peptide detection
To look at the effect of conservation on gene detection, we collected data from INERTIA (29), one of the modules of the APPRIS database. INERTIA generates scores for the evolutionary rates of codons and exons for splice variants. Evolutionary rates in INERTIA are calculated using SLR (31) and multiple alignments of orthologous vertebrate transcripts (32). We defined gene conservation from the INERTIA score of the most conserved exon (MI score).
We found a striking correlation between conservation and detection in proteomics experiments (Fig. 1). We detected peptides for 84.7% of the 5554 genes with an MI score of <0.02 (the most conserved genes); in contrast, we detected little evidence for the 992 genes with least protein coding-like conservation (MI score > 0.8, 6.1% detection). There were 575 genes that had tiny exons or alignments against fewer than three species, so had no MI score. For these genes, the detection rate was <2%. Genes with poor conservation for which we could not find protein structural or functional features were hardly detected at all (Fig. 1). Not surprisingly, there was also a relationship between MI score and transcript expression (Supplementary Material, Fig. S3).
Figure 1.

The percentage of gene products detected in proteomics experiments as a function of gene conservation. Gene conservation is expressed using MI score, displayed in bins. Bin ‘0’ is MI scores from 0 to 0.019, ‘0.02’ is from 0.02 to 0.039, etc. The ‘missing’ genes are those where the conservation was so poor that INERTIA was not able to generate a score.
Gene family age (the oldest phylogenetic division in which a gene from the same family is found) was calculated using Ensembl Compara phylogenetic trees (33). Although there is a relation between gene family age and conservation, they are not exactly the same. INERTIA conservation is calculated only from alignments of vertebrates, whereas gene family age is measured from the Fungi-Metazoan period. A gene may have an older gene family age, for example, bilateria, but the gene itself may have arisen from a primate duplication. Thus, there are genes with relatively recent gene family age and well-conserved exons, and many genes with the earliest gene family ages (Fungi-Metazoa, Bilateria, Coelomata) and poor MI scores.
We compared proteomics detection rates for each of the gene family ages. The results are in Figure 2. We detect peptides for >89% of the genes from the oldest phylogenetic division (those that have Fungi-Metazoa group family age), whereas we detect practically no peptides for those genes whose family age can only be traced back to primates.
Figure 2.

The percentage of genes for which peptides are detected in proteomics experiments against gene family age. Gene products with gene families that appeared in the oldest phylogenetic divisions (towards the left) are detected much more often in proteomics experiments than those genes with families that appeared in the most recent phylogenetic divisions.
We also determined gene age, the phylogenetic division in which the most recent ancestral duplication occurred. The results for gene age show a similar trend to family age (results are shown in Supplementary Material, Fig. S4). Combining gene family age with gene age or conservation gives even more striking results. We detected peptides for 96.4% of genes with both Fungi-Metazoa family age and Fungi-Metazoa gene age (1136 genes), and 96.5% of highly conserved Fungi-Metazoa family age genes (1712 Fungi-Metazoa genes with MI scores of <0.015).
In order to determine whether the link between gene family age and proteomics detection was confined to humans, we performed a similar experiment using yeast, a single-celled organism. We generated gene ancestral definitions by all against all sequence similarity searches and plotted gene family age against the percentage of genes for which peptides are recorded in PeptideAtlas. There is the same clear relationship between gene age and detection rates in yeast (Supplementary Material, Fig. S5), so there were no peptides for genes belonging to families that arose since Saccharomyces cerevisiae.
A set of potential non-coding genes
Gene family age and coding sequence conservation are the best predictors of whether a protein will be detected in proteomics experiments. In contrast, the most recently evolved genes (those with primate gene family age) and the least conserved genes were much less likely to be detected in proteomics experiments (just 0.9% of the 563 primate-specific genes and 2% of the 987 genes with MI scores of >1 were detected with discriminating peptides).
Following the trans-membrane helix comparison, we also investigated the effect of a range of protein features on protein detection rates. Again, we collected features from the APPRIS database and measured peptide detection rates against the presence and absence of features such as protein functional domains, functional residues, homology to known structures and cross-species conservation. Proteins with these features were more likely to be detected in the analyses than proteins without these features (Supplementary Material, Fig. S6). For example, we detected 75.3% of proteins annotated with catalytic or ligand binding residues and 73.9% of proteins annotated with at least one unbroken PfamA functional domain.
At the other end of the scale, we discovered that genes without any APPRIS protein features had very low rates of peptide detection. In fact, the absence of all protein-like features turned out to have a very strong inverse relationship to peptide detection—we detected peptides for just 4.2% of the 956 genes that did not have protein-like features or conservation in APPRIS.
We searched a range of sources, including the APPRIS database, the UniProt Knowledgebase (34) and Ensembl/GENCODE, to find other features that might be related to low detection rates. From these, we selected a list of 19 features that correlated with low protein detection rates (see Table 1, and Materials and methods and Supplementary sections for more details).
Table 1.
The 19 features used to select the potential non-coding set
| Features | Genes | Peptide detection (%) |
|---|---|---|
| Homology existence [UP] | 131 | 6.87 |
| Pseudogene [E] | 75 | 6.67 |
| PUTATIVE transcripts [G] | 434 | 2.53 |
| Caution—pseudogene [UP] | 79 | 2.53 |
| Caution—dubious CDS [UP] | 47 | 2.13 |
| Poor conservation (MI score) [A] | 987 | 2.03 |
| Predicted existence [UP] | 507 | 1.58 |
| No protein features [A] | 1212 | 1.32 |
| Nonsense-mediated decay [G] | 78 | 1.28 |
| Circular annotation [E/UP] | 336 | 1.19 |
| Uncertain existence [UP] | 100 | 1.00 |
| Primate gene family [E] | 563 | 0.89 |
| Read-through [E/G] | 229 | 0.87 |
| Obsolete [E/UP] | 130 | 0.00 |
| Dubious EST support [E/G] | 98 | 0.00 |
| Non-functional [E] | 44 | 0.00 |
| Non-coding [E] | 38 | 0.00 |
| Antisense/opposite strand [E] | 25 | 0.00 |
| Miscellaneous RNA [E] | 7 | 0.00 |
Each feature is explained in more detail in Materials and methods and Supplementary sections. The source of each feature is indicated in square brackets (A, APPRIS; E, Ensembl; G, GENCODE; UP, UniProt). For each feature, we also show the number of genes with the feature and the proportion that we identify in the seven datasets.
We produced a set of 2001 genes that had at least 1 of these 19 features. We detected peptides for just 61 (3%) of these genes. The combination of features not typical of proteins and the very low peptide detection rates suggested that a number of these genes might turn out to be non-coding genes or pseudogenes. The complete annotations for the whole genome and for the potential non-coding set are available in Supplementary Material, Table S1.
Many genes in the set had more than one of the features listed in Table 1, and the more features a gene had, the less likely it was to be identified in the proteomics analysis. We found no peptides at all for genes with five or more features (Supplementary Material, Fig. S7).
Almost half the genes in this potential non-coding set were annotated with clone-based names rather than function-based names typical of protein-coding genes. Many of those with non-clone names were named for their chromosomal position, their sequence bias or with one of a set of miscellaneous identifiers that included generic names, pseudogene names, chimeric gene names and the cutely named ‘orphan’ gene (Supplementary Material, Fig. S8).
Immunoglobulin and t-cell segments, keratin-binding proteins, various antigens and olfactory receptors made up almost 300 genes. Analysis with the DAVID functional annotation (35) tool bears this out. Those genes we could map had biases towards the GO terms ‘intermediate filament’ (Benjamini score 5.3e-20), ‘keratinization’ (4.1e-10), ‘defence response to bacterium’ (5.2e-14) and ‘extra-cellular region’ (5.9e-6, a number of genes in the set are secreted). DAVID only identified 50% of genes in the potential non-coding set.
The set had two other biases. First, there were a number of genes with human-specific duplications. Clearly, it was impossible to distinguish these genes because most do not have unique tryptic peptides. Multiple duplications often generate pseudogenes, so some duplicated genes will be non-functional. Second, there were 142 genes corresponding to proteins that were 38 residues or shorter. Many of these were immunoglobulin or T-cell receptor joining segments and some were annotated as pseudogenes.
Can we detect protein-coding ability from other sources?
We looked for evidence of the protein-coding ability in a variety of other sources, in a large-scale proteomics experiment using human placental tissue (36), in the Passel selected reaction monitoring data repository (37) in the Human Protein Atlas (13) and in the UniProt Knowledgebase literature resource (34).
In total using Passel, Human Protein Atlas and UniProt, we found evidence of protein expression for a further 54 (2.7%) of the 2001 genes in the potential non-coding set (for more details, see Supplementary Material and Supplementary Material, Fig. S9). No evidence of protein expression was found for the other 1886 genes in the potential non-coding set.
How do these potential non-coding genes compare with known protein-coding genes?
In order to determine whether the genes in the potential non-coding set coded for proteins, we split the GENCODE 12 genes into three groups, those genes for which we found peptides in the seven analyses (Detected), those genes for which we did not find peptides, but that were not in the potential non-coding set (Not Detected) and the 1940 genes in the potential non-coding/pseudogene set for which we did not detect peptides (Potential NC). This last set comprises the 2001 genes from the potential non-coding set minus the 61 genes in the set for which we did detect peptides. We measured tissue expression and reading frame conservation (RFC) for the genes in each of the three sets.
First, we looked at the transcript evidence in UniGene by counting the number of tissues in which at least 5 transcripts per million were detected. The results show that there is much more transcript evidence for the Detected set than for the Not Detected and Potential NC genes (Fig. 3)—the more tissues in which a transcript was expressed, the more likely we were to detect peptides. Although distributions of transcript expression for the Not Detected and Potential NC sets are similar, it is noticeable that >50% of the genes in the Potential NC set have no measured transcription in any of the 45 tissues in UniGene.
Figure 3.
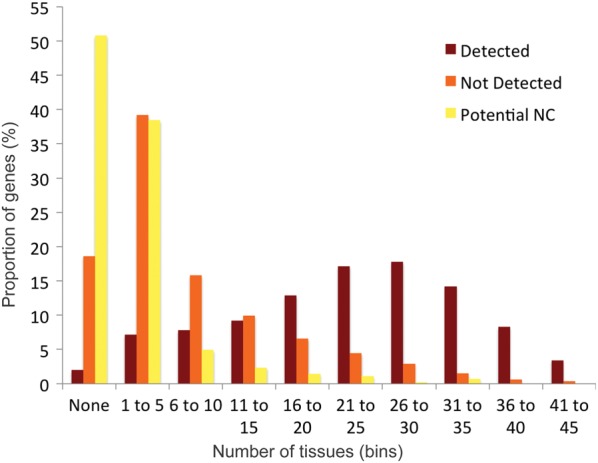
Transcript ubiquity for human genes. UniGene contains transcript evidence for most human genes over 45 different tissues. For each gene, we counted the number of tissues in which there was transcript evidence of at least five or more transcripts per million. We separated the numbers of tissues in which transcripts were detected in UniGene into ten bins and calculated the percentage of genes in each of the ten bins. We split the GENCODE 12 genes into three groups, those genes for which we found peptides (‘Detected’ in dark red), those genes for which we did not find peptides that were also in the potential non-coding set (‘Potential NC’ genes marked in yellow) and those for which we did not find peptides but that were not in the potential non-coding set (‘Not Detected’ genes, in orange).
In 2007, Clamp (5) identified 1177 genes as ‘orphans’ with features typical of non-coding RNA. Based on the numbers of coding genes then available (Ensembl 35), the authors suggested that the human reference genome had only 20 500 coding genes. The GENCODE 12 annotation still annotates 308 of these orphans, and there were 248 orphans among the potential non-coding genes. We detected peptides for just 3 of these 248 genes.
As part of their analysis, the authors calculated an RFC score for transcripts. Reading frames that change in pairwise alignments between two different species suggest large changes in protein function. The RFC score distribution of the orphans was very close to that of non-coding RNA.
We carried out our own reading frame analysis. Reading frame conservation scores were generated for the known protein-coding genes in the Detected set, for the probable protein-coding genes in the Not Detected set, for the genes in the Potential NC set and for a set of non-coding RNA. We aligned human with four species, chimp, macaque, dog and mouse, as in the Clamp analysis.
The results are shown in Figure 4. For the human-chimp alignments, most transcripts keep the same frame over the whole alignment—this is true even for the set of the non-coding genes we analysed—so the differences between the Detected genes and the genes in the Potential NC set were minimal. However, with the human–macaque alignments, the frame is lost in most non-coding alignments, and there is a marked difference between the Detected and Potential NC genes. In the dog and mouse comparisons, practically all non-coding transcripts had reading frame changes, and proportionally 3 times as many transcripts in the Potential NC set changed frame compared with the Detected set.
Figure 4.

RFC scores for pairwise alignments with four species. The RFC scores are calculated as per the section Materials and methods. RFC scores for alignments between (A) human and chimp, (B) human and macaque, (C) human and mouse and (D) human and dog. We split the GENCODE 12 genes into three groups, those genes for which we found peptides (‘Detected’ in dark red), those genes for which we did not find peptides and that were in the potential non-coding set (‘Potential NC’ genes marked in yellow) and those that we did not detect but that were not in the potential non-coding set (‘Not Detected’ genes, in orange). As a comparison, we included the results for a set of long non-coding genes (‘Non-coding’ shown in blue). RFC scores are shown on the y-axis; the x-axis is the proportion of each set. RFC scores are ordered from highest to lowest.
We could not find dog or mouse orthologues for half of the genes in the Potential NC set. This is the same proportion as the non-coding genes, which suggests that as many as half the genes in the Potential NC set are non-coding or orphan protein-coding genes. For the transcripts that we were able to align (Fig. 4C and D), more than half had changes in reading frame. While this is not as bad as the non-coding set (practically all non-coding genes had frame changes), it does suggest that as many as 25% of the genes in the Potential NC set will have changes in function compared with their mouse and dog orthologues, which again is not indicative of protein-coding potential. The RFC results for mouse and dog suggest that between half and three-quarters of the genes in the Potential NC set are unlikely to code for proteins.
The RFC results are also consistent with a model in which the majority of the genes in the Not Detected set are protein coding. Their RFC scores are close to those of the known protein-coding genes in all four sets of alignments. The fact that many of these genes are expressed in limited tissues (see Fig. 3) is likely to be a large part of the reason these genes were not detected in our analyses (25).
We generated four sub-groups (read-through, possible coding, possible non-coding and possible pseudogenes) from the potential non-coding set by manual curation. We repeated the human–mouse RFC analysis on these four groups. The results (Fig. 5) show that the RFC scores for possible coding genes and read-through genes had a very similar curve to the Not Detected genes. The 968 genes predicted to be non-coding genes had similar RFC scores to known Non-coding genes, whereas the 397 possible pseudogenes had RFC score curves that were somewhere between the Detected and Non-coding sets.
Figure 5.
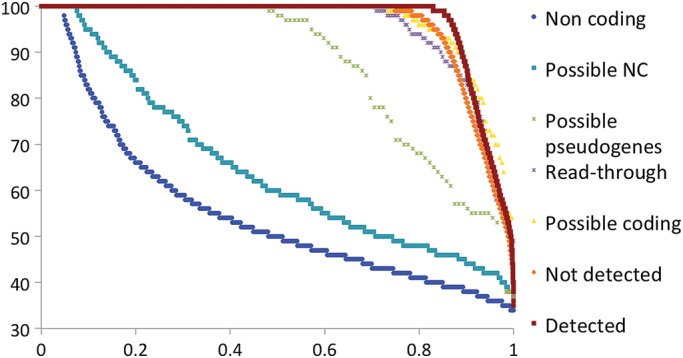
RFC scores for genes from potential NC set. The RFC scores were calculated as per the section Materials and methods for alignments between human and mouse only. We split the Potential NC set genes that we could classify into 4 groups, those 342 genes that we felt were likely protein-coding genes (Possible coding), the 396 genes that we felt were possible pseudogenes (Possible pseudogenes), the 229 read-through genes and those 969 genes that we felt were likely to be non-coding (Possible non-coding). We compared these four sets against three background sets, those protein-coding genes for which we found peptides (Detected in dark red), those coding genes for which we did not find peptides and that were not in the potential non-coding set (Not Detected genes, in orange) and a set of long non-coding genes (Non-coding shown in blue). RFC scores are shown on the y-axis; the x-axis in all the figures is the proportion of all the valid pairwise alignments included in the RFC calculations. RFC scores are ordered from highest to lowest.
How does this affect protein-coding gene numbers?
The Human Proteome Project (25), which aims to detect protein evidence for all human genes, has estimated that there are <20 000 protein-coding genes. Their estimates were based on Ensembl 69, which was a low water mark in terms of protein-coding genes with just 20 059 annotated. Since then, the Ensembl and GENCODE annotations have added >600 new protein-coding genes. In order to estimate the numbers of protein-coding genes in the reference genome, we need to consider those genes added to the annotation since GENCODE 12 (Ensembl 67) and to look for protein-coding genes that the annotators might have missed.
Since GENCODE 12, 394 protein-coding genes have been removed from the reference genome, whereas 651 genes have been added. According to our analysis, the annotators have done a good job of cleaning up the annotation because almost 90% of the genes removed since GENCODE 12 (349) were in our potential non-coding set. What is more, the vast majority (336) were in our predicted non-coding gene or pseudogene subsets. However, we did find peptides for nine of the genes removed since GENCODE 12, and we would expect these genes to be reinstated as protein-coding in the future.
We extended our analysis to the 651 genes that have been added since GENCODE 12. Using just 10 of the available 19 non-protein features (APPRIS protein characteristics, read-through genes, Ensembl descriptions and UniProt protein evidence), we found that 596 of the newly annotated genes had features that suggested they were not protein-coding. For example, 338 of these new protein-coding genes did not have any protein features, whereas 183 were read-through transcripts.
We also looked for peptides for the newly annotated genes and for genes that are not yet annotated by Ensembl/GENCODE. Six of the seven proteomics analyses mapped their spectra to multiple databases of predicted proteins, including UniProtKB/SwissProt (34), UniProtKB/TrEMBL (34), IPI (38), H-InvDB (39) and RefSeq (30) in addition to Ensembl/GENCODE. From these 6 studies, we found more than 6000 peptides that did not map to GENCODE 12.
We performed an exhaustive cross-checking of the peptides against GENCODE 19 and other databases and found peptide evidence (2 or more peptides) for 24 of the 55 possible protein-coding genes added since GENCODE 12 and peptide evidence for 49 genes that are not yet annotated in GENCODE 19.
Based on our analysis of atypical coding features, we believe that as many as 1867 of the 20 719 genes annotated in the GENCODE 19 reference genome will be shown to be non-coding or pseudogenes. On the other hand, we have found peptide evidence for 58 protein-coding genes that are not currently in Ensembl/GENCODE, and there will almost certainly be more protein-coding genes, possibly as many again, which are not yet annotated and for which we were not able to detect peptides. If we take these two numbers into account, we estimate that the number of protein-coding genes in the reference genome will be very close to 19 000 genes.
DISCUSSION
Our analysis of seven large-scale proteomics experiments has unambiguously identified close to 12 000 human genes. We found most peptides for the oldest and most conserved genes. The high proportion of ancient genes identified with peptide evidence is in accord with their expected expression level and importance to the cell. Ancient genes are generally widely expressed and often retain important housekeeping roles. We identified 96.3% of genes that have not duplicated since the Fungi-Metazoan era.
Despite the high coverage from the seven analyses, we failed to detect peptides for 40% of the human geneset. Of course, the absence of peptides in proteomics analyses does not imply that a protein is not expressed. There are many reasons why peptides are not detected in proteomics experiments, for example, the proteins may be present in limited tissues or developmental stages, they may be expressed in very low quantities or, like the HOX genes, have a very short half-lives. Some may be only activated by certain stresses (25), and still other proteins will have features, such as multiple trans-membrane helices, that make them difficult to detect for technical reasons.
However, the seven proteomics studies covered a wide range of cell types, making it less likely that one of the main reasons for not detecting a protein, i.e. that it is expressed in limited tissues or developmental stages. The PeptideAtlas database alone is a compendium of experiments carried out on 51 different tissue and cell types, and the PeptideAtlas database forms just a part of the CNIO study and the NIST database. Six of the seven studies were carried out on a range of tissues, and together these studies cover considerably more cell types than UniGene. Although the Human Proteome Project (25) has reported that early developmental stages are still under represented in proteomics experiments, the Muñoz analysis used in this paper (22) interrogated embryo and pluripotent stem cells and found relatively few previously undetected proteins. However, despite the variety of tissues interrogated in our analysis, it is to be expected that some proteins will remain undetected because they are tissue specific.
Although the technical limitations of proteomics analyses are among the most probable reason for detecting peptides for <60% of the protein-coding genes, there may be another reason for not identifying peptides for certain genes. It is possible that some of the genes predicted to be protein-coding in the GENCODE geneset do not actually code for proteins. To investigate this, we selected 2001 genes that had one or more features that suggested of a lack of coding potential. We found protein evidence for <6% of these genes, and for many of these genes, the reading frame was not conserved in cross-species alignments. Together the non-protein-like features, loss of reading frame and lack of protein evidence suggested that many of these genes might not code for proteins under normal circumstances.
We did detect proteomics evidence for several genes in this set, for example, SLC5A3 (ENSG00000198743), which was annotated by UniProt as only having evidence of protein existence by homology, and for SPA17 (ENSG00000064199), which is annotated as ‘putative’ by GENCODE. Both these genes have protein-like features and good conservation. They were in the list of potential non-coding genes because the human genome annotation project is not yet complete and these genes had yet to be annotated with evidence by GENCODE and UniProt. SPA17 is no longer tagged as ‘putative’ in the GENCODE 19 annotation. We also identified peptides for genes with conflicting protein-coding evidence, such as WASH4P (ENSG00000234769) and WASH6P (ENSG00000182484), annotated as protein coding, but tagged as pseudogenes in the Ensembl description. Again as the human genome annotation progresses, these descriptions are likely to be refined.
There are genes that do not fit into the conventional coding/non-coding narrative in the non-coding set. Several genes are annotated as potentially non-functional but may actually be functional under certain conditions. One example is FMO2, dimethylaniline monooxygenase 2 (ENSG00000094963). There are two alleles, FMO2*2A, which is truncated, and FMO2*1, the full-length form. The truncated allele FMO2*2A is catalytically inactive and is probably unable to fold correctly. FMO2*1 is not present in Caucasian and Asian populations but is found in low quantities in African populations (40). The function of the FMO2*1 variant is not clear, but it does lead to increased risk of thiourea-caused pulmonary toxicity.
The growth of the number of annotated read-through genes plays a role in maintaining artificially high numbers of protein-coding genes in the human reference genome. Read-through genes connect two or more neighbouring genes by splicing together exons of two otherwise defined, independent loci. It is not clear what biological significance this has, but the number of read-through genes is growing in the reference annotation. We found 229 read-through genes in GENCODE 12, and there are >400 read-through protein-coding genes annotated in GENCODE 19. There is some evidence to suggest that read-through transcription is part of a process that allows genes to gain new protein domains (41), and so these genes might be regarded as a testing ground for new protein functions. However, there is very little peptide evidence for these chimeric genes (just 0.87%), and they are probably best annotated as splice variants of the downstream gene. Their presence in the reference genome makes proteomics searches (and other large-scale experiments) more complicated because it is impossible to find peptides that separate the (likely non-coding) read-through genes from the component genes. Without the read-through genes, we could have identified up to 300 more genes in the 7 proteomics studies.
Many of the 2001 genes in the potential non-coding set may turn out not to code for proteins under any circumstances. Unfortunately, genes labelled as protein coding at the gene annotation level can have complications for downstream services and research groups that are sometimes difficult to undo. The Pfam functional domain database, for example, has a recent surge in the numbers of newly defined protein functional domains, and many of these have almost certainly been defined on the back of ‘protein-coding’ genes, some of which may turn out not to code for proteins. Overestimating the numbers of protein-coding genes can also hinder experiments such as large-scale proteomics projects and biomedical projects, such as the mapping of cancer or disease-related variations to human genes.
The human genome is still in the process of being annotated, and the Ensembl/GENCODE merge of the human genome is in constant flux as the annotators withdraw, redefine gene models and add new genes. To some extent our results reflect this situation, many of the genes we have identified will be removed from the protein-coding catalogue as the manual annotations become more complete. In fact, this can be seen clearly with the most recent release of the reference annotation, GENCODE 19, where 349 of the 2001 genes in the potential non-coding set have already been withdrawn.
Most genes in the potential non-coding set have multiple non-coding features, little or no evidence of transcript expression, no detected peptides and an RFC that fits non-coding genes more closely than coding genes. We believe that this evidence suggests that as many as 1800 genes that are currently annotated as protein-coding do not actually code for proteins and that the number of functional protein-coding genes in the reference genome is closer to 19 000 than to 20 000.
This reduction in the number of protein-coding genes will be an important re-definition of one of the most fundamental features of the human genome and one that has many implications. The human genome provides a reference for the annotation of all other vertebrate genomes, so a redefinition of the human protein-coding complement would affect other species, and not just closely related species, such as chimpanzee, which may have homologues to reclassified human genes. The approach we have taken to identify potential non-coding genes is a highly practical means of informing the curation of the human genome. It will be even more valuable for species that have less manual curation and that depend more on automatic gene predictions that inevitably will predict protein-coding genes that are species-specific, that have weak conservation and without protein features.
These results will be fed back into the GENCODE human geneset, and manual curators will decide on the protein-coding ability of each gene based on the available evidence. The GENCODE geneset is used as the reference gene annotation for the ENCODE and Ensembl projects, and Ensembl is the base of many large-scale projects so these changes would potentially have a substantial impact on a range of fields, including, but not limited to, genomics, evolutionary biology, and proteomics. Among other consequences, it will have a profound effect on large-scale genomics and proteomics studies and an obvious impact on the classification and functional interpretation of human variation in biomedical studies, where potential non-coding genes are currently included as part of the analytic process.
MATERIALS AND METHODS
Peptides were assembled from seven previously available proteomics datasets. Four of the peptide datasets, the Geiger, Muñoz, Nagaraj and Neuhauser sets, came from published large-scale experiments (20,22–24); two others were large spectra libraries, PeptideAtlas (26) and NIST (http://peptide.nist.gov/). The final study (referred to as CNIO throughout the paper) was carried out in-house and is detailed later.
The CNIO analysis
The CNIO analysis was based on the protocol detailed in Ezkurdia et al. (18). Briefly, we used X!Tandem (27) to search against peptide mass spectra from two publicly available proteomics resources, the Global Proteome Machine Organization (GPM, 28) and PeptideAtlas databases. We used an updated set of spectra in the analysis; the spectra data in the GPM database had grown by 37% and PeptideAtlas by 18% since the original experiment. The PeptideAtlas and GPM data files can be downloaded from the Tranche distributed file system (tranche.proteomecommons.org) and ftp://ftp.thegpm.org/data/msms/.
Peptides were identified by searching against GENCODE 12. Expectation values (e-values) produced by X!Tandem were used to score the peptide–spectrum matches (PSM). When a peptide is identified more than once, we only included the PSM with lowest e-value. Only fully tryptic peptides containing a maximum of one missed tryptic cleavage site were taken into account. Peptides were considered positively identified when they had an FDR of ≤0.1%. The FDR was calculated using a concatenated target/decoy strategy (42); the decoy database was constructed by reversing each GENCODE 12 sequence entry.
Filtering for high-quality peptide identifications
In order to guarantee that we only used the most reliable data from these sets, the peptides (and in the case of the CNIO study, the spectra) were filtered before mapping to the genome annotation. We used a series of filters to remove the most likely false-positive peptides in each analysis.
It has been shown that using multiple search engines increases performance (43) so where possible we required peptides to be identified by more than one search engine. For the Nagaraj, Neuhauser and Geiger datasets, we used those peptides with an Andromeda (44) score of 100 or more, because it has been shown that Andromeda and Mascot (45) are almost always in agreement on the top-scoring peptides with a score of 100 or more (44).
The NIST database uses five different search engines to identify peptides from spectral databases. The NIST data have good coverage of the human genome but a higher than 1% FDR. We filtered the NIST peptides by only including peptide-spectra matches where three or more of the search engines identified the same peptide. The Muñoz study and PeptideAtlas database peptides did not have any specific filters.
An in-house investigation of the false-positive rates of the various types of peptides showed that non-tryptic peptides, semi-tryptic peptides and missed cleavages without the presence of one the cleaved tryptic sub-peptides had markedly higher false-positive rates. Non-tryptic peptides, semi-tryptic peptides and peptides with unsupported missed cleavages were removed from all studies. We applied the equivalent rule to peptides detected using GluC and LysC enzymes in the Nagaraj analysis (23).
We mapped the peptides to the GENCODE 12 geneset. The manual GENCODE annotations for Ensembl annotation are probably the most reliable annotation of human protein-coding genes. The version we used was GENCODE 12 (equivalent to Ensembl 67), which was annotated with 20 462 protein-coding genes. We counted both the number of peptides that mapped unequivocally to a single gene (discriminating peptides) and those that mapped two or more different genes (non-discriminating peptides). In order to prove the expression of a protein, we required two discriminating peptides or discriminating peptides from two or more analyses.
The peptides used in the analysis are mapped to genes and transcript in the APPRIS database (appris.bioinfo.cno.es).
Protein features
Protein features were supplied by APPRIS (29), a database that houses annotations of protein structural and functional data and information from cross-species conservation for the human genome. Genes were annotated with protein structural information via a mapping to structural homologs in the PDB (46), highly reliable predictions of conserved functionally important amino acid residues were made by firestar (47) and mapping to Pfam functional domains was carried out via Pfamscan (48). In addition, trans-membrane helices were predicted using three separate trans-membrane predictors (49–51). We predicted signal peptides with SignalP (52). Conservation information comes from two sources, one APPRIS module counts the numbers of equivalent vertebrate orthologues in the protein databases, whereas a second, INERTIA, calculates exon evolutionary rates using three separate sets of cross-vertebrate transcript alignments (53–55). APPRIS calculates features for all transcripts, and we took the APPRIS scores from the highest scoring transcript for each gene.
INERTIA MI scores (exon conservation scores)
The results from INERTIA were used to calculate the conservation score for each gene, a score that is referred to as MI score throughout the paper. The MI score was the INERTIA score from the lowest scoring exon. There were two caveats: the exon had to be at least 42 bases long and the alignment had to have at least 3 species other than human.
Gene expression breadth based on EST data
Expression data were obtained from the UniGene database (30) at http://www.ncbi.nlm.nih.gov/unigene/ (data download from August 2013). UniGene provides EST data clustered in different sets according to the different tissues (45 body sites). We considered that a gene is expressed if at least two cDNAs were found, representing five or more transcripts per million. Genes with no expression data within the tissue sets were removed from the corresponding analyses, and as a consequence, we obtained 17 934 human genes with tissue expression information.
Human gene birth dating
We performed a gene birth dating analysis based on phylogenetic family trees following a pipeline that is conceptually similar to that described recently (56). We used the phylogenetic reconstructions of Ensembl Compara v67 (33), which are based on genes sequenced from 58 different species. We focused on the human protein-coding genes annotated by Ensembl Compara v67. We only considered age classes (or phylostrata) representing the last common ancestors of Homo sapiens and species sequenced with relatively high coverage (at least 5×). We decided to remove Euarchontoglires phylostratum and to collapse it within the Eutherian level owing to the inconsistencies described previously between gene trees and species phylogeny at this level (57,58). Our analysis included the following 18 age classes for human genes: Fungi/Metazoa, Bilateria, Coelomata, Chordata, Vertebrata, Euteleostomi, Sarcopterygii, Tetrapoda, Amniota, Mammalia, Theria, Eutheria (Eutheria + Euarchontoglires), Simiiformes, Catarrhini, Hominoidea, Hominidae, HomoPanGorilla and Homo sapiens. For the purposes of the graphic in Figure 2, all classes from Simiiformes to Homo sapiens were combined to form the ‘Primate’ class and the smaller classes Vertebrata and Sarcopterygii were clustered together with Chordata and Tetrapoda, respectively.
Ensembl Compara classifies each internal node of a family tree in speciation and duplication events and assigns it to the phylogenetic level (or age class) in which these events are detected (59). We used this information in our pipeline to establish two alternative definitions of gene birth events. We defined gene family age as the last common ancestor to all the species containing a member of the gene family (i.e. the phylostratum defined by the root node of the gene family tree). We defined the gene age as the phylostratum assigned to the last genomic event leading to the birth of an extant gene.
For genes with origins other than duplication (singletons), gene age corresponds to the gene family age, whereas for duplicated genes, gene age represents the ancestral species where the last duplication event was detected. Duplication events were detected following a previously described in-house protocol (60). For this purpose, we only considered duplication events showing a consistency score (58) of >0.3. When this score was exactly 0, we considered that this duplication was an artefact of the phylogenetic reconstruction, and we ignored this node and established gene age using the previous nodes in the tree. Duplication nodes with consistencies between 0 and 3 were considered unclear and gene age could not be assigned.
Yeast gene birth dating
For S. cerevisiae, we performed a gene family birth dating analysis based on PSI-BLAST homology searches, following a pipeline similar to that described recently (61). For this, we created a 3-round PSI-BLAST (62) profile for every yeast protein against a 90% sequence identity non-redundant version of the UniProt database. We used these profiles to detect homologues for each yeast protein-coding gene by searching against sequence databases created from the UniProt database for a range of taxonomic divisions. Each database contained only those sequences from species with the same last common ancestor as S. cerevisiae. In this way, detection of a significant hit (e-value < 10−5) in a given database implies that an ancestor was present in the corresponding ancestral species prior to the evolutionary split. We date the gene family birth event to the evolutionary time period (or phylostratum) represented by the most recent database in which we detected the presence of an ancestor gene.
Database annotations
Annotations were taken from a range of resources. The Protein Existence annotations came from UniProt Knowledgebase (34). If there was more than one splice isoform, the isoform with the highest-ranked evidence was taken as the representative of the gene. We also downloaded all UniProt caution advice, three in particular were indicative of genes with little or no proteomics evidence, those that warned of ‘dubious CDS prediction’, ‘pseudogene’, preliminary data’. UniProt also annotated a number of genes as ‘Obsolete’.
UniProt also annotates proteins manually with protein evidence. Human proteins are particularly well annotated within UniProt. Protein evidence in UniProt is organized in five levels that are in order of decreasing evidence: ‘Protein’, ‘Transcript’, ‘Homology’, ‘Predicted’ and ‘Uncertain’.
Ensembl gene descriptions were also a useful source of annotations. Ensembl gene descriptions allowed us to generate subsets of genes annotated as ‘pseudogene’, ‘readthrough’, ‘non-coding’, ‘non-functional’, ‘antisense’ and ‘opposite strand’.
We were also able to generate subsets of genes from GENCODE tags. GENCODE transcripts have three types of ‘status’ tag, ‘KNOWN’ is the most reliable and ‘PUTATIVE’ identifies the transcripts with the least evidence. Where a gene had multiple splice variants, we took the transcript with the highest-ranked tag to represent the gene. GENCODE also has a ‘class’ tag. Most transcripts are tagged as ‘protein coding’, but there are some transcripts tagged as ‘nonsense_mediated_decay’ (NMD). Where all gene transcripts were in the nonsense_mediated_decay class, we tagged the gene as NMD.
Finally, the GENCODE project is manually annotating all transcripts with a transcription support level in collaboration with Ensembl. The annotation levels for multiple exon transcripts range from ‘mRNA covers all introns’ (the highest annotation level) to ‘suspect ESTs’ and ‘no evidence’, the two lowest levels of transcript support. Once again for those genes with alternatively spliced transcripts, the highest-ranked transcription support level was taken as the transcript support level for the whole gene.
Feature selection
A total of 19 features from a range of sources correlated with very low peptide detection rates. The list of features with very low peptide detection rates is shown below, ordered by the number of genes that has each of the features. The annotation source is in brackets.
Class 1. Genes with no protein-like features (from APPRIS)
These were genes that had no protein features and medium-to-high MI score (because we detected peptides for 33% of genes with no protein features but that have good conservation—MI scores of <0.4).
Class 2. Genes with poor protein-coding conservation (APPRIS)
Here, we included all genes that had an INERTIA MI score of >1 and those cases where INERTIA did not produce a score because few species had related sequences.
Class 3. Primate genes (Ensembl Compara)
This class included those genes with primate gene family age. We detected peptides for just 5 of the 563 genes annotated as appearing since primates.
Class 4. PUTATIVE genes (GENCODE)
These were genes that have all transcripts annotated as PUTATIVE by GENCODE. PUTATIVE transcripts are the least reliable level of GENCODE annotations.
Classes 5, 6 and 7. Genes with weak Protein Evidence (UniProt)
Genes where all splice isoforms were annotated with Homology evidence or worse had little evidence of protein expression (the best was Homology with a 6.87% peptide detection rate). The relation between protein evidence and detection can be seen in Supplementary Material, Figure S10.
Class 8. Genes with (semi-)circular annotation (UniProt/Ensembl)
There were 336 genes where Ensembl took their description from a UniProt entry, and the corresponding UniProt entry linked back to Ensembl with the following caution: ‘The sequence shown here is derived from an Ensembl automatic analysis pipeline and should be considered as preliminary data’. There was peptide evidence for just four of these genes.
Classes 9 and 10. Genes with UniProt Cautions
These were genes with other cautions in the UniProt annotations, either because the isoforms were tagged as potential pseudogenes or because they were tagged as dubious CDS predictions. There were 126 genes with these two cautions.
Class 11. Obsolete genes (Ensembl/UniProt)
A total of 130 genes had Ensembl descriptions that pointed to UniProtKB/TrEMBL protein entries tagged as ‘Obsolete’. None of these genes had any evidence of protein coding. Most of them were no longer annotated in GENCODE 19.
Class 12. Genes supported by suspect ESTs (GENCODE)
There were 98 genes with transcripts supported only by ‘suspect ESTs’. We did not detect peptides for any of these genes. The relation between transcript support and detection can be seen in Supplementary Material, Figure S11.
Class 13. Nonsense-mediated decay genes (GENCODE)
GENCODE include transcripts annotated as nonsense-mediated decay targets within the protein-coding set. There were 75 genes annotated solely with NMD transcripts.
Class 14. Pseudogenes (Ensembl)
These were 75 genes tagged with the word ‘pseudogene’ in the Ensembl description.
Class 15. Read-through genes (Ensembl/GENCODE)
There were 229 genes annotated as ‘read-through’ in the Ensembl description or by GENCODE. We detected peptides for just two of these genes.
Class 16. Non-functional genes (Ensembl)
These were genes that are annotated as ‘non-functional’ by Ensembl as part of their description field. Many of these were T-cell receptors and immunoglobulins. We did not detect peptides for any of these genes.
Class 17. Non-coding genes (Ensembl)
Thirty-eight genes of the genes in GENCODE 12 were tagged as ‘non-coding’ in the Ensembl description field. As might be expected, we did not detect peptides for any of these genes.
Class 18. Antisense/opposite strand genes (Ensembl)
Annotated as antisense or opposite strand as part of the Ensembl description. We did not detect peptides for any of these 25 genes.
Class 19. Miscellaneous RNA (Ensembl)
There were seven genes tagged in the Ensembl description field as ‘long intergenic non-protein-coding RNA’ or ‘microRNA’. Again, we did not detect peptides for any of these genes.
Reading frame conservation
We calculated RFC scores for all protein-coding genes in the GENCODE 12 annotation and for a set of non-coding genes. Alignments for the GENCODE 12 transcripts were obtained from the UCSC 46-way mammalian multiple alignments (32). Alignments for the non-coding regions were downloaded from the Ensembl Compara alignments (33). RFC scores were calculated from pairwise alignments between human and chimpanzee, human and macaque, human and dog, and human and mouse. The RFC score for each gene/non-coding region was calculated as the proportion of aligned bases that stay in frame.
In all cases, we calculated RFC scores across three frames and took the highest scoring frame to avoid cases where misalignment at the 5′ end skews the final score. For the GENCODE 12 annotations, we took the APPRIS principal variant (29) as the representative for the gene. For the non-coding genes, we took the longest transcript. The coding genes were split into three groups for comparison. Those 11 840 for which we detected peptides, the 1940 genes from the potential non-coding set that we did not find peptides for and the remaining protein-coding genes.
Predicting gene type for the potential non-coding set
We generated four sub-groups (read-throughs, possible coding, possible non-coding and possible pseudogenes) from the potential non-coding set. Read-through genes were the 229 read-through genes. Possible protein-coding genes were those genes for which we detected peptides, genes that had protein evidence from other sources and genes that had not evolved recently, that had good conservation and that had few atypical protein features. Possible pseudogenes were the genes annotated as pseudogenes by UniProt, Ensembl or the Clamp analysis, genes from highly duplicated families annotated as non-functional and genes that we felt were not non-protein coding and nevertheless had clear protein-like features. Possible non-coding genes were those annotated as non-coding by Ensembl or the Clamp analysis and genes that had no clear protein features and were not conserved.
Several genes were left out of these sets, specifically genes from multiple recent duplications where there were several genes with practically identical scores, and genes read from frames opposite coding exons. There were 229 read-through genes, 343 possible pseudogenes, 968 possible non-coding genes and 392 possible protein-coding genes.
SUPPLEMENTARY MATERIAL
FUNDING
This work was supported by the National Institutes of Health (NIH, grant number U41 HG007234) and by the Spanish Ministry of Science and Innovation (grant numbers BIO2007-666855, RD07-0067-0014, COMBIOMED). J.M.R. is supported by the Spanish National Institute of Bioinformatics (www.inab.org), a platform of the ‘Instituto de Salud Carlos III’. Funding to pay the Open Access publication charges for this article was provided by the National Institutes of Health (NIH, grant number U41 HG007234).
Supplementary Material
ACKNOWLEDGEMENTS
The authors thank Daniel Rico for suggestions and discussions regarding gene expression and gene family age data.
Conflict of Interest statement. None declared.
REFERENCES
- 1.Pennisi E. A low gene number wins the GeneSweep pool. Science. 2003;300:1484. doi: 10.1126/science.300.5625.1484b. [DOI] [PubMed] [Google Scholar]
- 2.Venter J.C., Adams M.D., Myers E.W., Li P.W., Mural R.J., Sutton G.G., Smith H.O., Yandell M., Evans C.A., Holt R.A., et al. The sequence of the human genome. Science. 2001;291:1304–1351. doi: 10.1126/science.1058040. [DOI] [PubMed] [Google Scholar]
- 3.International Human Genome Sequencing Consortium. Initial sequencing and analysis of the human genome. Nature. 2001;409:860–921. doi: 10.1038/35057062. [DOI] [PubMed] [Google Scholar]
- 4.International Human Genome Sequencing Consortium. Finishing the euchromatic sequence of the human genome. Nature. 2004;431:931–945. doi: 10.1038/nature03001. [DOI] [PubMed] [Google Scholar]
- 5.Clamp M., Fry B., Kamal M., Xie X., Cuff J., Lin M.F., Kellis M., Lindblad-Toh K., Lander E.S. Distinguishing protein-coding and noncoding genes in the human genome. Proc. Natl. Acad. Sci. USA. 2007;104:19428–19433. doi: 10.1073/pnas.0709013104. [DOI] [PMC free article] [PubMed] [Google Scholar]
- 6.Hubbard T., Barker D., Birney E., Cameron G., Chen Y., Clark L., Cox T., Cuff J., Curwen V., Down T., et al. The Ensembl genome database project. Nucleic Acids Res. 2002;30:38–41. doi: 10.1093/nar/30.1.38. [DOI] [PMC free article] [PubMed] [Google Scholar]
- 7.Flicek P., Ahmed I., Amode M.R., Barrell D., Beal K., Brent S., Carvalho-Silva D., Clapham P., Coates G., Fairley S., et al. Ensembl 2013. Nucleic Acids Res. 2013;41:D48–D55. doi: 10.1093/nar/gks1236. [DOI] [PMC free article] [PubMed] [Google Scholar]
- 8.Harrow J., Denoeud F., Frankish A., Reymond A., Chen C.K., Chrast J., Lagarde J., Gilbert J.G., Storey R., Swarbreck D., et al. GENCODE: producing a reference annotation for ENCODE. Genome Biol. 2006;7:S4. doi: 10.1186/gb-2006-7-s1-s4. [DOI] [PMC free article] [PubMed] [Google Scholar]
- 9.ENCODE Project Consortium. An integrated encyclopedia of DNA elements in the human genome. Nature. 2012;489:57–74. doi: 10.1038/nature11247. [DOI] [PMC free article] [PubMed] [Google Scholar]
- 10.ENCODE Project Consortium. Identification and analysis of functional elements in 1% of the human genome by the ENCODE pilot project. Nature. 2007;447:799–816. doi: 10.1038/nature05874. [DOI] [PMC free article] [PubMed] [Google Scholar]
- 11.Harrow J., Frankish A., Gonzalez J.M., Tapanari E., Diekhans M., Kokocinski F., Aken B.L., Barrell D., Zadissa A., Searle S., et al. GENCODE: the reference human genome annotation for The ENCODE Project. Genome Res. 2012;22:760–774. doi: 10.1101/gr.135350.111. [DOI] [PMC free article] [PubMed] [Google Scholar]
- 12.Guigó R., Flicek P., Abril J.F., Reymond A., Lagarde J., Denoeud F., Antonarakis S., Ashburner M., Bajic V.B., Birney E., et al. EGASP: the human ENCODE genome annotation assessment project. Genome Biol. 2006;7:S2. doi: 10.1186/gb-2006-7-s1-s2. [DOI] [PMC free article] [PubMed] [Google Scholar]
- 13.Uhlen M., Oksvold P., Fagerberg L., Lundberg E., Jonasson K., Forsberg M., Zwahlen M., Kampf C., Wester K., Hober S., et al. Towards a knowledge-based human protein atlas. Nat. Biotechnol. 2010;28:1248–1250. doi: 10.1038/nbt1210-1248. [DOI] [PubMed] [Google Scholar]
- 14.Mallick P., Kuster B. Proteomics: a pragmatic perspective. Nat. Biotechnol. 2010;28:695–709. doi: 10.1038/nbt.1658. [DOI] [PubMed] [Google Scholar]
- 15.Aebersold R., Mann M. Mass spectrometry-based proteomics. Nature. 2003;422:198–207. doi: 10.1038/nature01511. [DOI] [PubMed] [Google Scholar]
- 16.Tanner S., Shen Z., Ng J., Florea L., Guigó R., Briggs S.P., Bafna V. Improving gene annotation using peptide mass spectrometry. Genome Res. 2007;17:231–239. doi: 10.1101/gr.5646507. [DOI] [PMC free article] [PubMed] [Google Scholar]
- 17.Brosch M., Saunders G.I., Frankish A., Collins M.O., Yu L., Wright J., Verstraten R., Adams D.J., Harrow J., Choudhary J.S., et al. Shotgun proteomics aids discovery of novel protein-coding genes, alternative splicing, and ‘resurrected’ pseudogenes in the mouse genome. Genome Res. 2011;21:756–767. doi: 10.1101/gr.114272.110. [DOI] [PMC free article] [PubMed] [Google Scholar]
- 18.Ezkurdia I., del Pozo A., Frankish A., Rodriguez J.M., Harrow J., Ashman K., Valencia A., Tress M.L. Comparative proteomics reveals a significant bias toward alternative protein isoforms with conserved structure and function. Mol. Biol. Evol. 2012;29:2265–2283. doi: 10.1093/molbev/mss100. [DOI] [PMC free article] [PubMed] [Google Scholar]
- 19.Beck M., Schmidt A., Malmstroem J., Claassen M., Ori A., Szymborska A., Herzog F., Rinner O., Ellenberg J., Aebersold R. The quantitative proteome of a human cell line. Mol. Syst. Biol. 2011;7:549. doi: 10.1038/msb.2011.82. [DOI] [PMC free article] [PubMed] [Google Scholar]
- 20.Geiger T., Wehner A., Schaab C., Cox J., Mann M. Comparative proteomic analysis of eleven common cell lines reveals ubiquitous but varying expression of most proteins. Mol. Cell Proteomics. 2012;11 doi: 10.1074/mcp.M111.014050. M111 014050. [DOI] [PMC free article] [PubMed] [Google Scholar]
- 21.Kristensen A.R., Gsponer J., Foster L.J. Protein synthesis rate is the predominant regulator of protein expression during differentiation. Mol. Syst. Biol. 2013;9:689. doi: 10.1038/msb.2013.47. [DOI] [PMC free article] [PubMed] [Google Scholar]
- 22.Munoz J., Low T.Y., Kok Y.J., Chin A., Frese C.K., Ding V., Choo A., Heck A.J. The quantitative proteomes of human- induced pluripotent stem cells and embryonic stem cells. Mol. Syst. Biol. 2011;7:550. doi: 10.1038/msb.2011.84. [DOI] [PMC free article] [PubMed] [Google Scholar]
- 23.Nagaraj N., Wisniewski J.R., Geiger T., Cox J., Kircher M., Kelso J., Pääbo S., Mann M. Deep proteome and transcriptome mapping of a human cancer cell line. Mol. Syst. Biol. 2011;7:548. doi: 10.1038/msb.2011.81. [DOI] [PMC free article] [PubMed] [Google Scholar]
- 24.Neuhauser N., Nagaraj N., McHardy P., Zanivan S., Scheltema R., Cox J., Mann M. High performance computational analysis of large-scale proteome datasets to assess incremental contribution to coverage of the human genome. J. Proteome Res. 2013;12:2858–2868. doi: 10.1021/pr400181q. [DOI] [PubMed] [Google Scholar]
- 25.Lane L., Bairoch A., Beavis R.C., Deutsch E.W., Gaudet P., Lundberg E., Omenn G.S. Metrics for the human proteome project 2013–2014 and strategies for finding missing proteins. J. Proteome Res. 2011;13:15–20. doi: 10.1021/pr401144x. [DOI] [PMC free article] [PubMed] [Google Scholar]
- 26.Farrah T., Deutsch E.W., Hoopmann M.R., Hallows J.L., Sun Z., Mendoza L., Kusebauch U., Brusniak M.Y., Hüttenhain R., Schiess R., et al. The state of the human proteome in 2012 as viewed through PeptideAtlas. J. Proteome Res. 2013;12:162–171. doi: 10.1021/pr301012j. [DOI] [PMC free article] [PubMed] [Google Scholar]
- 27.Craig R., Beavis R.C. A method for reducing the time required to match protein sequences with tandem mass spectra. Rapid Commun. Mass Sp. 2003;17:2310–2316. doi: 10.1002/rcm.1198. [DOI] [PubMed] [Google Scholar]
- 28.Craig R., Cortens J.P., Beavis R.C. Open source system for analyzing, validating, and storing protein identification data. J. Proteome Res. 2004;3:1234–1242. doi: 10.1021/pr049882h. [DOI] [PubMed] [Google Scholar]
- 29.Rodriguez J.M., Maietta P., Ezkurdia I., Pietrelli A., Wesselink J.J., Lopez G., Valencia A., Tress M.L. APPRIS: annotation of principal and alternative splice isoforms. Nucleic Acids Res. 2013;41:D110–D117. doi: 10.1093/nar/gks1058. [DOI] [PMC free article] [PubMed] [Google Scholar]
- 30.NCBI Resource Coordinators. Database resources of the National Center for Biotechnology Information. Nucleic Acids Res. 2014;42:D7–D17. doi: 10.1093/nar/gkt1146. [DOI] [PMC free article] [PubMed] [Google Scholar]
- 31.Massingham T., Goldman N. Detecting amino acid sites under positive selection and purifying selection. Genetics. 2005;169:1753–1762. doi: 10.1534/genetics.104.032144. [DOI] [PMC free article] [PubMed] [Google Scholar]
- 32.Lindblad-Toh K., Garber M., Zuk O., Lin M.F., Parker B.J., Washietl S., Kheradpour P., Ernst J., Jordan G., Mauceli E., et al. A high-resolution map of human evolutionary constraint using 29 mammals. Nature. 2011;478:476–482. doi: 10.1038/nature10530. [DOI] [PMC free article] [PubMed] [Google Scholar]
- 33.Flicek P., Amode M.R., Barrell D., Beal K., Brent S., Chen Y., Clapham P., Coates G., Fairley S., Fitzgerald S., et al. Ensembl 2011. Nucleic Acids Res. 2011;39:D800–D806. doi: 10.1093/nar/gkq1064. [DOI] [PMC free article] [PubMed] [Google Scholar]
- 34.UniProt Consortium. Update on activities at the Universal Protein Resource (UniProt) in 2013. Nucleic Acids Res. 2013;41:D43–D47. doi: 10.1093/nar/gks1068. [DOI] [PMC free article] [PubMed] [Google Scholar]
- 35.Huang da W., Sherman B.T., Lempicki A. Systematic and integrative analysis of large gene lists using DAVID bioinformatics resources. Nat. Protoc. 2009;4:44–57. doi: 10.1038/nprot.2008.211. [DOI] [PubMed] [Google Scholar]
- 36.Lee H.J., Jeong S.K., Na K., Lee M.J., Lee S.H., Lim J.S., Cha H.J., Cho J.Y., Kwon J.Y., Kim H., et al. Comprehensive genome-wide proteomic analysis of human placental tissue for the Chromosome-Centric Human Proteome Project. J. Proteome Res. 2013;12:2458–2466. doi: 10.1021/pr301040g. [DOI] [PubMed] [Google Scholar]
- 37.Farrah T., Deutsch E.W., Kreisberg R., Sun Z., Campbell D.S., Huang C.Y., Moritz R.L. PASSEL:the PeptideAtlas SRM experiment library. Proteomics. 2012;12:1170–1175. doi: 10.1002/pmic.201100515. [DOI] [PMC free article] [PubMed] [Google Scholar]
- 38.Griss J., Martín M., O'Donovan C., Apweiler R., Hermjakob H., Vizcaíno J.A. Consequences of the discontinuation of the International Protein Index (IPI) database and its substitution by the UniProtKB ‘complete proteome’ sets. Proteomics. 2011;11:4434–4438. doi: 10.1002/pmic.201100363. [DOI] [PMC free article] [PubMed] [Google Scholar]
- 39.Takeda J., Yamasaki C., Murakami K., Nagai Y., Sera M., Hara Y., Obi N., Habara T., Gojobori T., Imanishi T. H-InvDB in 2013: an omics study platform for human functional gene and transcript discovery. Nucleic Acids Res. 2013;41:D915–D919. doi: 10.1093/nar/gks1245. [DOI] [PMC free article] [PubMed] [Google Scholar]
- 40.Veeramah K.R., Thomas M.G., Weale M.E., Zeitlyn D., Tarekegn A., Bekele E., Mendell N.R., Shephard E.A., Bradman N., Phillips I.R. The potentially deleterious functional variant flavin-containing monooxygenase 2*1 is at high frequency throughout sub-Saharan Africa. Pharmacogenet. Genomics. 2008;18:877–886. doi: 10.1097/FPC.0b013e3283097311. [DOI] [PMC free article] [PubMed] [Google Scholar]
- 41.Buljan M., Frankish A., Bateman A. Quantifying the mechanisms of domain gain in animal proteins. Genome Biol. 2010;11:R74. doi: 10.1186/gb-2010-11-7-r74. [DOI] [PMC free article] [PubMed] [Google Scholar]
- 42.Moore R., Young M., Lee T. Qscore: an algorithm for evaluating SEQUEST database search results. J. Am. Soc. Mass Spectrom. 2002;13:378–386. doi: 10.1016/S1044-0305(02)00352-5. [DOI] [PubMed] [Google Scholar]
- 43.Colaert N., Van Huele C., Degroeve S., Staes A., Vandekerckhove J., Gevaert K., Martens L. Combining quantitative proteomics data processing workflows for greater sensitivity. Nat. Methods. 2011;8:481–483. doi: 10.1038/nmeth.1604. [DOI] [PubMed] [Google Scholar]
- 44.Cox J., Neuhauser N., Michalski A., Scheltema R.A., Olsen J.V., Mann M. Andromeda: a peptide search engine integrated into the MaxQuant environment. J. Proteome Res. 2011;10:1794–1805. doi: 10.1021/pr101065j. [DOI] [PubMed] [Google Scholar]
- 45.Koenig T., Menze B.H., Kirchner M., Monigatti F., Parker K.C., Patterson T., Steen J.J., Hamprecht F.A., Steen H. Robust prediction of the MASCOT score for an improved quality assessment in mass spectrometric proteomics. J. Proteome Res. 2008;7:3708–3717. doi: 10.1021/pr700859x. [DOI] [PubMed] [Google Scholar]
- 46.Rose P.W., Beran B., Bi C., Bluhm W.F., Dimitropoulos D., Goodsell D.S., Prlic A., Quesada M., Quinn G.B., Westbrook J.D., et al. The RCSB Protein Data Bank: redesigned web site and web services. Nucleic Acids Res. 2011;39:392–401. doi: 10.1093/nar/gkq1021. [DOI] [PMC free article] [PubMed] [Google Scholar]
- 47.Lopez G., Maietta P., Rodriguez J.M., Valencia A., Tress M.L. firestar—advances in the prediction of functionally important residues. Nucleic Acids Res. 2011;39:W235–W241. doi: 10.1093/nar/gkr437. [DOI] [PMC free article] [PubMed] [Google Scholar]
- 48.Punta M., Coggill P.C., Eberhardt R.Y., Mistry J., Tate J., Boursnell C., Pang N., Forslund K., Ceric G., Clements J, et al. The Pfam protein families database. Nucleic Acids Res. 2012;40:D290–D301. doi: 10.1093/nar/gkr1065. [DOI] [PMC free article] [PubMed] [Google Scholar]
- 49.Jones D.T. Improving the accuracy of transmembrane protein topology prediction using evolutionary information. Bioinformatics. 2007;23:538–544. doi: 10.1093/bioinformatics/btl677. [DOI] [PubMed] [Google Scholar]
- 50.Käll L., Krogh A., Sonnhammer E.L. A combined transmembrane topology and signal peptide prediction method. J. Mol. Biol. 2004;338:1027–1036. doi: 10.1016/j.jmb.2004.03.016. [DOI] [PubMed] [Google Scholar]
- 51.Viklund H., Elofsson A. Best alpha-helical transmembrane protein topology predictions are achieved using hidden Markov models and evolutionary information. Protein Sci. 2004;13:1908–1917. doi: 10.1110/ps.04625404. [DOI] [PMC free article] [PubMed] [Google Scholar]
- 52.Emanuelsson O., Brunak S., von Heijne G., Nielsen H. Locating proteins in the cell using TargetP, SignalP and related tools. Nat. Protoc. 2007;2:953–971. doi: 10.1038/nprot.2007.131. [DOI] [PubMed] [Google Scholar]
- 53.Blanchette M., Kent W.J., Riemer C., Elnitski L., Smit A.F., Roskin K.M., Baertsch R., Rosenbloom K., Clawson H., Green E.D., et al. Aligning multiple genomic sequences with the threaded blockset aligner. Genome Res. 2004;14:708–715. doi: 10.1101/gr.1933104. [DOI] [PMC free article] [PubMed] [Google Scholar]
- 54.Lassmann T., Sonnhammer E.L. Kalign—an accurate and fast multiple sequence alignment algorithm. BMC Bioinformatics. 2005;6:298. doi: 10.1186/1471-2105-6-298. [DOI] [PMC free article] [PubMed] [Google Scholar]
- 55.Löytynoja A., Goldman N. An algorithm for progressive multiple alignment of sequences with insertions. Proc. Natl. Acad. Sci. USA. 2005;102:10557–10562. doi: 10.1073/pnas.0409137102. [DOI] [PMC free article] [PubMed] [Google Scholar]
- 56.Roux J., Robinson-Rechavi M. Age-dependent gain of alternative splice forms and biased duplication explain the relation between splicing and duplication. Genome Res. 2011;21:357–363. doi: 10.1101/gr.113803.110. [DOI] [PMC free article] [PubMed] [Google Scholar]
- 57.Huerta-Cepas J., Dopazo H., Dopazo J., Gabaldón T. The human phylome. Genome Biol. 2007;8:R109. doi: 10.1186/gb-2007-8-6-r109. [DOI] [PMC free article] [PubMed] [Google Scholar]
- 58.Cannarozzi G., Schneider A., Gonnet G. A phylogenomic study of human, dog, and mouse. PLoS Comp. Biol. 2007;3:e2. doi: 10.1371/journal.pcbi.0030002. [DOI] [PMC free article] [PubMed] [Google Scholar]
- 59.Vilella A.J., Severin J., Ureta-Vidal A., Heng L., Durbin R., Birney E. EnsemblCompara GeneTrees: complete, duplication-aware phylogenetic trees in vertebrates. Genome Res. 2009;19:327–335. doi: 10.1101/gr.073585.107. [DOI] [PMC free article] [PubMed] [Google Scholar]
- 60.Juan D., Rico D., Marques-Bonet T., Fernández-Capetillo O., Valencia A. Late-replicating CNVs as a source of new genes. Biol. Open. 2013;2:1402–1411. doi: 10.1242/bio.20136924. [DOI] [PMC free article] [PubMed] [Google Scholar]
- 61.Domazet-Lošo T., Brajković J., Tautz D. A phylostratigraphy approach to uncover the genomic history of major adaptations in metazoan lineages. Trends Genet. 2007;23:533–539. doi: 10.1016/j.tig.2007.08.014. [DOI] [PubMed] [Google Scholar]
- 62.Altschul S.F., Madden T.L., Schäffer A.A., Zhang J., Zhang Z., Miller W., Lipman D.J. Gapped BLAST and PSI-BLAST: a new generation of protein database search programs. Nucleic Acids Res. 1997;25:3389–3402. doi: 10.1093/nar/25.17.3389. [DOI] [PMC free article] [PubMed] [Google Scholar]
Associated Data
This section collects any data citations, data availability statements, or supplementary materials included in this article.