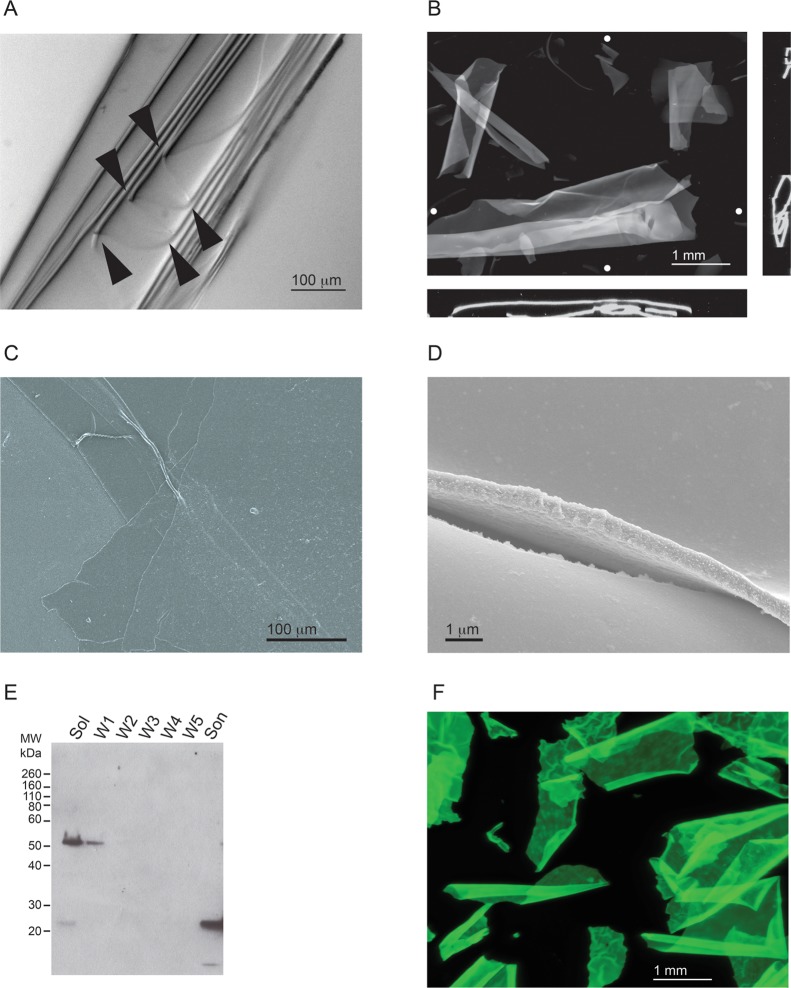
Figure 6.
Characterization of RTX-containing protein sheets. The RTX protein formed ordered polymers, which appeared as protein sheets and were visible in solution. (A) Representative image of a RTX sheet folded upon itself. Multiple folds of the sheet can be seen along an edge and are indicated by arrowheads. (B) Representative fluorescence microscopy image of sheets stained with ThT. Image stacks of RTX sheets in suspension were collected and analyzed. The RTX sheets were usually wrapped or folded along a single dimension. Orthogonal views (x–z, bottom; y–z, side) indicate the coiling or wrapping of the RTX sheets. The Z projection is shown as the sum of all stacks. White circles show the approximate positions of the vertical and horizontal orthogonal slices. (C) Scanning electron micrograph of RTX sheets at low magnification with visible folds and creases. (D) Representative image of the edge and surface of the RTX sheets at high magnification. The sheets appear to be uniform in thickness and along the edge of visualized surfaces. (E) Western blot of the material found in the RTX sheets that confirms the presence of the RTX protein. The starting material was pelleted by low-speed centrifugation and washed with refolding buffer. The supernatants were analyzed by Western blotting after each step in the procedure. Lanes are labeled as follows: Sol, soluble material after the first centrifugation step; W1–W5, successive washes of the centrifuged pellet; Son, final material after sonication. The blot was probed with a polyclonal α-RTX antibody. (F) RTX::GFP sheets were formed in the absence of Ca2+ and visualized by fluorescence microscopy. A Z projection representing the sum of all stack images is shown visualized using the intrinsic fluorescence of the GFP fusion.

