Abstract
The matrix application technique is critical to the success of a matrix-assisted laser desorption/ionization (MALDI) experiment. This work presents a systematic study aiming to evaluate three different matrix application techniques for MALDI mass spectrometric imaging (MSI) of endogenous metabolites from legume plant, Medicago truncatula, root nodules. Airbrush, automatic sprayer, and sublimation matrix application methods were optimized individually for detection of metabolites in the positive ionization mode exploiting the two most widely used MALDI matrices, 2,5-dihydroxybenzoic acid (DHB) and α-cyano-4-hydroxycinnamic acid (CHCA). Analytical reproducibility and analyte diffusion were examined and compared side-by-side for each method. When using DHB, the optimized method developed for the automatic matrix sprayer system resulted in approximately double the number of metabolites detected when compared to sublimation and airbrush. The automatic sprayer method also showed more reproducible results and less analyte diffusion than the airbrush method. Sublimation matrix deposition yielded high spatial resolution and reproducibility but fewer analytes in the higher m/z range (500–1000 m/z). When the samples were placed in a humidity chamber after sublimation, there was enhanced detection of higher mass metabolites but increased analyte diffusion in the lower mass range. When using CHCA, the optimized automatic sprayer method and humidified sublimation method resulted in double the number of metabolites detected compared to standard airbrush method.
Metabolomics is a growing field with many important biological applications including biomarker discovery, deciphering metabolic pathways in plants and other biological systems, and toxicology profiling.1−7 Studying the metabolome of a cell/organism can provide insights into its actual biochemical state.8 Most techniques currently used for metabolomics require tissue extracts, but knowing the location of a biomolecule within a specific tissue can reveal key insights into its role and function within the organism.9−11 Matrix-assisted laser desorption/ionization mass spectrometric imaging (MALDI-MSI) has become a powerful tool to visualize the distribution of a wide range of molecules directly within biological tissues.12−20
MALDI requires deposition of an organic, crystalline compound, known as matrix, on the tissue of interest to assist analyte desorption and ionization.16 The matrix application technique plays a crucial role in the quality of mass spectral images, especially when obtaining high spatial resolution images.21−23 Among other instrumental parameters, such as raster step size, laser beam diameter, etc., spatial resolution and reproducibility of results are also limited by the matrix crystal size and application consistency.23,24 In this work, three matrix application methods were systematically optimized and compared: airbrush, automatic sprayer, and sublimation. Airbrush matrix application has been widely used in MALDI imaging6,15,17,25,26 and is relatively fast and simple. The major limitation of airbrush matrix application is that the velocity of the spray is controlled manually and cannot be strictly monitored. This causes the quality of the spray to be extremely user dependent and is often not reproducible. Variations in the spray velocity and duration cause inconsistent application, and applying too much solvent to the tissue can cause analyte diffusion, especially when working with small molecules.22 Automatic sprayer systems, such as the TM-Sprayer from HTX Technologies, have been developed to remove the variability seen with manual airbrush application by robotically controlling the temperature, solvent flow rate, velocity of the matrix spraying nozzle during each pass, and number of passes. Using an automatic sprayer system, the matrix density and crystal size can be much more uniform, making the experimental results more reproducible; however, this method is more time-consuming than matrix application performed with an airbrush. Sublimation is a solvent-free matrix application technique that is becoming more and more popular for mass spectral imaging of metabolites and small molecules.27 Sublimation reduces analyte diffusion because there is no solvent sprayed directly onto the tissue that can delocalize small molecules. The drawback of this method is that the lack of solvent causes some compounds to go undetected;28 however, placing the sample in a humidity chamber, post-sublimation, may extract these higher mass compounds.
In this work, we optimized and compared the utilization of three matrix application techniques, exploiting the two most widely used MALDI matrices, 2,5-dihydroxybenzoic acid (DHB) and α-cyano-4-hydroxycinnamic acid (CHCA), using the metabolome of Medicago truncatula root and nodule tissue as a model. Previously, metabolites of various chemical species, including amino acids, sugars, organic acids, lipids, flavonoids, and their conjugates, were characterized and mapped on M. truncatula roots and nodules using the conventional matrix, DHB, applied manually with an airbrush.6 Improving the matrix application technique for high spatial resolution imaging of small molecules holds promise for better mechanistic understanding of biological pathways and processes in M. truncatula, and the methodology developed for small molecule MSI can be transferred to many other important biological systems and applications. Previous publications reported on comparison and optimization of one matrix application method for a variety of matrices,21,29,30 comparison between dry coating and spray matrix application methods,31−33 or comparison between two different spray methods.22,34 Herein, we present a detailed optimization process for three different matrix application techniques with a focus on studying endogenous small molecules. We report an automatic sprayer method that can achieve sublimation-like imaging results and a sublimation procedure that can detect a larger number of higher mass metabolites than the traditional sublimation technique.
Materials and Methods
M. truncatula plants were grown and prepared for MSI (see the Supporting Information for details). Matrix deposition was carried out using three different techniques: airbrush (Paasche Airbrush Company, Chicago, IL, USA) coupled with a 75 mL steel container, TM-Sprayer system (HTX Technologies, LLC, Carrboro, NC, USA), and a sublimation apparatus (Chemglass Life Science, Vineland, NJ, USA). The concentration of matrix applied with an airbrush was 150 mg/mL DHB (in 0.1% formic acid and 50% methanol) or 10 mg/mL CHCA (in 0.1% formic acid and 70% methanol), and the airbrush was held 35 cm from the plate. Ten or more coatings were applied; the spray duration was 15 s with a 30 s dry time between each coating. For sublimation matrix deposition, 300 mg of dry DHB or CHCA was weighed out into the reservoir of the sublimation apparatus. Two previously reported methods and adaptations of these previously reported methods were performed and compared for optimized reproducibility, metabolite detection, and signal intensity. For matrix application with the automatic sprayer, 40 mg/mL DHB (in 0.1% formic acid and 50% methanol) or 10 mg/mL CHCA (in 0.1% formic acid and 70% methanol) was used as matrix. The temperature, nozzle velocity, solvent flow rate, and number of passes were systematically changed and optimized. Methods previously reported by HTX Imaging Technologies and novel methods were investigated and compared for optimized reproducibility, metabolite detection, and signal intensity. MSI was carried out using an ultrafleXtreme MALDI-TOF/TOF, and metabolites were identified on the basis of accurate mass matching and MS/MS fragmentation6 (see the Supporting Information for details). SI Table 1, Supporting Information, lists the identified metabolites shown in subsequent figures, and SI Figures 1–5, Supporting Information, show MS/MS spectra of the metabolites detected in the Medicago root nodules compared to metabolite standards in order to confirm the metabolite identifications.
Results and Discussion
Airbrush Matrix Application
Previous work used the well-established airbrush application as described above to map metabolites in root nodules and neuropeptides in crustacean tissue with MALDI-MSI.6,15,35 The quality of the matrix application varies greatly depending on the skill and preference of the user.
Sublimation Matrix Application
For DHB, two previously reported methods21,27 and two adaptations of these previously reported methods were performed and compared for optimized reproducibility, metabolite detection, and signal intensity. A summary of the parameters used for each of the four methods is listed in SI Table 2, Supporting Information. Method 1, reported by Hankin et al.,27 started at room temperature (RT) and gradually increased to 110 °C. The procedure reported by Thomas et al.21 (Method 2) required a temperature of 140 °C, but a drop in temperature was observed as the sublimation apparatus was placed into the heating mantle. Therefore, in the method adapted from this procedure (Method 3), the temperature was initially set to 190 °C so the temperature would drop to 140 °C when the sublimation apparatus was placed in the heating mantle. Method 4 adds an additional step to Method 1, similar to the procedure proposed by Goodwin et al., in which the samples were exposed to a saturated moist atmosphere after sublimation.31 After the matrix sublimation was complete, the glass slide was placed in a humidity chamber with deionized water for approximately 45 min and allowed to dry at room temperature before MSI. It was observed that the methods that gradually raised the temperature from RT gave more even coverage of matrix and performed more consistently between runs. In this comparison, analyte signal was distinguished from matrix signal using the MS images as guides. MS images were extracted by manually clicking on each peak in the spectrum. Peaks corresponding to images where no signal was seen in the matrix-only area and signal was present on the M. truncatula tissue were considered metabolites. Significantly more metabolite peaks were observed using gradual heating with the humidity chamber step (Method 4), in comparison with gradual heating and no humidity (Method 1), especially in the higher mass region (above m/z 500). SI Figure 6, Supporting Information, shows several representative MS images comparing gradual heating sublimation methods without and with humidity (Methods 1 and 4 respectively), illustrating that gradual heating without humidity produced less analyte diffusion than gradual heating with humidity in the lower mass range, while gradual heating with humidity enhanced metabolite detection in the higher mass range. SI Figure 6, Supporting Information, also compares the MS spectra from these methods, showing the increased detection of higher m/z metabolites when the humidity step was employed.
For CHCA, five gradual heating methods were examined that involved beginning at RT and gradually increasing the temperature to 120, 140, 150, 152, or 160 °C over the course of 10 min. Heating to 152 °C provided homogeneous coverage and good signal intensity, to 160 °C generated too thick of a layer of CHCA, and to 150 °C resulted in slightly too thin of a layer to give consistent results. A sixth method was examined in which the sublimation chamber was gradually heated to 152 °C over 10 min, followed by 45 min in the humidity chamber as described above. A summary of the parameters used for each of the four methods is listed in SI Table 3, Supporting Information. Unlike the results described above, adding the humidity chamber step did not increase the metabolite detection and only served to diffuse analytes in the lower mass region.
Automatic Sprayer Matrix Application
For DHB, five automatic sprayer matrix application methods were developed for the automatic TM-Sprayer system. The parameters used for each of the five methods are summarized in SI Table 4, Supporting Information; 3 mm line spacing and a nozzle temperature of 80 °C was used for all methods. The first method (Method 1) was recommended by the manufacturer of the automatic sprayer system method for detecting metabolites. The solvent flow rate and spray nozzle velocity were changed in the different methods to produce a drier spray. As the solvent flow rate decreases, the spray becomes drier because less solvent is being sprayed onto the sample. Increasing the velocity of the spray nozzle also produces a drier spray because the nozzle is spraying matrix over the sample for a shorter period of time. Method 4, listed in the table, is the driest, most sublimation-like spray because it has the highest nozzle velocity and the lowest solvent flow rate. Changing the number of passes allows for adjustment of the matrix density to provide suitable MS signal. All methods performed with the automatic sprayer system provide excellent reproducibility and consistency in crystal size and coverage. The number of metabolites detected and the extent of analyte diffusion, visualized with MSI, was compared between all five methods; representative MS images comparing 3 of the sprayer methods are shown in SI Figure 7, Supporting Information. The “driest method” (Method 4) allowed for the detection of nearly double the number of metabolites when compared to the other four methods examined. The use of Method 4 allowed for detection of metabolites over the entire mass range suggesting that the method was dry enough to detect metabolites in the low mass region without causing them to diffuse and dilute but had enough solvent to extract higher mass metabolites from the tissue for detection.
For CHCA, six automatic sprayer matrix application methods were developed for the automatic TM-Sprayer system. The parameters used for each of the six methods are summarized in SI Table 5, Supporting Information; a nozzle temperature of 80 °C was used for all methods. All automatic sprayer methods performed equivalently with regards to metabolite detection and little analyte diffusion; therefore, the optimized method is the method suggested by the manufacturer because it requires the least amount of time for application. Using 10 mg/mL CHCA may require extra cleaning of the sprayer apparatus depending on the quality of the syringe pump used in the setup; we recommend using 5 mg/mL CHCA and doubling the number of passes to achieve equivalent results without the chance of clogging the sprayer.
Comparison of Optimized Airbrush, Sublimation, and Automatic Sprayer Methods
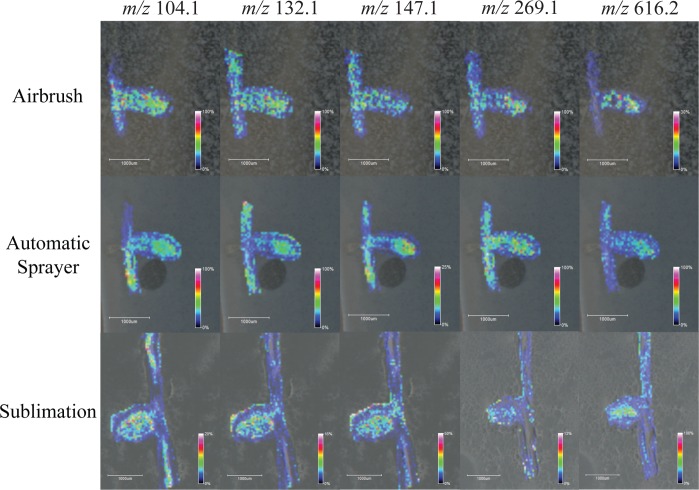
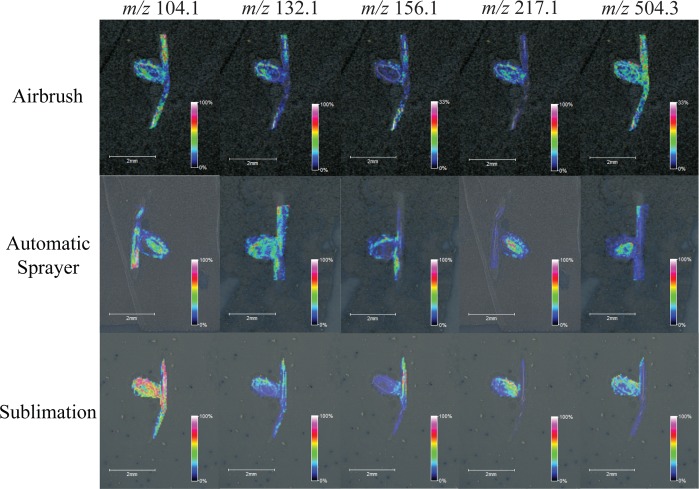
The optimized sublimation and automatic sprayer methods were directly compared to the standard, well-used airbrush matrix application method by performing MSI on serial sections of M. truncatula root nodule tissue, for both DHB and CHCA. When applying matrix with these three very different techniques and performing MSI of samples coated using the different application methods in a single run, the overall signal and metabolite detection decreased significantly when compared to results from performing MSI of the techniques individually. One reason for this could be due to the varying crystal size in a single experiment, which causes limited detection in TOF/TOF mass analyzers. Even with the decreased metabolite detection, it is still clear that the optimized automatic sprayer method facilitates the detection of the highest number of metabolites. Figure 1 shows optical images comparing matrix coverage and crystal size for the airbrush, optimized automatic sprayer, and optimized sublimation matrix application methods respectively for (a) DHB and (b) CHCA. Sublimation produces one even layer of matrix; the automatic sprayer produces very small, uniform crystals, while the airbrush produces larger crystals of varying sizes. Figure 2 compares MS profiling spectra for pure matrix using the airbrush (blue), optimized automatic sprayer (red), and optimized sublimation (green) matrix application methods for (a) DHB and (b) CHCA. For both matrices, the matrix signal is highest in the airbrush spectrum and there are more matrix ion peaks than the other two methods, which could cause interference with some of the metabolites of interest. All three matrix application techniques produce slightly different matrix ion peak patterns; the automatic sprayer and sublimation techniques could be complementary ways to detect low molecular weight metabolites that are masked by high intensity matrix peaks. Figures 3 and 4 show comparisons of representative MS images of M. truncatula root nodules using the airbrush, automatic sprayer, and sublimation methods optimized for DHB and CHCA, respectively. Compared to the airbrush method, the sublimation and automatic sprayer methods show less analyte diffusion and a greater number of metabolites detected. For DHB, the sublimation method shows some analyte diffusion in the lower mass range due to the humidity chamber step, but there are also some metabolites detected in the higher mass range that would not have been detected without the humidity chamber step.
Figure 1.
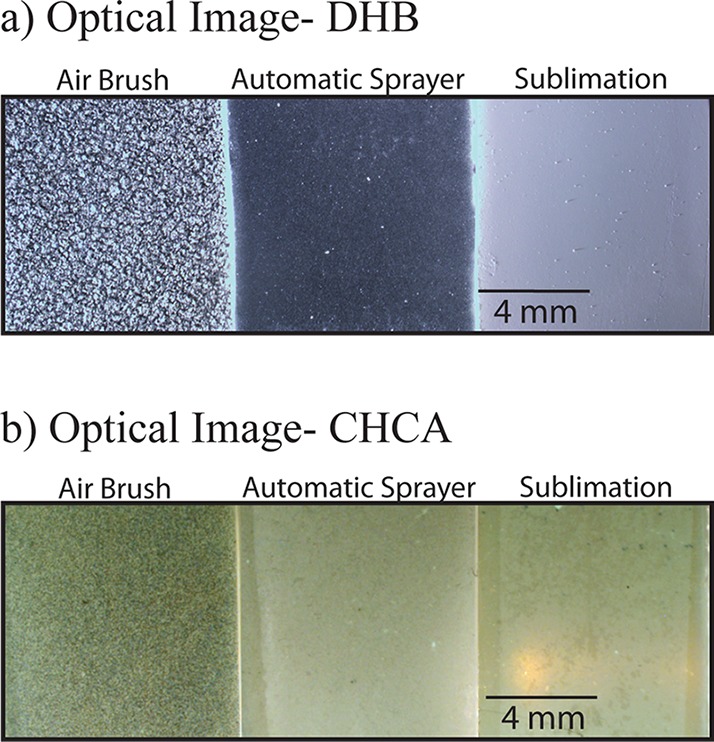
Comparison of MALDI-MSI of Medicago truncatula root nodules using the previously reported airbrush method, automatic sprayer Method 4, and sublimation Method 4. (a) Optical images comparing matrix coverage and crystal size for the airbrush (left), optimized automatic sprayer (middle), and optimized sublimation (right) matrix application methods using DHB for the matrix. (b) Optical images comparing matrix coverage and crystal size for the airbrush (left), optimized automatic sprayer (middle), and optimized sublimation (right) matrix application methods using CHCA for the matrix.
Figure 2.
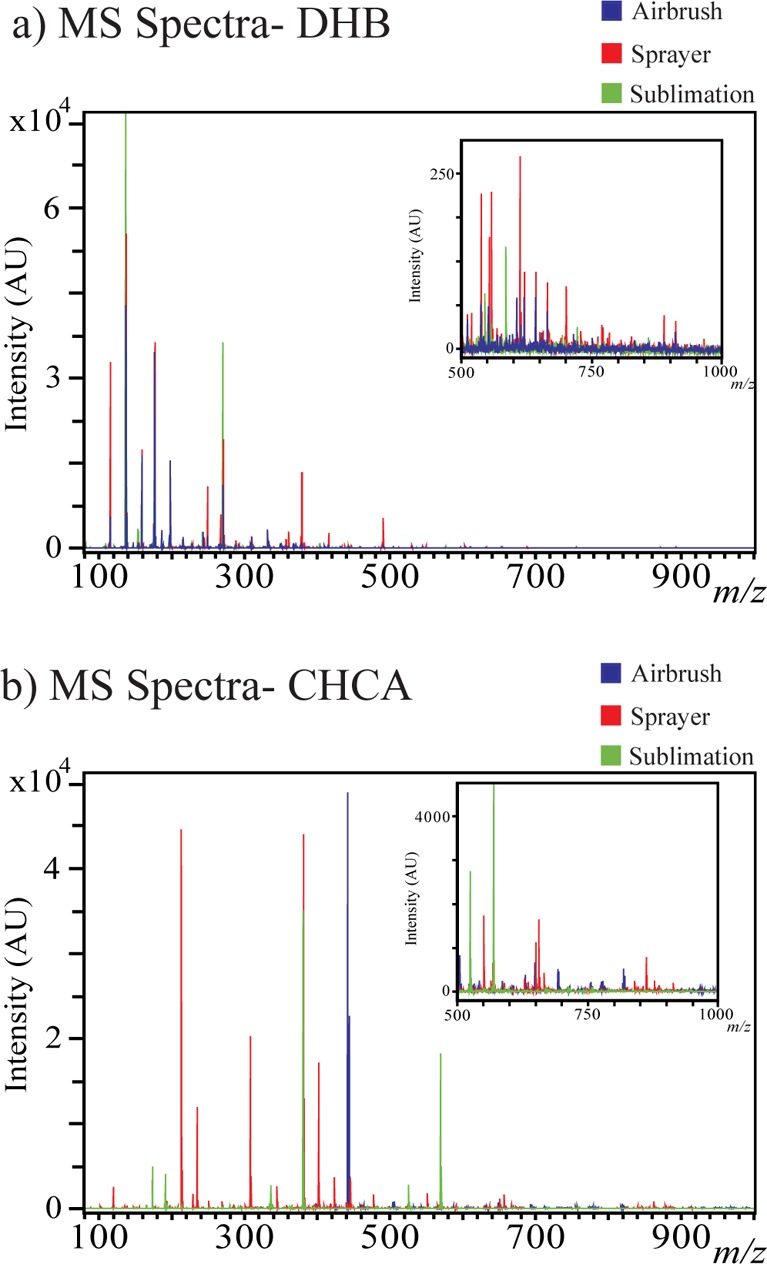
MS profiles of pure (a) DHB and (b) CHCA matrix peaks (with no sample) when applied to a glass slide with the airbrush (blue), optimized automatic sprayer (red), and the optimized sublimation (green) matrix application methods. Inlays show the MS spectra zoomed in to the higher m/z range (m/z 500–1000).
Figure 3.
Images generated of m/z 104.1 (choline), m/z 132.1 (leucine), m/z 147.1 (glutamine), m/z 269.1 (unknown), and m/z 616.2 (heme, [M+]) by applying DHB with the airbrush (top), optimized automatic sprayer method (middle), and optimized sublimation method (bottom) to serial sections of Medicago truncatula root nodules.
Figure 4.
Images generated of m/z 104.1 (choline), m/z 132.1 (leucine), m/z 156.1 (histidine), m/z 217.1 (unknown), and m/z 504.3 (unknown) by applying CHCA with the airbrush (top), optimized automatic sprayer method (middle), and optimized sublimation method (bottom) to serial sections of Medicago truncatula root nodules.
Conclusions
Monitoring metabolite distribution is extremely important for the overall understanding of molecular pathways in many biological systems and fields of study. This work presents a comprehensive evaluation of three major MALDI matrix application techniques with the two most widely used matrices (DHB and CHCA) for MS imaging of small molecules. The use of the optimized automatic sprayer methods significantly increases the number of metabolites detected within a defined mass range, especially when using DHB. The ability of the automatic sprayer to enhance metabolite detection while maintaining the spatial distribution of small molecules within a biological tissue sample, when compared to airbrush and sublimation matrix application methods, was demonstrated by acquiring positive ion images from serial tissue sections of M. truncatula. The optimized automatic sprayer method and sublimation methods reduce analyte diffusion that is typically seen with traditional airbrush matrix application methods.
The combined use of solvent-free (sublimation) and solvent-based (automatic sprayer) matrix application techniques can provide complementary matrix peak profile results, providing the possibility to detect metabolites that were masked by interfering matrix ion peaks in one matrix application method but not masked in the other. There were very few metabolites that were only detected with the sublimation or airbrush methods; therefore, the optimized automatic sprayer method is recommended for detection of the greatest number of metabolites during a single experiment.
Strict optimization of matrix application technique seems to be more critical when working with DHB. The procedure for applying DHB with the automatic sprayer or via sublimation was extremely critical to the quality of the MS images, whereas similar results were obtained using CHCA regardless of the procedure used to apply the matrix.
Using the optimized sprayer methods to apply DHB and CHCA, respectively, on serial sections of plant root nodule tissue provided complementary detection of endogenous metabolites. Over 100 compounds were detected using each matrix with approximately 60% of the detected metabolites uniquely detected using either DHB or CHCA and approximately 40% overlap between methods. Future work using alternative matrices in both positive and negative ionization modes to test the ability of the optimized automatic sprayer method compared to the optimized sublimation method would further characterize the advantages of using one method over the other or a combination of both automatic sprayer and sublimation matrix application techniques.
Acknowledgments
The authors would like to acknowledge Dr. Jean-Michel Ané in the Department of Agronomy at UW-Madison for providing Medicago truncatula samples. The authors would like to acknowledge Dr. John Markley, the National Magnetic Resonance Facility at Madison (NMRFAM), which is supported by NIH grant P41GM103399 (NIGMS), and the Biological Magnetic Resonance Data Bank (BMRB), which is funded by R01 GM109046, for the use of the heme standard. This work was supported by funding from a National Science Foundation (NSF) Graduate Research Fellowship (DGE-1256259) to E.G. and by funding from the University of Wisconsin Graduate School and the Wisconsin Alumni Research Foundation (WARF) and Romnes Faculty Research Fellowship program to L.L. The instrument purchase was funded by an NIH shared instrument grant (NCRR S10RR029531).
Supporting Information Available
Additional information as noted in text. This material is available free of charge via the Internet at http://pubs.acs.org.
The authors declare no competing financial interest.
Funding Statement
National Institutes of Health, United States
Supplementary Material
References
- Wei R. Curr. Drug Metab. 2011, 12, 345–358. [DOI] [PubMed] [Google Scholar]
- Kobayashi T.; Nishiumi S.; Ikeda A.; Yoshie T.; Sakai A.; Matsubara A.; Izumi Y.; Tsumura H.; Tsuda M.; Nishisaki H.; Hayashi N.; Kawano S.; Fujiwara Y.; Minami H.; Takenawa T.; Azuma T.; Yoshida M. Cancer Epidemiol., Biomarkers Prev. 2013, 22, 571–579. [DOI] [PubMed] [Google Scholar]
- West P. R.; Weir A. M.; Smith A. M.; Donley E. L. R.; Cezar G. G. Toxicol. Appl. Pharmacol. 2010, 247, 18–27. [DOI] [PubMed] [Google Scholar]
- Spegel P.; Sharoyko V. V.; Goehring I.; Danielsson A. P.; Malmgren S.; Nagorny C. L.; Andersson L. E.; Koeck T.; Sharp G. W.; Straub S. G.; Wollheim C. B.; Mulder H. Biochem. J. 2013, 450, 595–605. [DOI] [PubMed] [Google Scholar]
- Pendyala G.; Want E. J.; Webb W.; Siuzdak G.; Fox H. S. J. Neuroimmune Pharm. 2007, 2, 72–80. [DOI] [PubMed] [Google Scholar]
- Ye H.; Gemperline E.; Venkateshwaran M.; Chen R.; Delaux P. M.; Howes-Podoll M.; Ane J. M.; Li L. Plant J. 2013, 75, 130–145. [DOI] [PubMed] [Google Scholar]
- Gemperline E.; Li L. J. Vis. Exp. 2014, e51434. [DOI] [PMC free article] [PubMed] [Google Scholar]
- Amaya K. R.; Sweedler J. V.; Clayton D. F. J. Neurochem. 2011, 118, 499–511. [DOI] [PMC free article] [PubMed] [Google Scholar]
- McDonnell L. A.; Heeren R. M. A. Mass. Spectrom. Rev. 2007, 26, 606–643. [DOI] [PubMed] [Google Scholar]
- Goto-Inoue N.; Hayasaka T.; Zaima N.; Setou M. Surf. Interface Anal. 2012, 44, 749–754. [Google Scholar]
- Yang H. J.; Sugiura Y.; Ishizaki I.; Sanada N.; Ikegami K.; Zaima N.; Shrivas K.; Setou M. Surf. Interface Anal. 2010, 42, 1606–1611. [Google Scholar]
- Lee Y. J.; Perdian D. C.; Song Z. H.; Yeung E. S.; Nikolau B. J. Plant J. 2012, 70, 81–95. [DOI] [PubMed] [Google Scholar]
- Stoeckli M.; Chaurand P.; Hallahan D. E.; Caprioli R. M. Nat. Med. 2001, 7, 493–496. [DOI] [PubMed] [Google Scholar]
- Kaspar S.; Peukert M.; Svatoš A.; Matros A.; Mock H. P. Proteomics 2011, 11, 1840–1850. [DOI] [PubMed] [Google Scholar]
- DeKeyser S. S.; Kutz-Naber K. K.; Schmidt J. J.; Barrett-Wilt G. A.; Li L. J. Proteome Res. 2007, 6, 1782–1791. [DOI] [PMC free article] [PubMed] [Google Scholar]
- Caprioli R. M.; Farmer T. B.; Gile J. Anal. Chem. 1997, 69, 4751–4760. [DOI] [PubMed] [Google Scholar]
- Lietz C. B.; Gemperline E.; Li L. Adv. Drug Delivery Rev. 2013, 65, 1074–1085. [DOI] [PMC free article] [PubMed] [Google Scholar]
- Hamm G.; Carre V.; Poutaraud A.; Maunit B.; Frache G.; Merdinoglu D.; Muller J. F. Rapid Commun. Mass Spectrom. 2010, 24, 335–342. [DOI] [PubMed] [Google Scholar]
- Lazova R.; Seeley E. H.; Keenan M.; Gueorguieva R.; Caprioli R. M. Am. J. Dermatopathol. 2012, 34, 82–90. [DOI] [PMC free article] [PubMed] [Google Scholar]
- Liu Q.; Xiao Y. S.; Pagan-Miranda C.; Chiu Y. M.; He L. J. Am. Soc. Mass Spectrom. 2009, 20, 80–88. [DOI] [PubMed] [Google Scholar]
- Thomas A.; Charbonneau J. L.; Fournaise E.; Chaurand P. Anal. Chem. 2012, 84, 2048–2054. [DOI] [PubMed] [Google Scholar]
- Baluya D. L.; Garrett T. J.; Yost R. A. Anal. Chem. 2007, 79, 6862–6867. [DOI] [PubMed] [Google Scholar]
- Goodwin R. J. A. J. Proteomics 2012, 75, 4893–4911. [DOI] [PubMed] [Google Scholar]
- Balluff B.; Schone C.; Hofler H.; Walch A. Histochem. Cell Biol. 2011, 136, 227–244. [DOI] [PubMed] [Google Scholar]
- Shimma S.; Sugiura Y.; Hayasaka T.; Hoshikawa Y.; Noda T.; Setou M. J. Chromatogr., B 2007, 855, 98–103. [DOI] [PubMed] [Google Scholar]
- Ye H.; Gemperline E.; Li L. Clin. Chim. Acta 2013, 420, 11–22. [DOI] [PMC free article] [PubMed] [Google Scholar]
- Hankin J. A.; Barkley R. M.; Murphy R. C. J. Am. Soc. Mass Spectrom. 2007, 18, 1646–1652. [DOI] [PMC free article] [PubMed] [Google Scholar]
- Rubakhin S. S.; Jurchen J. C.; Monroe E. B.; Sweedler J. V. Drug Discovery Today 2005, 10, 823–837. [DOI] [PubMed] [Google Scholar]
- Peukert M.; Matros A.; Lattanzio G.; Kaspar S.; Abadia J.; Mock H. P. New Phytol. 2012, 193, 806–815. [DOI] [PubMed] [Google Scholar]
- Shanta S. R.; Kim T. Y.; Hong J. H.; Lee J. H.; Shin C. Y.; Kim K. H.; Kim Y. H.; Kim S. K.; Kim K. P. Analyst 2012, 137, 5757–5762. [DOI] [PubMed] [Google Scholar]
- Goodwin R. J.; Macintyre L.; Watson D. G.; Scullion S. P.; Pitt A. R. Rapid Commun. Mass Spectrom. 2010, 24, 1682–1686. [DOI] [PubMed] [Google Scholar]
- Trimpin S.; Herath T. N.; Inutan E. D.; Wager-Miller J.; Kowalski P.; Claude E.; Walker J. M.; Mackie K. Anal. Chem. 2010, 82, 359–367. [DOI] [PubMed] [Google Scholar]
- Goodwin R. J. A.; Mackay C. L.; Nilsson A.; Harrison D. J.; Farde L.; Andren P. E.; Iverson S. L. Anal. Chem. 2011, 83, 9694–9701. [DOI] [PubMed] [Google Scholar]
- Chen Y.; Allegood J.; Liu Y.; Wang E.; Cachon-Gonzalez B.; Cox T. M.; Merrill A. H. Jr.; Sullards M. C. Anal. Chem. 2008, 80, 2780–2788. [DOI] [PubMed] [Google Scholar]
- Chen R.; Cape S. S.; Sturm R. M.; Li L. Methods Mol. Biol. 2010, 656, 451–463. [DOI] [PubMed] [Google Scholar]
Associated Data
This section collects any data citations, data availability statements, or supplementary materials included in this article.


