

Abstract
Genome-wide association studies identified novel genes associated with T2DM which have been replicated in different populations. We try to examine here if certain frequently replicated SNPs of Insulin growth factor 2 m-RNA binding protein 2 (IGF2BP2) (rs4402960, rs1470579) and Solute Carrier family 30 member 8 (SLC30A8) (rs13266634) genes, known to be implicated in insulin pathway, are associated with T2DM in the population of Hyderabad, which is considered to be a diabetic capital of India. Genotyping of the 1379 samples, 758 cases and 621 controls, for the SNPs was performed on sequenom massarray platform. The logistic regression analysis was done using SPSS software and the post-hoc power of the study was estimated using G power. The allele and genotype frequencies were similar between cases and controls, both for SNPs of IGF2BP2 and SLC30A8 genes. Logistic regression did not reveal significant allelic or genotypic association of any of the three SNPs with T2DM. Despite large sample size and adequate power, we could not replicate the association of IGF2BP2 and SLC30A8 SNPs with T2DM in our sample from Hyderabad (A.P.), India, albeit another study based on much larger sample but from heterogeneous populations from the northern parts of India showed significant association of two of the above 3 SNPs, suggesting variable nature of susceptibility of these genes in different ethnic groups. Although the IGF2BP2 and SLC30A8 genes are important in the functional pathway of Insulin secretion, it appears that these genes do not play a significant role in the susceptibility to T2DM in this population.
Abbreviations: T2DM, Type 2 diabetes mellitus; GWAS, Genome wide association studies; SNP, Single Nucleotide Polymorphism; IGF2BP2, Insulin growth factor 2 m-RNA binding protein 2; SLC30A8, Solute Carrier family 30 member 8; ADA, American Diabetes Association; FPG, Fasting Plasma Glucose; PPG, Post-prandial Plasma Glucose; RBG, Random Plasma Glucose; BMI, Body Mass Index; WHR, Waist Hip Ratio; SPSS, Statistical Package for Social Sciences; PyPop, Python for Population Genomics; SBP, Systolic Blood Pressure; DBP, Diastolic Blood Pressure; LD, Linkage Disequilibrium; IMP1, Insulin-like growth factor 2 mRNA-binding protein 1; ZnT8, Zinc Transporter 8; PCOS, Polycystic Ovarian Syndrome; O.R., Odds Ratio; C.I., Confidence Interval.
Keywords: Type 2 diabetes mellitus (T2DM), Single nucleotide polymorphism (SNP), Association, Population of Hyderabad, India
Highlights
-
•
First genetic association study of T2DM in the population of Hyderabad, India
-
•
1379 subjects were genotyped for three SNPs of IGF2BP2 and SLC30A8 genes
-
•
Despite adequate power, none of the SNPs could be replicated in our population
-
•
Ethnic variability and different genetic predisposition of Indians could explain
1. Introduction
Type 2 diabetes mellitus (T2DM) is characterized by elevated levels of blood glucose caused by the impairment in both insulin secretion and action. It usually begins as insulin resistance disorder in which the cells do not respond to insulin properly. As the need for insulin rises, pancreas gradually loses its ability to produce insulin. Insulin plays a key role in the glucose metabolism and the genes involved in the insulin pathway are of prime importance in dissecting the role of genetic factors in the etiology of T2DM. With the development of microarray platforms, genome-wide association studies (GWAS) have shed light on many novel genes showing strong association withT2DM. Insulin growth factor 2 m-RNA binding protein 2 (IGF2BP2) and Solute Carrier family 30 member 8 (SLC30A8) are two such genes which were identified only through GWAS and subsequently replicated in many populations across the globe (Parra et al., 2011; Perry et al., 2012; Scott et al., 2007; Sladek et al., 2007; Steinthorsdottir et al., 2007; Takeuchi et al., 2009; Timpson et al., 2009; Voight et al., 2010; Zeggini et al., 2007).
The IGF2BP2 gene is involved in insulin secretion, essential for glucose metabolism. This gene has shown conflicting results regarding the nature of its association with T2DM, particularly the two SNPs of this gene – rs4402960 and rs1470579 – that we have analyzed were the most commonly studied polymorphisms in different populations and yielded both strong (Cauchi et al., 2008, 2012; Gamboa-Meléndez et al., 2012; Grarup et al., 2007; Han et al., 2010; Herder et al., 2008; Hu et al., 2009; Nemr et al., 2012; Tabara et al., 2009; Wu et al., 2008) as well as weak or no association (Duesing et al., 2008; Horikoshi et al., 2007; Pascoe et al., 2007). The lack of consistency in these studies may be primarily attributed to the inadequate statistical power because of small sample size as well as ethnic variability. In view of the conflicting findings several meta-analyses were carried out and the results suggest that the variants of IGF2BP2 confer increased risk for T2DM in the European and Asian populations (Jia et al., 2011; Zhao et al., 2012). On the other hand, the SLC30A8 gene is a member of zinc transporter family involved in the insulin secretion. This zinc transporter is involved in the process of Insulin synthesis, storage and secretion. This gene was identified in the first GWAS study of T2DM in French population (Sladek et al., 2007) and subsequent replication studies and meta-analysis also confirmed its association with T2DM (Cauchi et al., 2010; Jing et al., 2011). The rs13266634 of SLC30A8 gene is the most studied SNP showing strong association with T2DM (Cauchi et al., 2008; Gamboa-Meléndez et al., 2012; Han et al., 2010; Hu et al., 2009; Huang et al., 2010; Potapov et al., 2010; Xiang et al., 2008), albeit a few studies were non-conformatory (Furukawa et al., 2008; Horikoshi et al., 2007; Pascoe et al., 2007).
The rapid process of urbanization and adaption of western lifestyles by the Indians coupled with ‘Asian Indian Phenotype’ (Mohan et al., 2007) makes the people of this country more vulnerable to develop T2DM and share greater burden of this global epidemic. Therefore, it is imperative to validate T2DM susceptible genes that were found associated in non-Indian populations among diverse ethnic and geographic populations of India. Although a couple of studies tested for association of IGF2BP2 and SLC30A8 gene variants with T2DM, an inconsistent pattern of association was observed in the North and South Indian populations with respect to these genes; while IGF2BP2 showed strong association with T2DM in North Indians (Chauhan et al., 2010; Sanghera et al., 2008) it was not shown in the South Indians from Chennai (Chidambaram et al., 2010). Further, within North India, the SLC30A8 gene displayed both significant (Chauhan et al., 2010) and non-significant associations (Sanghera et al., 2008) with T2DM in two independent samples. In this context, it may be pertinent to note that in a recent study Reich et al. (2009), based on comprehensive genetic data, suggest distinct origin and genetic architecture of north and south Indian populations. Therefore, it is necessary to test the pattern of association of these polymorphisms with T2DM in diverse ethnic and geographic populations within India in order to establish if the nature of association of these genes with T2DM is universal to the Indian populations, in general. The city of Hyderabad which is considered as diabetic capital of India and the population of Andhra Pradesh with putatively high and ever increasing prevalence of T2DM have not been hitherto studied for the nature of their genetic susceptibility. To the best of our knowledge, this is the first study dealing with the nature of genetic association of T2DM in the population of Andhra Pradesh, India. We report here the results of our study on the association of three SNPs of IGF2BP2 (rs4402960, rs1470579-Intron2) and SLC30A8 (rs13266634-cds) genes with T2DM in this specific population.
2. Materials & methods
2.1. Study design
This is a case–control study for which 758 T2DM cases (443 males and 315 females) and 621 controls (395 males and 226 females) were included. The T2DM patients were recruited from J.P. Endocrine Center, Hyderabad, based on their medical record and adhering to ADA (2010) criteria that specifies fasting plasma glucose(FPG) ≥ 126 mg/dl or 2 -h plasma glucose (PPG) ≥ 200 mg/dl or random plasma glucose (random blood sugar) (RBG) ≥ 200 mg/dl to be characterized as diabetic. We have conducted free diabetic camps for the employees of different organizations in Hyderabad and individuals with ≥ 40 years of age were tested for random blood sugar (where fasting and 2 -h plasma glucose were not feasible) and those having blood sugar < 140 mg/dl and no identifiable positive family history were recruited as controls. The background information such as sex, present age, age at onset of T2DM, family history and the lifestyle parameters such as food habits, smoking, alcohol consumption and physical activity were gathered in the form of a questionnaire. Anthropometric measurements like height, weight, waist and hip circumferences were also collected and body mass index (BMI) and waist to hip ratio (WHR) were calculated. All the above mentioned information and measurements were collected on both cases and controls. About 5 ml of blood was collected from each of the T2DM cases and controls with written informed consent.
2.2. Ethics statement
The study was approved by the Indian Statistical Institute Review Committee for Protection of Research Risks to Humans.
2.3. DNA extraction and genotyping
We isolated DNA using the phenol–chloroform method (Sambrook et al., 1989). Quantification of the extracted DNA was performed using NanoDrop. The SNPs of IGF2BP2 (rs4402960, rs1470579) and SLC30A8 (rs13266634) genes, were genotyped, as part of a panel of 15 SNPs, on Sequenom Massarray platform (Gabriel et al., 2009) at the Centre for Genomic Application (TCGA), Delhi. The raw data files generated by Mass Array Sequenom were analyzed for the intensity peaks of calibrant to ascertain the quality of the data. An overall call rate of > 95% was maintained. For every 96 samples (a quadrant of Sequenom chip), 4 samples were duplicated and the call rates were checked for concordance. The calls in the negative control (no DNA) were also monitored in all the runs.
2.4. Statistical analysis
Most of the statistical analyses were performed with the help of SPSS statistical software (version 18.0, IBM SPSS). Post-hoc power of the study was estimated using G*Power software (version 3.1). The Hardy–Weinberg equilibrium was estimated by the χ2 test using Pypop software. Haploview software was used to obtain estimates of Linkage Disequilibrium.
3. Results
3.1. Clinical profile of the subjects
Table 1 presents the clinical profile of the subjects represented by mean, median and range for different variables, viz., age of the subjects, age at onset of the disease, BMI, WHR, FPG, PPG, SBP and DBP. Overall, the sample, albeit not purposive, represents a relatively greater proportion of male subjects in the ratio of ~ 3:2. Broadly speaking, similar age range, mean and median values were presented by the cases and controls. However, the mean and median values of BMI, WHR and RBG of the cases were not only much higher than the controls but also highly significantly different (p < 0.01) from them.
Table 1.
Clinical profile of the T2DM cases and controlsb.
| Variables | Meana |
Median |
Range |
|||
|---|---|---|---|---|---|---|
| Cases (N = 758) | Controls (N = 621) | Cases | Controls | Cases | Controls | |
| Age | 52.5 (9.08) | 52.20(7.55) | 52.00 | 50.00 | 31–80 | 40–85 |
| Age at onset (yrs) of T2DM | 44.78 (8.65) | – | 45.00 | – | 25–71 | – |
| Duration of the disease (yrs) | 9.18 (7.69) | – | 7.00 | – | 1–38 | – |
| BMI | 27.07 (4.63) | 24.72(4.62) | 26.5 | 24.80 | 13.0–44.1 | 12.8–29.0 |
| WHR | 1.69 (0.43) | 0.94(0.03) | 1.67 | 0.95 | 0.55–3.51 | 0.72–1.09 |
| FPG (mg/dl) | 115.50 (32.45) | – | 108.00 | – | 47–323 | – |
| PPG (mg/dl) | 195.71 (52.83) | – | 191.00 | – | 82–409 | – |
| RBG (mg/dl) | 199.27 (81.60) | 110.65(15.93) | 185.50 | 108.00 | 73–520 | 70–139 |
| SBP (mm Hg) | 128.11 (10.73) | – | 130.00 | – | 94–180 | – |
| DBP (mm Hg) | 80.02 (8.57) | – | 80.00 | – | 20–215 | – |
Numbers in the parentheses are the SDs.
Control subjects were not measured for blood pressure and FPG and PPG.
3.2. Allele and genotype frequencies
The allele and genotype frequencies of the three SNPs are presented in Tables 2 & 3. The observed genotype counts were found to be similar in frequency as compared to those expected under Hardy–Weinberg Equilibrium and the χ2 test suggests that all the three SNP loci conform to the Hardy–Weinberg equilibrium in both case and control samples. Further, the two SNPs of IGF2BP2 located in the intron 2 were found to be in strong LD with D′ = 0.99 and r2 = 0.98 (Fig. 1). The allele and genotype frequencies were similar between cases and controls in case of both the genes. The logistic regression analysis did not reveal significant allelic or genotypic association of any of the three SNPs with T2DM. The logistic regression with BMI and WHR as covariates suggests significant effect of covariates, not of genotypes (Table 3).
Table 2.
Allele frequency distribution and odds ratios from logistic regression of T2DM on the IGF2BP2 (rs4402960, rs1470579) and SLC30A8 (rs13266634) SNPs in the population of Hyderabad.
| Gene | SNP | Major/minor allele | Cases (N = 758) | Controls (N = 621) | χ2 | O.R. | (95% C.I.) | p value |
|---|---|---|---|---|---|---|---|---|
| IGF2BP2 | rs4402960 | G | 0.49 | 0.51 | 1.52 | 1.10 | 0.95–1.28 | 0.22 |
| T | 0.51 | 0.49 | ||||||
| rs1470579 | A | 0.49 | 0.51 | 1.66 | 1.11 | 0.95–1.29 | 0.20 | |
| C | 0.51 | 0.49 | ||||||
| SLC30A8 | rs13266634 | C | 0.78 | 0.77 | 0.31 | 0.95 | 0.79–1.14 | 0.58 |
| T | 0.22 | 0.23 |
Table 3.
Frequency distribution of the genotypes of the three SNPs of IGF2BP2 and SLC30A8 genes in T2DM cases and controls and odds ratios from logistic regression of T2DM on genotype frequency using wild homozygote as reference and adjusted for co-variates.
| Gene | SNP | Genotype | Cases (N = 758) | Controls (N = 621) | χ2 | p value | Genotypes | p value | O.R. | 95% C.I. | Adjusted for BMI, WHR |
||
|---|---|---|---|---|---|---|---|---|---|---|---|---|---|
| p value | OR | 95% C.I. | |||||||||||
| IGF2BP2 | rs4402960 | GG | 0.23 | 0.27 | 1.83 | 0.40 | GT Vs GG | 0.25 | 1.17 | 0.90–1.53 | 0.39 | 1.13 | 0.86–1.49 |
| GT | 0.51 | 0.49 | TT Vs GG | 0.22 | 1.21 | 0.89–1.65 | 0.20 | 1.23 | 0.89–1.70 | ||||
| TT | 0.26 | 0.24 | |||||||||||
| rs1470579 | AA | 0.24 | 0.27 | 2.21 | 0.33 | AC Vs AA | 0.18 | 1.20 | 0.92–1.56 | 0.30 | 1.16 | 0.88–1.53 | |
| AC | 0.50 | 0.48 | CC Vs AA | 0.20 | 1.22 | 0.90–1.66 | 0.19 | 1.24 | 0.90–1.70 | ||||
| CC | 0.26 | 0.24 | |||||||||||
| SLC30A8 | rs13266634 | TT | 0.04 | 0.05 | 2.63 | 0.27 | TT Vs CT | 0.22 | 1.39 | 0.82–2.34 | 0.29 | 1.35 | 0.77–2.34 |
| TC | 0.38 | 0.34 | TT Vs CC | 0.51 | 1.19 | 0.71–1.97 | 0.55 | 1.18 | 0.67–2.03 | ||||
| CC | 0.58 | 0.61 | |||||||||||
Fig. 1.
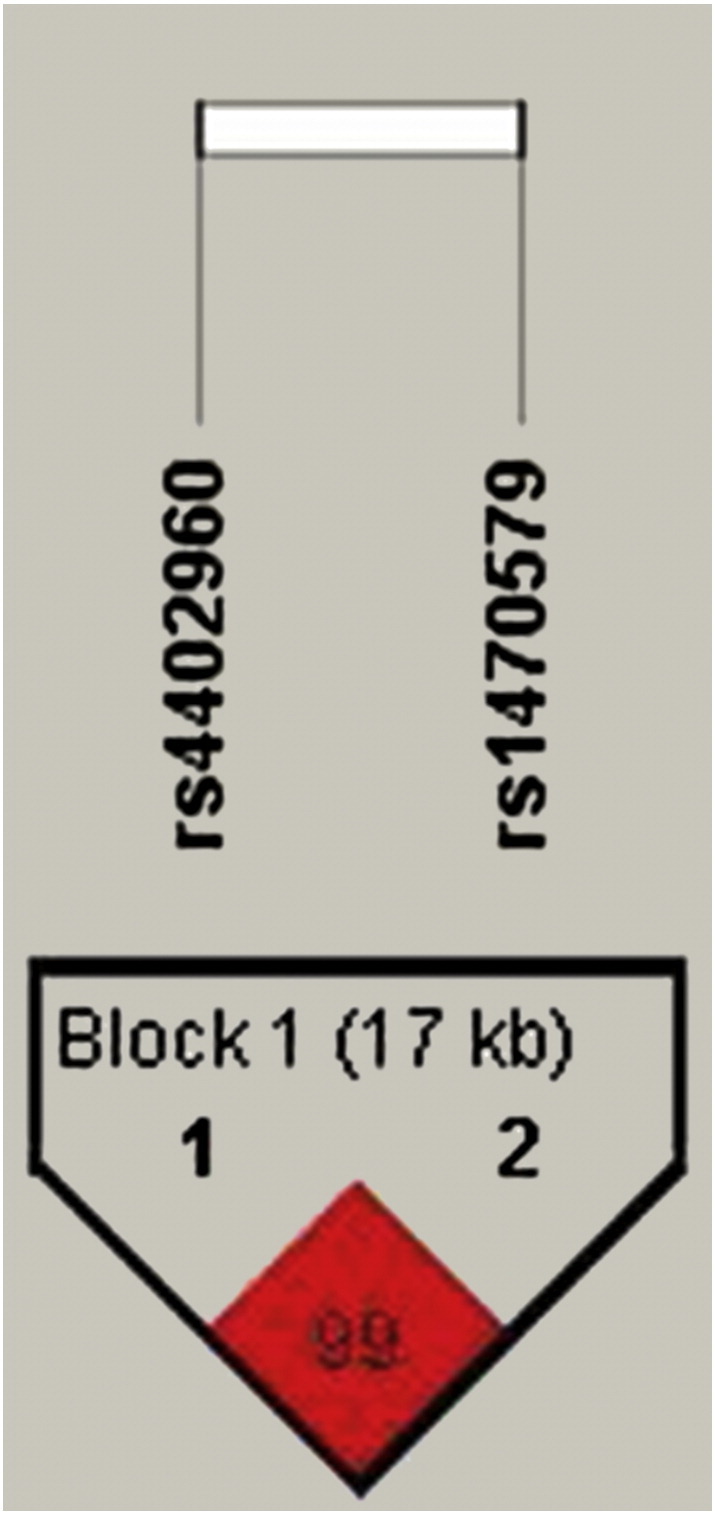
Linkage disequilibrium plot for IGF2BP2 SNPs (rs4402960, rs1470579).
3.3. Power of the study
Given non-significant nature of association of these two genes in our sample, it is necessary to estimate if our study has adequate power to detect the true association if present in the population. We estimated the power of our study by using the effect size (log of odds ratio) reported in a previous Indian study (Chauhan et al., 2010) that showed significant association of two of the 3 SNPs of the IGF2BP2 and SLC30A8 genes. Given the effect sizes of 0.079 (log of 1.20) and 0.127 (log of 1.34) for the two SNPs in the reference population, and with our study sample of 1379, we obtained the power of 83% and 99% at p = 0.05, for the two SNPs of IGF2BP2 and SLC30A8 genes, respectively. This shows that our sample size of 1379 was adequate and the study was sufficiently-powered to detect the true association of these genes with T2DM, if existent in this population. We also estimated the minimum effect size (log of OR) required for our study to detect true association (p = 0.05) with 90% power to be 0.087, for both the genes. However, the observed effect size was far smaller (0.04) than the estimated 0.087 in case of both the IGF2BP2 SNPs where it was close to zero (− 0.02) in case of the lone SNP studied for SLC30A8, suggesting lack of association of these SNPs with T2DM in this population.
3.4. Comparative analysis with previous Indian studies
Given the inconsistent nature of findings on the association of these genes with T2DM in the Indian populations, we tried to collate information from the previous three studies on Indian populations (Table 4) and realized that only two of the three studies, besides ours, presented allele frequency data for two of the three SNPs (rs4402960, rs13266634) that we studied. However, the test for homogeneity of allele frequencies across the three Indian populations suggests significant heterogeneity for each of the two SNPs (Table 4), possibly underlining the ethnic and genetic heterogeneity implicit among Indian populations. Given this, meta-analysis may not be appropriate albeit one of the two SNPs (rs4402960) shows significant association with T2DM in a north Indian population (Sanghera et al., 2008).
Table 4.
Distribution of allele frequency for the two SNPs of IGF2BP2(rs4402960) and SLC30A8 (rs13266634)genes among the three Indian populations.
| Ref | Sample size |
IGF2BP2 — rs4402960 |
SLC30A8 — rs13266634 |
|||||||
|---|---|---|---|---|---|---|---|---|---|---|
| Allele frequency cases |
Allele frequency controls |
Allele frequency cases |
Allele frequency controls |
|||||||
| Cases | Controls | Major | Minor | Major | Minor | Major | Minor | Major | Minor | |
| Current study | 758 | 621 | 0.49 | 0.51 | 0.51 | 0.49 | 0.78 | 0.22 | 0.77 | 0.23 |
| Sanghera et al. (2008) | 532 | 386 | 0.57 | 0.43 | 0.61 | 0.39 | 0.73 | 0.27 | 0.73 | 0.27 |
| Chauhan et al. (2010) | 2486 | 2678 | 0.48 | 0.42 | 0.44 | 0.56 | 0.80 | 0.20 | 0.77 | 0.23 |
| Chidambaram et al. (2010)a | 926 | 812 | – | – | – | – | – | – | – | – |
Test for homogeneity Χ2 (df); p value (pooled cases - IGF2BP2) 14.2 (2); p < 0.001 (pooled controls -IGF2BP2) 43.7 (2); p < 0.0001 (pooled cases -SLC30A8) 13.3 (2); p < 0.0014 (pooled controls -SLC30A8) 3.0 (2); p > 0.223.
Χ2 (df); p (cases + controls) (IGF2BP2) 52.2 (2); p < 0.0001 (SLC30A8) 13.4 (2); p < 0.0013.
Allelic frequencies were not presented in the paper.
4. Discussion
Despite large sample size and adequate statistical power of our study, we could not replicate the association of IGF2BP2 and SLC30A8 SNPs with T2DM in our sample from Hyderabad, India. However, our results are consistent with the other South Indian study from Chennai (Chidambaram et al., 2010) which also did not reveal significant association of these genes with T2DM, despite analyzing much larger set of samples than that of ours. There was also no consistent evidence of association of these genes among populations of London, Pakistan and Singapore with South Indian ancestry (Kooner et al., 2011). On the other hand, a north Indian study (Chauhan et al., 2010), which included by far the largest sample from India showed significant association of these two genes with T2DM, albeit within northern India, two independent samples displayed contrasting results (Chauhan et al., 2010; Sanghera et al., 2008). It may be pertinent to note that broadly speaking the southern Indian populations represent similar linguistic and ethnic backgrounds and possibly reflect similar genetic architecture as compared to the Northern Indian populations (Reich et al., 2009). This inconsistent pattern of genetic association with T2DM among different regional and/or ethnic populations of India and/or between Indian and western populations could be due to ethnic variation with implicit heterogeneity of the frequency of the susceptible genetic variants across regional/ethnic groups both within India (Table 4) and across the globe. The unique Indian population structure with enormous genetic heterogeneity implicit among the ethnic groups within India, particularly between the southern Indian and northern Indian populations (Reich et al., 2009) underlines the importance of studying different ethnic and geographic populations of India in order to draw a representative susceptible/protective genetic profile for India that may be associated with T2DM. Although couple of studies performed meta-analysis which revealed increased risk conferred by these genes towards developing T2DM among South and East Asian populations along with Europeans (Jia et al., 2011; Zhao et al., 2012; Cauchi et al., 2010; Jing et al., 2011), given the significant allelic heterogeneity among the three Indian populations for which data were available (Table 4) and considering the fact that each of the three Indian studies displayed adequate statistical power through post-hoc power analysis, meta-analysis would not be apt in the present context.
The IGF2BP2 gene, located on chromosome 3q27.2, spans about 181.3 kb with 16 exons. It belongs to a family of mRNA-binding proteins (IMP1, IMP2 and IMP3) which are highly expressed in the pancreatic islets and are essential for normal embryonic growth and development (Christiansen et al., 2009). It encodes a protein which binds to the 5′ UTR of the IGF2 (Insulin growth factor 2) m-RNA and thus regulates translation of the IGF2 gene. However, the precise role of intronic SNPs of this gene in the etiology of T2DM is still to be understood, notwithstanding their presumptive involvement in the alternative splicing and thereby in gene regulation. On the other hand, the SLC30A8 gene, which is located on chromosome 8q24.11, spans about 226.44 kb with 11 exons and belongs to zinc transporter family, which is specific to pancreas and highly expressed in the insulin secreting beta cells. This gene encodes for a Zn transporter protein (ZnT8), which facilitates accumulation of zinc from the cytoplasm into intracellular vesicles, where the insulin is stored (Chimienti et al., 2004). The rs13266634 polymorphism is a non-synonymous mutation located in the last exon of SLC30A8, causing an amino acid change – arginine (R) to tryptophan (W) – at position 325 (R325W). It is assumed that the variants in this gene may influence the Zn transporter, affecting insulin stability and insulin secretion. Most of the functional studies hitherto were based on the expression levels of IGF2BP2 and SLC30A8 in the pancreatic beta cells to establish the role of these genes in the etiology of T2DM, but the precise role of variants of these genes is still unclear. Therefore, further studies need to be focussed on the exact mechanisms by which these variants of IGF2BP2 and SLC30A8 influence the expression in the pancreatic beta cells, which may provide new insights into the molecular mechanisms that may have possible role in the etiology of T2DM.
Despite biological significance of these genes in the pathophysiology of T2DM, it may be pertinent to note that the three SNPs considered for this study are only index variants, initially found to be associated in European populations. These are not causal variants, but mainly surrogates linked to the functional variants and given the difference in LD across populations these SNPs may not tag the same causal variants in different populations, even if they share same causal variants. This would partly explain why certain populations fail to replicate the association pattern observed earlier among the European populations. It is also possible that these loci are not implicated in T2DM or that different causal variants are prevalent at the two loci in different populations. The evidence for differential genetic predisposition of Indian populations (as compared to the Caucasians) is already available with reference to different complex disorders such as recurrent miscarriages, PCOS, cardiomyopathies etc. (Aruna et al., 2011; Dasgupta et al., 2012; Dhandapany et al., 2009). Given the complexity of Indian population, the studies hitherto focussed on molecular genetic association with T2DM are too few to draw any representative picture for India. A number of populations from different regions and ethnicities need to be screened for different candidate genes, not only to validate already known variants but also to see if any new genetic variants that are unique to Indian populations can be found.
Conflict of interest
The authors declare that there are no conflicts of interest.
Acknowledgment
The authors thank Director, Indian Statistical Institute for the logistic support. We also thank all the subjects who participated in the study. The authors declare no conflict of interest.
Footnotes
This is an open-access article distributed under the terms of the Creative Commons Attribution-NonCommercial-No Derivative Works License, which permits non-commercial use, distribution, and reproduction in any medium, provided the original author and source are credited.
References
- American Diabetes Association (ADA) Diagnosis and classification of diabetes mellitus. Diabetes Care. 2010;33(Suppl. 1):S62–S69. doi: 10.2337/dc10-S062. [DOI] [PMC free article] [PubMed] [Google Scholar]
- Aruna M. Novel alleles of HLA-DQ and -DR loci show association with recurrent miscarriages among South Indian women. Hum. Reprod. 2011;26:765–774. doi: 10.1093/humrep/der024. [DOI] [PubMed] [Google Scholar]
- Cauchi S. Analysis of novel risk loci for type 2 diabetes in a general French population: the D.E.S.I.R. study. J. Mol. Med. (Berl.) 2008;86:341–348. doi: 10.1007/s00109-007-0295-x. [DOI] [PubMed] [Google Scholar]
- Cauchi S. Meta-analysis and functional effects of the SLC30A8 rs13266634 polymorphism on isolated human pancreatic islets. Mol. Genet. Metab. 2010;100:77–82. doi: 10.1016/j.ymgme.2010.01.001. [DOI] [PubMed] [Google Scholar]
- Cauchi S. European genetic variants associated with type 2 diabetes in North African Arabs. Diabetes Metab. 2012;38:316–323. doi: 10.1016/j.diabet.2012.02.003. [DOI] [PubMed] [Google Scholar]
- Chauhan G. Impact of common variants of PPARG, KCNJ11, TCF7L2, SLC30A8, HHEX, CDKN2A, IGF2BP2, and CDKAL1 on the risk of type 2 diabetes in 5,164 Indians. Diabetes. 2010;59:2068–2074. doi: 10.2337/db09-1386. [DOI] [PMC free article] [PubMed] [Google Scholar]
- Chidambaram M. Replication of recently described type 2 diabetes gene variants in a South Indian population. Metabolism. 2010;59:1760–1766. doi: 10.1016/j.metabol.2010.04.024. [DOI] [PubMed] [Google Scholar]
- Chimienti F. Identification and cloning of a cell-specific zinc transporter, ZnT-8, localized into insulin secretory granules. Diabetes. 2004;53:2330–2337. doi: 10.2337/diabetes.53.9.2330. [DOI] [PubMed] [Google Scholar]
- Christiansen J., Kolte A.M., Hansen TO IGF2 mRNA-binding protein 2: biological function and putative role in type 2 diabetes. J. Mol. Endocrinol. 2009;43:187–195. doi: 10.1677/JME-09-0016. [DOI] [PubMed] [Google Scholar]
- Dasgupta S. Does follistatin gene have any direct role in the manifestation of polycystic ovary syndrome in Indian women? J. Postgrad. Med. 2012;58:190–193. doi: 10.4103/0022-3859.101386. [DOI] [PubMed] [Google Scholar]
- Dhandapany P.S. A common MYBPC3 (cardiac myosin binding protein C) variant associated with cardiomyopathies in South Asia. Nat. Genet. 2009;41:187–191. doi: 10.1038/ng.309. [DOI] [PMC free article] [PubMed] [Google Scholar]
- Duesing K. Evaluation of the association of IGF2BP2 variants with type 2 diabetes in French Caucasians. Diabetes. 2008;57:1992–1996. doi: 10.2337/db07-1789. [DOI] [PMC free article] [PubMed] [Google Scholar]
- Furukawa Y. Polymorphisms in the IDE-KIF11-HHEX gene locus are reproducibly associated with type 2 diabetes in a Japanese population. J. Clin. Endocrinol. Metab. 2008;93:310–314. doi: 10.1210/jc.2007-1029. [DOI] [PubMed] [Google Scholar]
- Gabriel S. SNP genotyping using the Sequenom Massarray iPLEX Platform Curr. Protoc. Hum. Genet. 2009;60:2.12.1–2.12.18. doi: 10.1002/0471142905.hg0212s60. [DOI] [PubMed] [Google Scholar]
- Gamboa-Meléndez M.A. Contribution of common genetic variation to the risk of type 2 diabetes in the Mexican Mestizo, population. Diabetes. 2012;61:3314–3321. doi: 10.2337/db11-0550. [DOI] [PMC free article] [PubMed] [Google Scholar]
- Grarup N. Studies of association of variants near the HHEX, CDKN2A/B, and IGF2BP2 genes with type 2 diabetes and impaired insulin release in 10,705 Danish subjects: validation and extension of genome-wide association studies. Diabetes. 2007;56:3105–3111. doi: 10.2337/db07-0856. [DOI] [PubMed] [Google Scholar]
- Han X. Implication of genetic variants near SLC30A8, HHEX, CDKAL1, CDKN2A/B, IGF2BP2, FTO, TCF2, KCNQ1, and WFS1 in type 2 diabetes in a Chinese population. BMC Med. Genet. 2010;11:81. doi: 10.1186/1471-2350-11-81. (28) [DOI] [PMC free article] [PubMed] [Google Scholar]
- Herder C. Variants of the PPARG, IGF2BP2, CDKAL1, HHEX, and TCF7L2 genes confer risk of type 2 diabetes independently of BMI in the German KORA studies. Horm. Metab. Res. 2008;40:722–726. doi: 10.1055/s-2008-1078730. [DOI] [PubMed] [Google Scholar]
- Horikoshi M. Variations in the HHEX gene are associated with increased risk of type 2 diabetes in the Japanese population. Diabetologia. 2007;50:2461–2466. doi: 10.1007/s00125-007-0827-5. [DOI] [PubMed] [Google Scholar]
- Hu C. PPARG, KCNJ11, CDKAL1, CDKN2A-CDKN2B, IDE-KIF11-HHEX, IGF2BP2 and SLC30A8 are associated with type 2 diabetes in a Chinese population. PLoS One. 2009;4(10):e7643. doi: 10.1371/journal.pone.0007643. (28) [DOI] [PMC free article] [PubMed] [Google Scholar]
- Huang Q. Association analysis of SLC30A8 rs13266634 and rs16889462 polymorphisms with type 2 diabetes mellitus and repaglinide response in Chinese patients. Eur. J. Clin. Pharmacol. 2010;66:1207–1215. doi: 10.1007/s00228-010-0882-6. [DOI] [PubMed] [Google Scholar]
- Jia H. Association between IGF2BP2 rs4402960 polymorphism and risk of type 2 diabetes mellitus: a meta-analysis. Arch. Med. Res. 2011;42:361–367. doi: 10.1016/j.arcmed.2011.08.001. [DOI] [PubMed] [Google Scholar]
- Jing Y.L. SLC30A8 polymorphism and type 2 diabetes risk: evidence from 27 study groups. Nutr. Metab. Cardiovasc. Dis. 2011;21:398–405. doi: 10.1016/j.numecd.2009.11.004. [DOI] [PubMed] [Google Scholar]
- Kooner J.S. Genome-wide association study in individuals of South Asian ancestry identifies six new type 2 diabetes susceptibility loci. Nat. Genet. 2011;43:984–989. doi: 10.1038/ng.921. [DOI] [PMC free article] [PubMed] [Google Scholar]
- Mohan V. Epidemiology of type 2 diabetes: Indian scenario. Indian J. Med. Res. 2007;125:217–230. [PubMed] [Google Scholar]
- Nemr R. Strong association of common variants in the IGF2BP2 gene with type 2 diabetes in Lebanese Arabs. Diabetes Res. Clin. Pract. 2012;96:225–229. doi: 10.1016/j.diabres.2011.12.026. [DOI] [PubMed] [Google Scholar]
- Parra E.J. Genome-wide association study of type 2 diabetes in a sample from Mexico City and a meta-analysis of a Mexican-American sample from Starr County, Texas. Diabetologia. 2011;54:2038–2046. doi: 10.1007/s00125-011-2172-y. [DOI] [PMC free article] [PubMed] [Google Scholar]
- Pascoe L. Common variants of the novel type 2 diabetes genes CDKAL1 and HHEX/IDE are associated with decreased pancreatic beta-cell function. Diabetes. 2007;56:3101–3104. doi: 10.2337/db07-0634. [DOI] [PubMed] [Google Scholar]
- Perry J.R. Stratifying type 2 diabetes cases by BMI identifies genetic risk variants in LAMA1 and enrichment for risk variants in lean compared to obese cases. PLoS Genet. 2012;8:e1002741. doi: 10.1371/journal.pgen.1002741. [DOI] [PMC free article] [PubMed] [Google Scholar]
- Potapov V.A. Polymorphic markers TCF7L2 rs12255372 and SLC30A8 rs13266634 confer susceptibility to type 2 diabetes in a Russian, population. Genetika. 2010;46:1123–1131. [PubMed] [Google Scholar]
- Reich D. Reconstructing Indian population, history. Nature. 2009;461:489–494. doi: 10.1038/nature08365. [DOI] [PMC free article] [PubMed] [Google Scholar]
- Sambrook J. Cold Spring Harbor Laboratory Press; New York: 1989. Molecular Cloning: a Laboratory Manual. [Google Scholar]
- Sanghera D.K. Impact of nine common type 2 diabetes risk polymorphisms in Asian Indian Sikhs: PPARG2 (Pro12Ala), IGF2BP2, TCF7L2 and FTO variants confer a significant risk. BMC Med. Genet. 2008;9:59. doi: 10.1186/1471-2350-9-59. [DOI] [PMC free article] [PubMed] [Google Scholar]
- Scott L.J., Mohlke K.L., Bonnycastle L.L. A genome-wide association study of type 2 diabetes in Finns detects multiple susceptibility variants. Science. 2007;316:1341–1345. doi: 10.1126/science.1142382. [DOI] [PMC free article] [PubMed] [Google Scholar]
- Sladek R. A genome-wide association study identifies novel risk loci for type 2 diabetes. Nature. 2007;445:881–885. doi: 10.1038/nature05616. [DOI] [PubMed] [Google Scholar]
- Steinthorsdottir V. A variant in CDKAL1 influences insulin response and risk of type 2 diabetes. Nat. Genet. 2007;39:770–775. doi: 10.1038/ng2043. [DOI] [PubMed] [Google Scholar]
- Tabara Y. Replication study of candidate genes associated with type 2 diabetes based on genome-wide, screening. Diabetes. 2009;58:493–498. doi: 10.2337/db07-1785. [DOI] [PMC free article] [PubMed] [Google Scholar]
- Takeuchi F., Serizawa M., Yamamoto K. Confirmation of multiple risk loci and genetic impacts by a genome-wide association study of type 2 diabetes in the Japanese, population. Diabetes. 2009;58:1690–1699. doi: 10.2337/db08-1494. [DOI] [PMC free article] [PubMed] [Google Scholar]
- Timpson N.J. Adiposity-related heterogeneity in patterns of type 2 diabetes susceptibility observed in genome-wide association data. Diabetes. 2009;58:505–510. doi: 10.2337/db08-0906. [DOI] [PMC free article] [PubMed] [Google Scholar]
- Voight B.F. Twelve type 2 diabetes susceptibility loci identified through large-scale association analysis. Nat. Genet. 2010;42:579–589. doi: 10.1038/ng.609. [DOI] [PMC free article] [PubMed] [Google Scholar]
- Wu Y. Common variants in CDKAL1, CDKN2A/B, IGF2BP2, SLC30A8, and HHEX/IDE genes are associated with type 2 diabetes and impaired fasting glucose in a Chinese Han, population. Diabetes. 2008;57:2834–2842. doi: 10.2337/db08-0047. [DOI] [PMC free article] [PubMed] [Google Scholar]
- Xiang J. Zinc transporter-8 gene (SLC30A8) is associated with type 2 diabetes in Chinese. J. Clin. Endocrinol. Metab. 2008;93:4107–4112. doi: 10.1210/jc.2008-0161. [DOI] [PubMed] [Google Scholar]
- Zeggini E. Replication of genome-wide association signals in UK samples reveals risk loci for type 2 diabetes. Science. 2007;316:1336–1341. doi: 10.1126/science.1142364. [DOI] [PMC free article] [PubMed] [Google Scholar]
- Zhao Y. IGF2BP2 genetic variation and type 2 diabetes: a global meta-analysis. DNA Cell Biol. 2012;31:713–720. doi: 10.1089/dna.2011.1400. [DOI] [PubMed] [Google Scholar]