

Abstract
The high degree of polymorphism at HLA class I and class II loci makes high resolution HLA typing challenging. Current typing methods, including Sanger sequencing, yield ambiguous typing results due to incomplete genomic coverage and inability to set phase for HLA haplotype determination. The 454 Life Sciences GS FLX next generation sequencing system coupled with Conexio ATF software can provide very high resolution HLA genotyping. High throughput genotyping can be achieved by use of primers with multiplex identifier (MID) tags to allow pooling of the amplicons generated from different individuals prior to sequencing. We have conducted a double blind study in which eight laboratory sites performed amplicon sequencing using GS FLX standard chemistry and genotyped the same 20 samples for HLA-A, -B, -C, DPB1, DQA1, DQB1, DRB1, and DRB3, DRB4 and DRB5 (DRB3/4/5) in a single sequencing run. The average sequence read length was 250 base pairs (bp) and the average number of sequence reads per amplicon was 672, providing confidence in the allele assignments. Of the 1280 genotypes considered, assignment was possible in 95% of the cases. Failure to assign genotypes was the result of researcher procedural error or the presence of a novel allele rather than a failure of sequencing technology. Concordance with known genotypes, in cases where assignment was possible, ranged from 95.3% to 99.4% for the eight sites, with overall concordance of 97.2%. We conclude that clonal pyrosequencing using the GS FLX platform and Conexio ATF software allows reliable identification of HLA genotypes at high resolution.
Keywords: DNA Sequencing, GS FLX, HLA genotyping
Introduction
Allele-level HLA typing is critical for hemapoetic stem cell transplantation (1–10) and important for research applications, such as disease association (reviewed in 11) and population genetics studies (12). High resolution HLA typing is challenging because the HLA class I and class II loci are the most polymorphic genes in the human genome, with, for example, 1605 alleles at the HLA-B locus (as of April 2010). The very large number of alleles and the patchwork patterns of polymorphisms clustered within a few exons makes “setting the phase” of linked polymorphisms difficult and results in “ambiguous” typing results, i.e. data (probe reactivity patterns or Sanger sequencing electropherograms) that are consistent with many different possible genotype assignments. Resolving these ambiguities with current techniques can be cumbersome, time consuming, and expensive. One approach to reducing genotype ambiguity and achieving high resolution HLA typing is to use the massively parallel clonal sequencing strategies of next generation sequencing systems.
Recently, we reported the use of the 454 Life Sciences GS FLX pyrosequencing system to sequence exons amplified from class I and class II genes to achieve high resolution HLA typing (13, 14). Bentley et al (13) showed that, in a 2 or 4 region PicoTiter™Plate (PTP), 24 and 48 individual samples, respectively, can be analyzed in a single GS FLX run. For the current study, we adopted this strategy of amplicon sequencing and used MID tagged primer pairs for each targeted exon. For an individual sample, 14 different primer pairs were used to amplify exons 2, 3, and 4 for class I, exon 2 for DPB1, DQA1, and the DRB loci (DRB1, DRB3/4/5) and exons 2 and 3 for DQB1.
As with other PCR-based HLA typing systems, the challenge was to design primers that were specific for a given gene and amplified all alleles of that gene with near equal efficiency. Although HLA locus-specific primers are generally desirable, the clonal sequencing property of 454 GS FLX sequencing in conjunction with the Conexio software allows the use of generic primer pairs, such as the DRB primers used in this study which co-amplify exon 2 of the DRB1and DRB3/4/5, to determine genotypes at a number of loci. In addition, the clonal sequencing allows the separation of sequences from the target gene away from co-amplified genomic sequences such as pseudo-genes, related genes, etc., that would contribute “noise” or “background” during conventional Sanger sequencing. We have chosen this strategy of sequencing exons amplified with 454 fusion primers because the genomic PCR creates the library for sequencing without any subsequent manipulation. An alternative strategy involves PCR amplifying the whole HLA gene, followed by fragmentation and ligation of adaptor sequences (15).
The Conexio Genomics ATF software has been designed to sort individual sequence reads according to the genomic primer sequence and MID tag (corresponding to an individual sample), to compare the sequences to the IMGT/HLA sequence data base (16), and then to assign genotypes for each locus and each sample. The number of reverse and forward reads for each allele of each amplicon are indicated. A genotype is assigned by the software and included in the genotyping report when the aligned sequences are perfectly matched with the alleles listed in the HLA sequence database. In a small minority of cases, the aligned sequences show a mismatch of one or more bases with the database. Then, manual editing (see below) is necessary to obtain a genotype assignment. In most cases, the mismatch with the database reflects the presence of a relatively rare sequence that is derived from co-amplified pseudo-genes or related genes, or that arises from a misincorporation error during the genomic PCR or a pyrosequencing error. This rare sequence is present with more frequent sequences that contain no mismatch. In these cases, the rare sequence is easily recognized and the manual editing involves deactivating that specific sequence. Alternatively, if the mismatch occurs in the last few bases of a sequence, these bases can be trimmed from a specific sequence, as the base calls at the end of a read are more error prone (17). These manual editing steps will then result in a genotype assignment with no mismatches with the database, based on the remaining frequent sequences. The presence of a novel allele (a sequence not found in the database) would be reflected as a frequent sequence that is mismatched at a particular position with the database.
To evaluate the basic HLA sequencing system described in Bentley et al (13) for robustness, we performed a double blind multi-site study in which eight laboratory sites used the same reagents, protocols and Conexio ATF software to sequence and assign genotypes for the same set of 20 DNA samples. A detailed description of the protocol is discussed in Methods.
Materials and methods
Study design
Eight laboratory sites with varying levels of experience in sequencing on the 454 Life Sciences GS FLX platform performed amplicon sequencing using GS FLX standard chemistry and genotyped the same 20 samples for HLA-A, -B, -C, DPB1, DQA1, DQB1, DRB1, and DRB3/4/5 using the Conexio ATF software. Fourteen primer pairs (exons 2, 3, and 4 for class I, exon 2 for DPB1, DQA1, and the DRB loci and exons 2 and 3 for DQB1) with 11 MID tags were used. All operations from PCR amplification through generation of the final genotyping report were performed at the individual study sites.
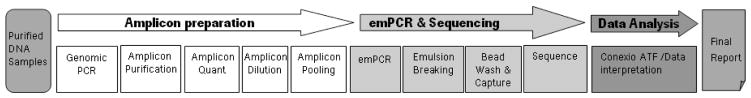
Workflow, consisting of genomic PCR, amplicon cleanup, quantification, quality check, dilution and pooling followed by emulsion PCR (emPCR), sequencing and data analysis by Conexio ATF, the only software necessary, was streamlined and manageable within 5 working days. With experience, total hands-on time for 20 samples and 2 negative controls was approximately 22 hours. The workflow is illustrated schematically in Figure 1.
Figure 1.
Samples
Six study sites (Children’s Hospital and Research Center Oakland, Children’s Hospital Philadelphia, DKMS Life Sciences, Institute of Immunology and Genetics, Kaiserslautern, Red Cross Transfusion Service of Upper Austria, and Stanford University) each submitted four DNAs, accompanied by the genotypes previously determined by the individual sites, to 454 Life Sciences. Submitted genotypes were determined by a combination of Sanger sequencing (AlleleSEQR SBT kits, Atria Genetics, South San Francisco, CA), group specific amplification (S3 and S4 kits, Protrans, Hockenheim, Germany), and/or laboratory designed primers (E. Trachtenberg), sequence-specific primers (Olerup, West Chester, PA; Invitrogen Corporation, Carlsbad, CA), heterozygous ambiguity resolution primers (HLA Ambiguity Resolution SBT Packs, Atria Genetics) and laboratory designed PCR mixes to create hemizygous products (D. Tyan). Sanger sequencing was performed using the ABI Prism 3100 Genetic Analyzer (Applied Biosystems, Foster City, CA) and Conexio Genomics Assign software (v3.5) for genotyping. Submission of samples which presented challenges to the previously employed sequencing methods was encouraged. Samples were sequenced by 454 Life Sciences as a quality control measure using the 454 GS FLX. All samples were amplifiable and yielded DNA sequence.. Three samples from each site were chosen for inclusion in the study. RMS submitted purified DNA from four cell lines (obtained courtesy of John Hansen, Fred Hutchinson Cancer Research Center as part of the International Histocompatibility Working Group) that had been previously genotyped on the GS FLX system to serve as positive controls. Two of these were chosen for the study by 454 Life Sciences. Aliquots of all 20 selected samples were de-identified, and sent to 7 of the sites for genotyping with the GS FLX system and Conexio ATF software. Genotyping at 454 Life Sciences, which served as the eighth site, was performed in a laboratory blinded to the submitted genotypes. DNAs were shipped on dry ice.
DNA Purification
Cell line DNAs were extracted using the Gentra® Puregene® kit (QIAGEN, Valencia, CA). Six sites submitted anonymized DNA samples extracted from whole blood by use of various extraction methods: QIAGEN MagAttract® DNA Blood Mini Kit; QIAmp® DNA Blood Mini Kit; Roche MagNA Pure® Compact (Roche Diagnostics, Mannheim, Germany) and MagNA Pure® Compact Nucleic Acid Isolation Kit I LV; QIAGEN BioRobot EZ1 workstation and QIAGEN EZ1 DNA Blood 350 μl Kit. No differences were observed in the ability to amplify and sequence samples extracted by these methods.
Primer design
The 454 HLA fusion primers with adapter sequences, library key tags, MIDs and locus specific sequences were designed with an overall structure as described in Bentley et al (13) with the exception that 4 or 5 base custom designed MIDs were used. Primers were designed to maximize allelic coverage while maintaining specificity for a given locus (Note that specificity was less of a consideration for DRB primers in order to allow sequencing of DRB3/4/5 as well as DRB1). Considering the class I loci, for exon 2 of HLA-B, the 3′ primer extends approximately 25 bases into the exon. For exon 3 of HLA-B and HLA-C, the 5′ primers extend approximately 10 bases into the exon. For class II loci, the 5′ primers for DQB1 exons 2 and 3 extend approximately 20 bases into the exon as do the 3′ primers for DQB1 exon 2 and DRB exon 2. The 5′ primer for exon 2 of the DRB loci extends about 5 bases into the exon. Complete sequence coverage is obtained for the other eight amplicons.
PCR conditions
PCR amplifications for each of the 14 amplicons were carried out in individual 25 μl reactions with 10 ng of DNA template and 10 pmoles each of forward/reverse fusion primers. Primers (Roche Applied Science) were provided dried down in 96 well microtiter plates (see Supplementary Figure S1 for primer plate layouts). Ten samples and one negative control (10 mM Tris-HCl buffer, 0.1 mM EDTA, pH 8.0 (TE) or molecular biology grade water) were amplified per plate. Master mix for PCR reactions, which consisted of 10 mM Tris-HCl buffer, pH 8.3, 50 mM KCl, 1.5 mM MgCl, 300 μM dNTPs (75 μM each of dA, dC, dG and dU), glycerol 10% w/v, AmpliTaq Gold (2 units), was prepared at each site from provided stock solutions. Master mix was added to DNA and plates were sealed with a fresh seal (Microseal® ‘B’ Adhesive Seals, Bio-Rad, Hercules, CA now recommended). Thermal cycling conditions were: 95°C-10′; 35 cycles of 95°C-15″, 62°C-45″, 72°C-15″; 35 cycles; 72°C-5′. Thermal cyclers employed at various sites were: ABI GeneAmp® PCR System 9700 (Life Technologies, Carlsbad, CA); and DNA Engine Tetrad (Bio-Rad). All reagents for genomic PCR except molecular biology grade water and TE were provided by Roche Applied Science..
Amplicon Cleanup, Quantification, Dilution and Pooling
Short non-specific and primer-dimer artifact products were removed from the amplicons using the Agencourt AMPure system (Agencourt Bioscience Corp., Beverly, MA). Aliquots of purified amplicons were further evaluated by electrophoresis on a 96 well E-Gel® (Invitrogen Corp.), or an agarose gel. In no case were primer-dimers observed after the AMPure step.
The purified amplicons were then quantified by Quant-iT™ PicoGreen® assay (Invitrogen Corp.) on a microplate spectrofluorimeter. Eight standards spanned DNA concentrations from 0 ng/μl to 50 ng/μl. To increase the precision of quantification at low DNA concentrations, thus allowing equimolar pooling, a biphasic curve was drawn with one linear regression performed using points from 0 to 6 ng/μl and a second one performed for points above 6 ng/μl. Any amplicons that could not be detected by PicoGreen® were assigned a concentration of 0.1 ng/μl (in order to allow a dilution calculation to be made) and carried through all subsequent steps. Amplicons were diluted to 2 × 10⁵ molecules/μl. Two pools, the first containing 5 μl of each amplicon from samples 1–10 and the second from samples 11–20 each with the corresponding negative control, were made.
Emulsion PCR, Bead Recovery and Pyrosequencing
Emulsion PCR, bead recovery, and pyrosequencing on a two region PTP were carried out as described in the GS FLX method manuals (Roche Applied Science GS FLX emPCR Method Manual USM-00033.A-December 2007, Roche Applied Science GS FLX Sequencing Method Manual USM-00035.A-December 2007) using reagent kits provided (454 Life Sciences, Branford, CT). Briefly, emulsions containing 600,000 beads and 600,000 amplicon molecules (from pools described above) were made on a QIAGEN Tissue Lyser. Emulsions were dispensed into 96 well plates and PCR was performed. Thermal cycling conditions were: 95°C-4′; 40 cycles of 94°C-30″, 58°C-60″, 68°C-90″; 13 cycles of 94°C-30″, 58°C-6′, 10°C hold. Emulsions were broken by the addition of isopropanol and emulsion oil was removed by successively washing the the beads in syringes with isopropanol, Bead Wash Buffer and Enhancing Fluid. Beads containing amplified DNA were then recovered by capture on magnetic Enrichment Beads and use of a Magnetic Particle Collector. Sequencing primer was annealed and the beads were counted using a Z1 Coulter® (Beckman Coulter, Brea, CA). 300,000 beads for each direction (forward and reverse) were loaded onto each region of a PTP. If fewer beads for a given direction were obtained, all of them were loaded.
Genotyping with Conexio Genomics ATF Software
Conexio Genomics ATF software (v 1.1.0.20.2) was installed on a Microsoft Windows® based computer. The ATF software sorts the sequence reads to individual samples based on the MID tag, to the specific HLA locus by genomic primer sequence, and compares the sequences to allele sequences in the database. The numbers of consolidated and aligned sequence reads in the forward and reverse directions are displayed in the Master Layer (see Results section for more details). Sequence reads that are rare and are mismatched with the database are displayed by the ATF software in the Failed Layer. The FASTA (.fna) files generated by the 8 sites were loaded into Conexio ATF software and a Genotyping Report for the 20 samples was generated. Any manual editing performed was documented. Researchers verified the acceptance of each genotype and the reason for rejection of any genotype was documented.
Data Analysis
Genotyping reports as well as all supporting primary data (gels, DNA quantification and .fna files) were submitted to 454 Life Sciences. The data were de-identified and sent to RMS for compilation and preliminary analysis prior to any information regarding sample genotypes being made available to RMS. Following preliminary analysis, all data were made available to participants. Concurrently, the genotypes submitted by the participants were made available to all sites and to RMS for further data analysis. Individuals at RMS who were involved in the performance of the study run had no involvement in compilation or final analysis of the data.
Sequencing of Study Samples with GS FLX Titanium Chemistry
Coincident with the completion of the study, 454 Life Sciences released the GS FLX Titanium chemistry for amplicon sequencing, which had been designed to be backward compatible with primers designed for GS FLX standard chemistry. To determine how well the system used in the study would perform using the Titanium chemistry and to see if the longer reads provided by GS FLX Titanium would reduce the need for manual editing in the GS FLX standard chemistry system, one Titanium run on this set of samples was performed at 454 Life Sciences. Sequencing was as described above except that amplicons were diluted to 4 × 10⁶ molecules/μl, each emulsion (performed in Titanium large volume format with 1 emulsion for A beads and 1 emulsion for B beads per region) contained 1 copy of amplicon per bead and 3.5 × 10⁷ beads. 1.8 × 10⁶ beads were loaded onto each region of the PTP. Because GS FLX Titanium chemistry generates a greater amount of data, data was first sorted by sample using a script written by Conexio Genomics. These derived .fna files were transferred to RMS for genotyping.
Results
Although many of the participating labs had little to no experience with the 454 GS FLX system and with the Conexio ATF software, the concordance of genotyping assignments for the 20 samples was very high for both HLA class I and class II alleles. How the Conexio ATF software displays the consolidated, sorted and aligned sequence reads and assigns genotypes is described below.
Conexio Genotyping Software
The Conexio ATF software lists the most abundant sequences generated by the 454 pyrosequencing reaction and assigns HLA genotypes by comparing the consensus sequence reads to the IMGT/HLA sequence database (16). Figure 2A shows a screen interface for this software for the HLA-B locus of sample 11 (this is the first sample of region 2 on the PTP and shows as Sample 1 in this version of the Conexio software). In this figure, the numbers of forward and reverse sequence reads for exons 2 (316, 325), 3 (587, 513), and 4 (603, 533) of HLA-B are shown aligned with the reference sequence. As expected, the ratio of forward to reverse reads for each exon is close to 1 (0.97, 1.14, 1.14) and the total of forward and reverse reads for each exon is within a factor of 2 compared to the total for each of the other exons (641, 1100, 1136). The genotype assignment, the pair(s) of alleles in the database that show no mismatch with the consensus sequence reads, is shown to the right. For this sample, the genotype assignment is B*4201/B*4201 (homozygous) and is unique (i.e. no ambiguity string). Genotypes that show one or more mismatch are shown below the assigned genotype. Some class I alleles do not have sequences for exon 4 in the database; these alleles, such as B*4202 in the line below the zero mismatch assignment for B*4201/B*4201, are displayed by the software with a tan color representing the exon lacking database sequence.
Figure 2.

HLA genotype ambiguities result from incomplete genomic sequence coverage and/or the inability to set phase of linked polymorphisms. Figure 2B shows the HLA-B sequence reads for sample 12 from one study site. For this sample, a limited (n = 6 possible genotypes) ambiguity string, i.e. the set of genotypes that all show zero mismatches in the columns labeled MM0, MM2, and MM3, is seen. The top (and, based on frequency, the most likely) genotype is B*070201/B*080101. The next three possible genotypes listed below differ from B*070201/B*080101 by a polymorphism at the end of exon 2 not covered by the primer pair used in this study (see Methods). The fourth genotype listed below the top genotype assignment contains the allele B*0761, which differs from B*070201 by a polymorphism in exon 5 (newly designed primer pairs for the Titanium system amplify exons 1–5,, unpublished data). The seventh and eighth genotypes listed are B*070501/B*0807 and B*0706/B*0807. In the absence of any phase information, these two genotypes would also be consistent with the GS FLX sequence information (zero mismatches in the column MM0, which considers the unphased heterozygous sequence information). However, when the sequence information for exon 3 is phased (column MM3), a single mismatch is detected and, consequently, these two genotypes are excluded and removed from the ambiguity string.
In some cases, the presence of rare sequence reads derived from a related gene or reads containing artifacts (PCR misincorporations or pyrosequencing errors) can prevent the software from automatically assigning a genotype with zero mismatches (Figure 3A). The presence of the rare reverse sequence read (labeled 1.20, highlighted in red, with 10 copies) for exon 4 results in the software assigning B*1302/B*4102 as the “top” genotype, along with an additional three genotypes, all of which have one mismatch (MM0 column). For this sample, the 10 reverse sequence reads (1.20) for exon 4 are aligned with the reference as well as 702 copies of the reverse sequence read (labeled 1.5). If the rare (10 copies) sequence 1.20 is deactivated (“manual editing”), then the software assigns a unique (no ambiguity) genotype with zero mismatches (B*1302/B*4102; Figure 3B).
Figure 3.

Concordance
Figure S2 lists the 20 DNA samples, the submitted known genotypes, and the consensus genotypes that were assigned by each of the participating labs for the 8 HLA class I and class II loci. Of the 1280 genotypes (20 samples × 8 loci × 8 labs) considered, genotype assignments with zero mismatches with the HLA sequence database were possible in 95% of the cases. Failure to assign known genotypes was the result of technical procedural error (see below), a bias against B2 reverse reads experienced at 1 site, or the presence of a novel allele in three cases. The nature of the conditions preventing a genotype assignment and details pertaining to the frequency of occurrence of these conditions are listed in Supplementary Table S1. The number of sites that performed manual editing to reach the genotype assignment (zero mismatch) for each sample is shown in Figure S2. Overall manual editing was performed for 3.7% of the loci.
In some cases, a unique genotype (pair of alleles) could be assigned while in others, the Conexio genotyping software produced a limited “ambiguity string”, a list of several possible genotypes with no mismatches with the sequence data base. If the different sites obtained limited ambiguity strings that contained the correct (consensus and submitted) genotype for a given locus and sample, this result was termed a “concordance”. If the different sites obtained an identical ambiguity string, this result was termed an “agreement”. In all except two cases, the genotype for which there was agreement was the concordant genotype. In these two cases, sample 6 HLA-A and sample 16 HLA-C, the Conexio ATF software called the incorrect genotype. This is due, in the first case, to the presence of a sequence that sorts with HLA-A exon 4 in the reverse direction and is presumably from a previously unknown pseudogene or minor species for which there were slightly more sequence reads than for the true HLA-A exon 4 sequence. Following this study, the Conexio ATF software was modified to bin this sequence away from A-4. The correct allele (A*7401 rather than *7402) and the correct genotype are obtained with this version of the software. (The current Titanium primer pair for HLA-A amplifies exons 4 and 5 together and provides greater locus specificity.) In the second case, the inability to call the genotype Cw*0303/*0304 vs. Cw*0303/*0303 results from the fact that the only difference between these alleles is in the first base following the reverse primer for exon 2. The software had been designed to give less “weight” to bases occurring very early in the sequence, thus it “ignored” this base. This issue will be addressed in the next Conexio ATF release. It should be noted that the inability to call Cw*0304 correctly occurs when this allele is in combination with Cw*0303, as Cw*0304 is called correctly in sample 1 in combination with Cw*1203.
Table 1 lists the concordance with known genotypes for each of the eight sites. Concordance with known genotypes for the 8 sites, in cases where assignment was possible, ranged from 95.3% to 99.4% with overall concordance of 97.2%. Overall concordance with known alleles was 98.3%. Many of these sites did not have prior experience with this system of HLA sequencing and so, in many instances, failure to obtain a concordant result was due to a lack of recognition of the appropriate manual edit to perform. Not unexpectedly, the site with the most experience had the highest concordance (99.4% by genotype, 99.7% by allele). Table 2 shows the overall agreement and concordance by locus. Concordance was highest for the class II loci (99–100% by allele) and lowest for HLA-A (94% by allele). The number of samples containing unambiguous genotypes at the 4-digit level is shown in Table 3. Unambiguous genotypes were obtained for 20–85% of the samples, dependent upon the locus.
Table 1.
Percent concordance with known genotypes for each site
| Site | Genotype | Allele |
|---|---|---|
| A | 99.4 | 99.7 |
| B | 95.6 | 96.8 |
| C | 96.2 | 97.7 |
| D | 97.4 | 98.7 |
| E | 96.2 | 97.7 |
| F | 97.3 | 98.3 |
| G | 97.3 | 98.6 |
| H | 98.1 | 99.0 |
| Overall | 97.2 | 98.3 |
Table 2.
Agreement and concordance by locus
| Locus | % Agreement | % Concordance with known variants | |
|---|---|---|---|
| Genotype | Allele | ||
| HLA-A | 89 | 91 | 94 |
| HLA-B | 93 | 96 | 98 |
| HLA-C | 94 | 94 | 97 |
| DPB1 | 99 | 100 | 100 |
| DQA1 | 100 | 100 | 100 |
| DQB1 | 99 | 100 | 100 |
| DRB1 | 97 | 98 | 99 |
| DRB3/4/5 | 97 | 98 | 99 |
| Overall | 96 | 97 | 98 |
Table 3.
Ambiguities in study set
| Locus | No. of samples with unambiguous genotype assignment | Ambiguities (Indistinguishable alleles at 4 digit level) |
|---|---|---|
| HLA-A | 8 (42%) | 26 |
| HLA-B | 4 (21%) | 31 |
| HLA-C | 4 (20%) | 22 |
| DPB1 | 12 (60%) | 3 |
| DQA1 | 6 (30%) | 16 |
| DQB1 | 14 (74%) | 4 |
| DRB1 | 17 (85%) | 4 |
| DRB3/4/5 | 8 (40%) | 6 |
Technical issues
The workflow of genomic PCR amplification of multiple loci for multiple samples, amplicon handling, emPCR, and bead recovery prior to loading the PTP is, in the manual protocol for this study, relatively complex. In all cases, except at the one site where there was one known plate seal failure during the PCR, and at the one site where there was a failure to properly anneal the forward sequencing primer, there were no amplicon dropouts as defined by absence of a band on a gel, a PicoGreen® value of less than 0.1 ng/μl as well as 0 sequence reads for a given exon. Notably, across the 8 sites, there were 31 amplicons which were apparent dropouts, as measured by gel electrophoresis and PicoGreen® assay, but for which sufficient sequence reads were obtained to allow accurate genotyping, illustrating the robustness of the system.
Bead loads for a given direction (target 300,000) varied from 60,000 to 300,000. It is noteworthy that accurate genotyping was obtained even in cases where bead loads were low. In fact, Site A, with one of the lowest bead loads (77,000), was able to achieve the highest genotyping accuracy at 99.4%. However, more manual editing, and therefore greater expertise in HLA genotyping with the Conexio ATF software, was required (data not shown).
Detection of New Alleles
Three of the samples in the study contained novel alleles, i.e., sequences not contained in the HLA sequence database (see Table S2). Notably, all three novel alleles were detected by all sites in the study. For example, according to the genotyping information submitted to the study, one sample had an HLA-A allele that contained a 5 bp insertion, rendering the A*02 allele a null. Figure 4 shows the Conexio ATF analysis for this locus. Abundant sequence reads in both directions were observed for all three exons but the genotype assignment software indicates one mismatch with the genotype A*02010101/A*03010101. The software displays a “+” to indicate that there is an insertion present in the exon 2 sequence of A*0201; (The “+” sign in the screenshot indicates only the presence of an insertion but does not give information regarding its composition or length. Although precise information regarding the nature of the deletion was retained in the Conexio ATF program, it was not readily accessible via the user interface. The current version of the ATF software makes this information available to the user..
Figure 4.

Limitations and Residual Ambiguity with Current System
The standard GS FLX chemistry and reagents used in this eight site study provide sequence reads of around 250 bp in length. Since most of the amplicons were > 300 bp long, complete coverage of the exons in both forward and reverse direction was not obtained. However, since large number of sequence reads in each direction were recovered, the confidence in the base calling is very high and the genotype assignments, as evidenced by the high concordance and agreement among labs, are reliable.
Determining the precise number of bases in homopolymer runs can present a challenge for pyrosequencing. In this study with the GS FLX system, homopolymer runs in the last 20 bases of a sequence appeared to be more problematic. Although the sequence consolidation strategy of the Conexio ATF software generally corrects for variation in the number of bases in homopolymer runs among sequence reads, occasional differences in the number of bases were observed between sites. However, this well known property of pyrosequencing (17) was generally recognized by participants and corrected by manual editing. Another property of this 454 GS FLX system is that the reliability of base calling, in general, is somewhat lower at the ends of reads. An example of this is shown in Figure 5A sample 3, HLA-B. At the very end of the sequence, the base call was a G instead of the correct call of C for some sites. This error is presumably due to the fact that the C is followed by 3 Gs as seen in the reference sequence. Since the sequencing is less robust toward the end of the read, the fluorescence signal for C presumably did not meet the threshold for a call whereas, since there were 3 Gs present, the threshold was met. The correct genotype call was obtained by setting the sequence end for the reverse reads at position 694 immediately prior to the basecall of C.
Figure 5.

Although a unique genotype is assigned for many samples at many loci, the genotype assignments for some loci contain limited ambiguity strings. These ambiguity strings arise because only some, rather than all, of the exons and introns of each gene are amplified and sequenced in this version of the typing system. (The inability to phase linked polymorphisms within an amplicon does not contribute to genotyping ambiguity since this is a clonal sequencing system.) Some of these ambiguity strings reflect differences at synonymous sites. The ambiguity strings for DQA1 and DRB4 are longer than for many of the other loci because allelic polymorphisms in exon 3 for these loci are not analyzed in the current HLA typing system.
Many of the limitations noted above, such as the lack of complete bi-directional coverage and some residual ambiguity for some samples, can be addressed with the longer sequence reads made possible with the recently launched Titanium GS FLX system for amplicon sequencing. We are currently working on an expanded primer set with longer amplicons and greater coverage of class I exons. Table 3 shows the ambiguities (number of indistinguishable alleles) obtained per locus in this set of 20 samples with the GS FLX standard chemistry. A reduced number of ambiguities would be generated with the expanded primer set and Titanium sequencing. In addition, with longer amplicons and longer reads, the sequence reads often end outside the exon so that the issue of lower confidence at the read end will not affect the genotype assignment. We have also carried out amplification and GS FLX Titanium sequencing of the amplicons generated with this same set of primers (see below).
Results of Titanium run with alpha study primers
As expected, the length of the sequence reads obtained with the Titanium reagents was longer, achieving complete coverage of the amplicon, as illustrated in Figure 5B. In general, the Conexio software assigned the same genotypes as in the standard GS FLX run. However, as shown in Figure 5B, the increased length of the Titanium reads allows correct genotyping of sample 3, HLA-B since the mismatch that occurred at the end of the reverse sequence reads with GS FLX standard chemistry was in the middle of the sequence in both directions.
Discussion
Given the extensive allelic diversity at the HLA class I and class II loci as well as the patchwork pattern of polymorphism, which makes setting phase for linked polymorphisms difficult, allele-level HLA typing is challenging and most typing methods result in long ambiguity strings. Next generation sequencing using the 454 Life Sciences GS FLX system with Conexio ATF software offers the potential for high-throughput, high-resolution HLA sequencing (13). The clonal sequencing property of this system allows setting the phase of linked polymorphisms within an amplicon resulting in shorter ambiguity strings. A further advantage is that it allows the use of generic primer pairs in a single genomic amplification, such as the DRB primers which amplify exon 2 of the DRB1 and DRB3/4/5, to determine genotypes at all of these loci.
The results of the double blind eight site study reported here indicate that this amplicon sequencing system for HLA class I and class II typing is robust and reliable. The concordance of genotype assignment was high, even though some of the participating labs had little or no previous experience with GS FLX sequencing and the Conexio ATF software. The overall genotype concordance was 97.2% for those samples with a known genotype (see below) and ranged among the eight sites from 95.6% to 99.4%. Concordance was highest for the class II genotype assignments ranging from 98% to 100%.
Of the 20 DNA samples analyzed in this study, three contained novel sequence variants not present in the IMGT HLA database. As illustrated in Figure 4, sample 10 contained a novel HLA-A allele, detected in this system as an abundant sequence (n =122 copies) that contains a variant sequence motif (one mismatch in column MM0) of A*0201. The Conexio ATF software characterizes this difference as an insertion which is in agreement with the submitted genotype (see Table S2). Confidence in calling this a new variant is increased since the insertion did not appear within or near a homopolymer run. With implementation of Titanium chemistry, the variant sequence motif was detected in both directions, further verifying evidence of a new allele (data not shown).
There are, however, some limitations of the current system and room for improvements in both the workflow process and the resolution of HLA typing. Given the panel of primers used here, not all alleles were distinguished. Increased coverage of HLA exons and introns would result in a further reduction in ambiguity. GS FLX Titanium reagents and software allow longer sequence reads (avg. 450 bp) than those obtained with the standard GS FLX system (avg. 250 bp). An expanded set of HLA primers, currently under development, generates more and longer amplicons, includes more exons and intronic sequence, spanning multiple exons in some cases and provides higher resolution typing. These primers and the Titanium system will be used in a future study.
In addition, the manual workflow used in this alpha study was time consuming and labor intensive requiring five days to genotype 20 samples. Nonetheless, two of the participating labs (CLIA and ASHI certified for HLA) estimated that to type these 10 loci in 20 samples by Sanger sequencing to the same level of resolution would require an average of 13 eight-hour work days and approximately equivalent reagent costs. Thus this system was clearly cost-effective, even with the manual workflow. In some participant labs considerable progress has been made already in automating the genomic PCR and amplicon handling steps using a Biomek® FX (Beckman Coulter) or a STAR robot (Hamilton, Reno, NV), as well as in bead recovery following emPCR using a robotic enrichment module (REMe; Roche Applied Science, Indianapolis, IN). The implementation of these process improvements should make the GS FLX HLA sequencing assay, not only robust and high-throughput, as demonstrated in this multi-site study, but also a convenient, practical, and cost-effective approach to achieve allele-level HLA typing.
Supplementary Material
Acknowledgments
This work was partially funded by NIH grant #AI067068. Thanks to Kim McGowan and Bozena Hanczaruk for technical assistance, to Gregory Turenchalk for Bioinformatics assistance, to Grant Hillman for Excel macro programming and to P. Moonsamy for contributions to primer design and editing of the manuscript.
References
- 1.Lee SJ, Klein J, Haagenson M, et al. High-resolution donor-recipient HLA matching contributes to the success of unrelated donor marrow transplantation. Blood. 2007;110:4576–83. doi: 10.1182/blood-2007-06-097386. [DOI] [PubMed] [Google Scholar]
- 2.Flomenberg N, Baxter-Lowe LA, Confer D, Fernandez-Vina M, Filipovich A, et al. Impact of HLA class I and class II high-resolution matching on outcomes of unrelated donor bone marrow transplantation: HLA-C mismatching is associated with a strong adverse effect on transplantation outcome. Blood. 2004;104:1923–1930. doi: 10.1182/blood-2004-03-0803. [DOI] [PubMed] [Google Scholar]
- 3.Kawase T, Morishima Y, Matsuo K, Kashiwase K, Inoko H, et al. High-risk HLA allele mismatch combinations responsible for severe acute graft-versus-host disease and implication for its molecular mechanism. Blood. 2007;110:2235–2241. doi: 10.1182/blood-2007-02-072405. [DOI] [PubMed] [Google Scholar]
- 4.Greinix HT, Fae I, Schneider B, Rosenmayr A, Mitterschiffthaler A, et al. Impact of HLA class I high-resolution mismatches on chronic graft-versus-host disease and survival of patients given hematopoietic stem cell grafts from unrelated donors. Bone marrow transplantation. 2005;35:57–62. doi: 10.1038/sj.bmt.1704741. [DOI] [PubMed] [Google Scholar]
- 5.Loiseau P, Busson M, Balere ML, Dormoy A, Bignon JD, et al. HLA Association with hematopoietic stem cell transplantation outcome: the number of mismatches at HLA-A, -B, -C, -DRB1, or -DQB1 is strongly associated with overall survival. Biol Blood Marrow Transplant. 2007;13:965–974. doi: 10.1016/j.bbmt.2007.04.010. [DOI] [PubMed] [Google Scholar]
- 6.Maury S, Balere-Appert ML, Chir Z, Boiron JM, Galambrun C, et al. Unrelated stem cell transplantation for severe acquired aplastic anemia: improved outcome in the era of high-resolution HLA matching between donor and recipient. Haematologica. 2007;92:589–596. doi: 10.3324/haematol.10899. [DOI] [PubMed] [Google Scholar]
- 7.Horn PA, Elsner HA, Blasczyk R. Tissue typing for hematopoietic cell transplantation: HLA-DQB1 typing should be included. Pediatr Transplant. 2006;10:753–754. doi: 10.1111/j.1399-3046.2006.00558.x. [DOI] [PubMed] [Google Scholar]
- 8.Shaw BE, Gooley TA, Malkki M, Madrigal JA, Begovich AB, et al. The importance of HLA-DPB1 in unrelated donor hematopoietic cell transplantation. Blood. 2007;110:4560–4566. doi: 10.1182/blood-2007-06-095265. [DOI] [PubMed] [Google Scholar]
- 9.Shaw BE, Marsh SG, Mayor NP, Russell NH, Madrigal JA. HLA-DPB1 matching status has significant implications for recipients of unrelated donor stem cell transplants. Blood. 2006;107:1220–1226. doi: 10.1182/blood-2005-08-3121. [DOI] [PubMed] [Google Scholar]
- 10.Shaw BE, Arguello R, Garcia-Sepulveda A, Madrigal JA. Br J of Haematol. 2010;150:251–8. doi: 10.1111/j.1365-2141.2010.08224.x. [DOI] [PubMed] [Google Scholar]
- 11.de Bakker PIW, McVean G, Sabeti PC, et al. A high-resolution HLA and SNP haplotype map for disease association studies in the extended human MHC. Nature Genetics. 2006;38:1166–72. doi: 10.1038/ng1885. [DOI] [PMC free article] [PubMed] [Google Scholar]
- 12.Maiers M, Grager L, Klitz W. High-resolution HLA alleles and haptotypes in the United States population. Hum Immunol. 2007;68:779–88. doi: 10.1016/j.humimm.2007.04.005. [DOI] [PubMed] [Google Scholar]
- 13.Bentley G, Higuchi R, Höglund B, et al. High-resolution, high-throughput HLA genotyping by next-generation sequencing. Tissue Antigens. 2009;74:393–403. doi: 10.1111/j.1399-0039.2009.01345.x. [DOI] [PMC free article] [PubMed] [Google Scholar]
- 14.Gabriel C, Danzer M, Hackl C, et al. Rapid high-throughput human leukocyte antigen typing by massively parallel pyrosequencing for high-resolution allele identification. Hum Immunol. 2009;70:960–4. doi: 10.1016/j.humimm.2009.08.009. [DOI] [PubMed] [Google Scholar]
- 15.Lind C, Ferriola D, Mackiewicz S, et al. Next-generation sequencing: the solution for high-resolution, unambiguous HLA typing. Human Immunol. doi: 10.1016/j.humimm.2010.06.016. in press. [DOI] [PubMed] [Google Scholar]
- 16.Robinson J, Waller MJ, Fail SC, et al. The IMGT/HLA database. Nucleic Acids Res. 2009;37:D1013–7. doi: 10.1093/nar/gkn662. [DOI] [PMC free article] [PubMed] [Google Scholar]
- 17.Mashayekhi F, Ronaghi M. Analysis of Read-Length Limiting Factors in Pyrosequencing Chemistry. Anal Biochem. 2007;363:275–287. doi: 10.1016/j.ab.2007.02.002. [DOI] [PMC free article] [PubMed] [Google Scholar]
Associated Data
This section collects any data citations, data availability statements, or supplementary materials included in this article.